Contact Melting in Simple Eutectic System
V. S. Savvin, Ye. Yu. Pomytkina, and N. N. AnokhinaUral Federal University, 19, Mira st., Yekaterinburg, 620002, Russia
Abstract.The growth of the liquid interlayer in the system lead-tin at 463 K is studied experimentally in the nonstationary diffusion process of contact melting. The contact melting was carried out between pure tin and solid solution of tin in lead (0, 5.9, 11.5, 17.8, 24.8 mol. % Sn). The results indicate that the concentration range of the liquid interlayer corresponds to the interval of homogeneity of the liquid phase in the phase diagram at the experiments temperature. It is shown that the solid solution corresponding to the solidus near the liquid/crystal interface can not be generated by the diffusion of atoms from the liquid into the crystal. An explanation is offered that the solid solution of solidus composition at the liquid/crystal interface occurs as a result of the precipitate from the metastable (supersaturated by lead) melt.
1 Introduction
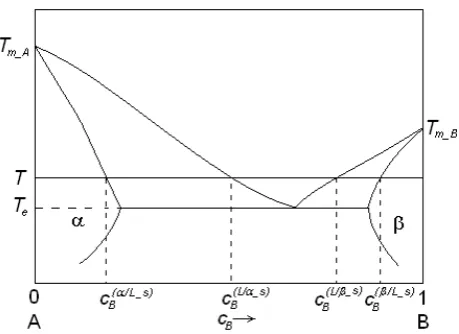
Contact melting is melting of the crystal as a result of exposure to the surface of another adjacent phase – an extrinsic crystal, liquid or vapor [1]. In this paper is considered the emergence and the growth of the liquid phase in the contact of the crystals at the temperature T, which is above the melting point of eutectic Te, but below
the melting temperature of some of the original crystals (figure 1).
Fig. 1. Phase diagram of a simple eutectic system
In this paper we carried out contact melting in the nonstationary diffusion process. This process occurs if samples A and B are fixed and arranged vertically and a denser material is located at the bottom [2]2. In this case in the contact zone the isoconcentration planes move in accordance with the parabolic law [2, 3]:
t
n
t
n
z
(
k,
)
(
k)
, (1)where nk is the concentration of one of the components of
the system A-B, z(nk,t) is the coordinate of the
isoconcentration plane with the concentration nk in an instant t, λ(nk) is the kinetic factor, corresponding the
concentration of nk. The concentration nk and the relative
concentration ck are linked by the expression
n
n
k
A
B
n
c
k
k A
B,
,
. In the expression(1) it is taken into account that the diffusion process between the two samples, each of which is homogeneous, begins at time t=0 in the plane z=0.
A number of papers (e.g., [4]) propose a sequence of processes leading to the contact melting: the diffusion of atoms from the adjacent phases into the crystal, the formation of supersaturated solid solution in the near-contact area of the crystal, the appearance of liquid in the decay of supersaturated solid solution. The main disadvantage of this scheme is the impossibility of formation of saturated and supersaturated solution in an initial crystal for a finite time with known mechanisms of diffusion.
From the experiments [2, 3] it follows that by the diffusion growth of the intermediate phases the interfaces move in accordance with the parabolic law (1). This means that during the experiment the compositions of phases in the planes adjacent to the interfaces are constant. In the present paper a possible mechanism for the establishment of quasi-equilibrium state at the crystal-liquid interface is proposed in contact melting in a simple two-component eutectic system.
Fig. 2. Distribution of component B in the contact zone
A system of lead-tin served as the object of study. According to [5] the melting temperature of eutectic of this system is equal to 456 K. The solubility of tin atoms in a solid lead at this temperature reaches 28.1% tin, and the solubility of lead atoms in a solid tin – 1.3% lead. The diffusion annealing was performed at the thermostat temperature of 463 K.
2 Diffusion of atoms from liquid to solid
phases in contact melting
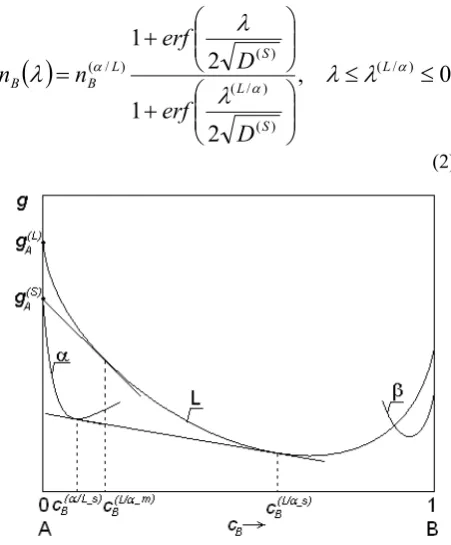
We shall investigate the possibility of establishing a quasi-equilibrium state at the crystal-liquid interfaces by diffusion of atoms from liquid to solid phase under the condition of diffusion growth of the liquid phase. Figure 2 schematically shows the distribution of component B in the diffusion zone, consisting of the initial crystals and the intermediate liquid phase. Figure 3 shows the curves of the Gibbs energy for the liquid L and for crystals α and β. In thermodynamic equilibrium the liquid with a relative concentration cB(L/α_s) is conjugated
with a solid solution, the relative concentration of which
cB(α /L _s).
Let the initial α-sample consists of A-sort atoms only. We shall suppose that the constant composition cB(α /L _s) is
realized in some way at the interface with the liquid from the α-crystal. Then the distribution of the component B in the α-crystal, formed by diffusion, has the form
,
0
2
1
2
1
) / (
) (
) / (
) ( )
/
(
LS L
S L
B B
D
erf
D
erf
n
n
(2)
Fig. 3. The curves of molar Gibbs energy describing the phase equilibrium at temperature T> Te in a simple eutectic system
According to our measurements, details of which are listed below, the interface movement of liquid-lead is estimated by the kinetic factor λ(L/α)~-10-5 m/s1/2 for contact pair Pb-Sn at 463 K. To estimate the diffusion coefficient in the solid phase D(S), required for the formula evaluation (2), we shall use the available data on the diffusion of tin atoms in a solid lead [6]. These data extrapolation to a temperature of 463 K leads to the result
D(S)=2.05·10-16 m2/s. If we shall substitute these values in argument of function erf(ψ) in the formula (2), then
erf(ψ)≈-1 and the direct formula evaluation (2) is difficult. Therefore, we shall expand the function erf(ψ) in an asymptotic series [7] and confine to the first two expansion terms:
0
...,
)
exp(
1
)
(
2
2
erf
, (3)then from (2) we obtain
( / )) (
2 2 ) / ( )
/ (
) /
(
exp
4
,
LS L L
L B B
D
n
n
.
(4)
After the transformation of (4) we shall obtain subject to (1) an estimate of the penetration depth of the tin atoms diffusion from liquid into solid lead:
) / ( )
/ ( ) / (
) ( )
/
(
(
)
2
ln
,
L LB B L
S
B
L
t
z
z
n
n
D
n
z
z
For example, it results from (5) that the filling
nB/nB(α/L)=0.75 is achieved after 3600 s from the
beginning of the experiment at a depth equal to two atomic diameters of lead (dPb=3.62 10-10 m).
Thus, in terms of diffusion forming of a contact zone, which includes a liquid interlayer, the depth of penetration of extrinsic atoms from liquid to solid sample is so small that it does not provide conditions similar to a stable equilibrium at the interface. The degree of validity of the conclusion of unattainability by diffusion the states close to equilibrium (cB(α/L_s)/cB(L/α_s)) will increase even
more if we shall abandon the artificial fixation of concentration cB(α/L_s) at the interface on the crystal side.
At the same time the experiment shows that the law of the interface movement (1) complies with the first moments of contact melting. We can assume that the interfacial equilibrium is established between the unstable, relative to solidus, solid solution and metastable liquid. The possibility of such quasi-equilibrium state is conditioned by the high diffusion mobility of atoms in the liquid as compared with the crystal. An example of the balance between the pure crystal A and the supersaturated of the component A liquid with a relative concentration
cB(L/α_m) is shown in figure 3. The criterion of the
existence of the metastable region of a liquid interlayer between the compositions cB(L/α_m) and cB(L/α_s) is the
deviation of the liquid concentration at the interface from the stable liquidus cB(L/α_s), which can be found by
experiment.
3 The system of equations
characterizing the growth of the liquid
interlayer between the fixed solid
samples
The projection on the z axis is the flux density of component k in the liquid interlayer relative to the laboratory system, in which the initial solid samples of α and β are fixed, has the form
)
,
(
,
) (0
wn
k
A
B
z
n
D
n
u
j
L k kk k
k
, (6)where uk is the projection of the velocity of component k, D(L) – the diffusion coefficient in the liquid phase, w – velocity projection of the convective displacement of the liquid.
In papers [8, 9] it was found that the partial molar volumes of melts components of the lead-tin system does not depend on the composition. Then the convective displacement of the liquid interlayer in contact melting occurs only as a result of the volume effect of the melting of initial solid samples. We shall assume that the liquid interlayer has the shape of a cylinder with cross section Ω(L), different from the cross section of solid samples
Ω(S). The substance occupied a volume |z(L/i)| Ω(S) in the solid i-phase (i(α, β)), after melting will take volume |z(L/i)-z
0|Ω(L), where z0 is a convective displacement of the
liquid interlayer. The substance contained in these volumes becomes liquid:
,
(
,
)
) ( ) ( 0 ) / ( ) ( ) ( ) / (
i
v
z
z
v
z
L i L i L i S i L, (7)
where v(i) is the molar volume of the substance in the i -phase, v(iL) – the molar volume, which would take the substance of the i-phase at the congruent melting. From the system of equations (7) we shall express Δz and find the velocity w=d(z0)/dt. Subject to (1) we obtain
)
8
(
.
2
2
1
0 ) / ( ) ( ) ( ) / ( ) ( ) ( ) / ( ) / ( ) ( ) ( ) ( ) (t
t
v
v
v
v
v
v
v
v
w
L L L LL L L L
We shall substitute (6) using (8) in the equation of
continuity
0
0
z
j
t
n
k k. In this case we use the result
of [10]10, where it was concluded that there was no in lead-tin explicit dependence of the diffusion coefficient on composition. We obtain
)
,
(
,
0
2
0 2 2 )(
k
A
B
z
n
t
z
n
D
t
n
k L k k
. (9)
With the substitution
t
D
z
z
D
L (L)0 ) ( 0
2
2
, (10)we shall transform the equation (9) to the form
)
,
(
,
0
2
2 2B
A
k
d
n
d
d
dn
k k
. (11)The solution (11) has the form
)
,
(
),
(
)
(
P
Q
erf
k
A
B
n
k
k
k
, (12)where Pk and Qk are constants.
Based on (12), we shall formulate the interface conditions:
)
(
),
(
) / ( ) ( ) / ( ) ( ) / ( ) / ( ) / ( ) ( ) / ( ) ( ) / ( ) / (
L A A L B L B L A L A L A L A A L B L B L A L A L Aerf
Q
P
v
c
v
c
c
erf
Q
P
v
c
v
c
c
(13)where, in accordance with (10),
) ( 0 ) / ( ) / ( ) ( 0 ) / ( ) / (
2
,
2
L L L L L LD
D
, (14)and vA(L) and vB(L) are the partial molar volumes of
2 ) / ( ) / ( 2 ) / ( ) / ( ) / ( ) / ( ) (2
2
L L L L L L LD
(15)Where
z
(L/)
z
(L/)
t
is the kinetic factor characterizing the increase in the extent of the liquid layer and being the experimentally measured value.In the sequel we shall agree that the β-phase is a pure substance B, for the system under study – tin, and α-phase may represent as a pure substance – lead, as well as a solid solution of tin in lead.
We obtain the next system equation based on (6) and (12), applying these expressions to the liquid at the interface with the β-phase. From the previous section it follows that the amount of matter which diffuses from the liquid to the solid phase in the growth process of the liquid interlayer can be neglected. Therefore, the velocity uA of the component A at the interface with the β-phase is equal to the velocity of the interface
t
dt
dz
u
L L LA / ) ( / )
/
( / )/
2
(
. Subject to (1),(8) and (10) we obtain
) / ( ) ( ) / ( ) ( ) / ( ) / ( 2 ) / ()
(
exp
L L B L B L A L A L A L Av
c
v
c
c
Q
(16)Another equation is an obvious statement that all amount of the component A, located in the melt part of the α-phase, transferred to the liquid interlayer:
) / ( ) / ()
(
) ( ) ( 0 ) / ( ) ( ) ( ) / ( ) ( L L z z A L L L L A S L Adz
z
n
z
z
n
z
n
(17)After changing the variable z to the variable ψ and expression nA(αL) – the concentration, which would have
component A at the congruent melting of the α-phase – through a molar fraction of cA(α) of component A in the
α-phase, the expression (17) becomes
) / ( ) / ()
(
) ( ) ( ) ( ) ( ) / ( ) (
L Ld
erf
Q
P
v
c
v
c
c
A A L B B L A A LA (18)
The equations (13), (15), (16) and (18) constitute a system, which connects the values determining the growth of the liquid interlayer in contact with the initial solid samples.
4 Methods of measurements
In this paper we used the method of contact melting, as proposed in [2]. We used metals containing 99.9999% Pb and 99.999% Sn. Initial samples were made by retraction of the melt in a glass tube with a diameter of about 3 mm. The ends of the samples designed for the contact were polished. The samples were inserted on both sides of a short segment of a glass tube, which prevents the leakage of the liquid from the contact zone in the process of diffusion annealing, and gives a liquid interlayer the form close to cylindrical. In this case the ends of the samples do not contact. The result assembly is fixed in a special holder and placed in an upright position into a liquid thermostat. To prevent a convective mixing of the liquid formed in the samples contact the sample from the more dense matter, lead, placed underneath.
The thermoregulation liquid was glycerol. To equalize the temperature in the thermostat the thermostatic liquid was continuously mixed with a vane-type agitator. Temperature variations do not exceed ±0.2 K. The absence of temperature gradient near the sample was fixed with the help of a differential thermocouple. After the temperature stabilization in the thermostat the solid samples were juxtaposed before touching with polished ends, after which the liquid interlayer starts to grow. In the process of diffusion annealing the solid samples are fixed. After the diffusion annealing the samples were quenched in cold water, a longitudinal thin section was produced and the extent of the crystallized liquid interlayer, formed during the diffusion annealing, was measured.
The diffusion annealing was carried out at a thermostat temperature of 463 K. The duration of diffusion annealing was typically three hours. During this time the extent of the liquid interlayer reaches ~ 2.5 mm. In all experiments the sample of β-phase was a pure tin. The composition of α-phase in different experiments varied from pure lead to solid solution with 24.8% tin.
In order to clarify the influence of the homogeneity degree of solid solutions on the results of the contact melting, some samples of the solid solution with 24.8% tin were annealed before putting in contact with pure tin at 463 K for 8 hours. The dependence of the results on the preliminary heat treatment of samples was not detected.
5 Results and discussion
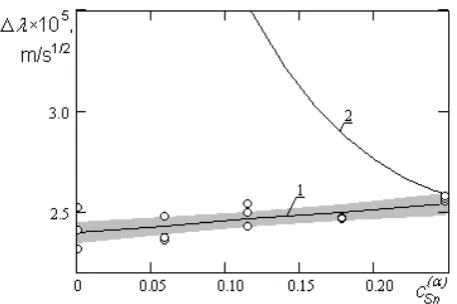
The measurements data of the kinetic factor Δλexp,
characterizing the growth of the liquid interlayer, are shown in figure 4. The shaded band in figure 4 shows the 95% confidence field relative to obtained approximation, which is designed according to recommendations [11].
[5]. The partial molar volumes of components in the liquid interlayer are calculated by [8] and for the study temperature are assumed to be equal vPb(L)=1.91310-5
and vSn(L)=1.69510-5 m3/mol.
At the first stage of calculations we obtained diffusion coefficient for tin-lead melts at 463 K. We used for this the contact melting results between the α solid solution with 24.8% tin and with pure tin. Because of this solid solution is close to the composition of a solid solution maximum possible at the experiment temperature, i.e. to solidus composition of the lead-side, it is natural to assume that in this case the liquidus concentration at the interface with the α-phase is ensured by force. Therefore we accepted that the molar fraction of lead in the liquid at the interface of the α-phase is equal to the corresponding liquidus value at 463 K, i.e. cPb(L/β)=0.280 [5].
Fig. 4. The kinetic factor characterizing the growth of the liquid layer in contact melting in lead-tin system at the temperature of 463 K, depending on the composition of α-phase. ○ - results of
measurements, shaded bar – 95% confidence region, characterizing the results of measurements, line 1 – the result of
calculation under the assumption cSn(L/α)= cSn(L/α_s), line 2 – the
result of calculation under the assumption cSn(L/α)= cSn(L/α_m)
The solution of equations (13), (15), (16) and (18) relative to the diffusion coefficient leads to the result
D(L)=(0.84+0.01)·10-9 m2/s. The error indicated here is the 95% confidence limit, and considers only the error in measuring the kinetic factor Δλ. The received diffusion coefficient is comparable with the results of [10], where the results of measuring the diffusion coefficient in melts lead-tin are represented at temperatures from 500 to 1000 K for several compositions from 17.6 to 33.9% of lead. It is found out the absence of the significant concentration dependence of the diffusion coefficient. The extrapolation of the results [10] to a temperature of 463 K leads to the value D=(0.92+0.12)·10-9 m2/s, which is coincides within the error with our result.
At the second and final stage the kinetic factor Δλ was calculated with the help of equations (13), (15), (16) and (18) for different compositions of α solid solution. The calculation is made on the assumption that the interface concentration of the liquid corresponds to the liquidus values of the phase diagram. In the calculation of Δλ we used the diffusion coefficient obtained in the first stage of calculations. In the process of obtaining results we used the insensitivity of the diffusion coefficient in melts
lead-tin to the composition of the liquid, which was revealed in work [10].
The results of calculations are shown in figure 4. The calculated values Δλcomp lie within 95% confidence area of approximation of experimental values Δλexp, which indicates the adequacy of the initial assumption relative to the correspondence of the concentration range of the liquid layer to the interval of homogeneity of the liquid phase at the experiment temperature on the phase diagram. In order to demonstrate the sensitivity of the result of calculation Δλcomp to the liquid composition at the interface with the α-phase the kinetic factors were calculated for the case when the liquid from the α-phase side is limited by metastable liquidus cSn(L/α_m). The
definition scheme cSn(L/α_m) for the case when the sample
of the α-phase is a pure substance A, is shown in figure 3. The values cSn(L/α_m) for solid solutions are determined
similarly. The values estimate cSn(L/α_m) was made on the
basis of thermodynamic data on the system lead-tin [5] with the correction on the phase diagram. The results of calculations Δλcomp using cSn(L/α_m) for solid solutions of
different compositions are shown in figure 4 with line 2. It is seen that with the decrease of tin in α solid solution the calculated kinetic factor Δλcomp for metastable interface (L/α) deviates more significantly from the experimental values Δλexp.
Thus, the composition of the liquid at the interface with a solid sample coincides with the liquidus value at the temperature of diffusion annealing: cSn(L/α)= cSn(L/α_s). It
was shown above that the quasi-equilibrium at interfaces can not be achieved by the liquid diffusion into the crystal diffusion. Therefore, we propose the following model to achieve the quasi-equilibrium state at interfaces. Initial samples are melted under the influence of an extrinsic phase with the formation of metastable, i.e. supersaturated by the substance of the solid sample, liquid. The role of a extrinsic phase in the initial moment is adjacent solid sample, and further the liquid formed under the contact of solid samples. As a result the part of the liquid interlayer which is adjacent to the initial sample is in a metastable, i.e. in the supersaturated by the substance of the original sample, condition.
The lifetime of the metastable liquid depends on the random processes leading to the formation of nuclei of a stable solid solution. The probability of nucleation of a stable solid solution on the surface of a solid sample is significantly higher than in the liquid volume. As a result of the decay of the metastable liquid region adjacent to the solid sample is the growth of stable solid solution of solidus composition on the surface of the original solid sample. Further there is a contact melting of stable solid solutions in the stable phase diagram. After complete melting of the solid solution the liquid reacts with the initial sample again, after which the sequence of states is repeated.
crystallization of metastable liquid. This explains the slight, not docked by the experiment shift the interface composition of the liquid with respect to the equilibrium liquidus to metastable one. It should be borne in mind that different regions of the interface surface at the same time are in various stages of the process.
6 Conclusion
The kinetics of growth of the liquid interlayer is studied in contact melting in system lead-tin. It was stated that the liquid interlayer corresponds to the interval of homogeneity of the liquid phase in the phase diagram. The result is explained by the formation and decay of sections of the metastable liquid at the boundaries of the initial solid samples. The solid solutions of solidus composition providing a concentration range of liquid, bounded with liquidus concentrations are formed in the process of the decay of metastable liquid on the surface of the initial samples.
References
1. D.D. Saratovkin, P.A. Savintsev, Dokl. Akad. Nauk SSSR. 33, 303–304 (1941)
2. P.A. Savintsev, V.I. Rogov, Zavodskaya
Laboratorya. 38, 195–199 (1969)
3. W. Seith, Diffusion in Metallen, Springer-Verlag, Gottingen-Heidelberg-Berlin (1955)
4. I.P. Dobrovolskiy , B.A. Kartashkin, A.P. Polyakov, M.Kh. Shorshorov, Fizika i Khimiya Obrabotki Materialov. 2, 36–39 (1972)
5. B. Predel, Phase Equilibria Crystallographic and Thermodynamic Data of Binary Alloys, in: Landolt-Börnstein: Numerical Data and Functional
Relationships in Science and Technology, New
Series, Group 4, Physical Chemistry Series, Subvolume A XXX (2006)
6. H.A. Resing, N.H. Nachtrieb, J. Phys. Chem. Solids. 21, 40–56 (1961)
7. http://mathword.wolfram.com/erf.html
8. H.A. Tresh, A.F. Crawley, D.W.G. White, Trans. Met. Soc. AIME. 242, 819–822 (1968)
9. R.A. Khairulin, S.V. Stankus, Journal of Engineering Thermophysics. 16, 188–191 (2007)
10. R.A. Khairulin, S.V. Stankus, A.S. Kosheleva, High Temperature. 46, 212–217 (2008)