Dynamics of stochastic membrane
rupture events: effects on drug
delivery and gene expression
Maria Pamela Dobay (nee David)
Dynamics of stochastic membrane
rupture events: effects on drug
delivery and gene expression
Maria Pamela Dobay (nee David)
Dissertation
an der Fakultät für Physik
der Ludwig–Maximilians–Universität
München
vorgelegt von
Maria Pamela Dobay (nee David)
aus Quezon City, Philippinen
Contents
Zusammenfassung xi
Summary xiv
1 Introduction 1
1.1 Motivation . . . 1
1.2 State-of-the art . . . 1
1.3 Overview of the thesis . . . 3
2 Modeling non-viral gene transfer using a hybrid stochastic model 5 2.1 Single cell expression data-derived distributions of exogenous gene expres-sion characteristics . . . 6
2.2 Use of a hybrid deterministic/stochastic model to describe delivery processes 7 2.3 Limitations of differential equation models . . . 8
3 Modeling stochastic cellular processes: dealing with compartments and complex networks 13 3.1 Introduction to pi calculus . . . 14
3.2 The Stochastic Pi Machine (SPIM): a pi calculus implementation . . . 15
3.2.1 Introduction to SPiM . . . 15
3.2.2 Rule-based modeling in SPiM . . . 16
3.2.3 The Gillespie algorithm . . . 17
3.3 Brane calculi: modeling stochastic membrane processes . . . 20
3.4 A Projective Brane calculus with activate, bud and mate as primitive actions (PABM) . . . 22
4 Modeling gold NP uptake and intracelluar distribution 29 4.1 Choice of gold nanoparticles as a case study . . . 30
4.2 Nanoparticle aggregation, uptake, and combinatorial explosion . . . 30
4.3 Pi calculus model of gold NP uptake and intracellular distribution . . . 31
vi Table of Contents
5.1.1 Generation of lipid-coated nanoparticles . . . 34 5.1.2 Reporter system characterization and experiments . . . 34 5.2 Stochastic pi calculus model of PpIX-enduced endosomal escape . . . 36
6 Design considerations for nanoparticles with protein or peptide
modifi-cations for targeted delivery and controlled release 43
6.1 Modeling minimal requirements for HA-mediated endosomal release . . . . 44 6.2 Outlook . . . 45 6.2.1 NP uptake insights . . . 45 6.2.2 Future work in nanoparticle design . . . 46
A Original publication P1 49
B Original publication P2 61
C Original publication P3 87
D Original publication P4 101
E Original publication P5 111
F Manuscript M1 123
List of Figures
2.1 Exogenous gene expression in single cells . . . 7
2.2 GFP expression statistics . . . 10
2.3 Transfection efficiency for PEI and lipofectamine . . . 11
3.1 Rule based modeling . . . 16
3.2 Brane calculus reduction rules . . . 25
3.3 Differences between Brane and Projective Brane Calculi . . . 26
3.4 PABM domains . . . 27
3.5 PABM reduction rules . . . 27
4.1 Spatio-temporal distribution of gold NPs . . . 32
5.1 CMS-based reporter system . . . 37
5.2 Time distributions of PpIX-mediated endosomal escape . . . 38
5.3 Endosome size distribution and NP colocalization intensities . . . 39
5.4 PpIX model flow . . . 40
5.5 SPiM model fits and parameter sensitivity analysis . . . 41
6.1 Cell-type specific uptake II: time-course experiments . . . 46
List of Tables
3.1 Objects and operations of pi calculus . . . 14
3.2 Biochemical and pi objects . . . 15
3.3 Objects and operations of Brane calculus . . . 21
3.4 Reduction rules of Brane calculus . . . 22
3.5 Objects and operations of PABM . . . 23
3.6 Reduction rules of PABM . . . 24
Zusammenfassung
Die Wechselwirkung von Membranen mit kleinsten Masseteilchen ist ein zentrales Element in der Pharmakotherapie wie auch in der Interaktion von Viren und Nanopartikeln mit Zellen. Sie ist gekennzeichnet durch topologische Übergänge wie zum Beispiel die En-dozytose, den Austritt aus dem Endosom sowie den Eintritt in den Zellkern. Bisherige Rechenmethoden eigneten sich allerdings nicht für eine umfassende Beschreibung solcher topologischen Reaktionen. Die vorliegende Arbeit beschreibt und vergleicht die Anwendung mathematischer und regelbasierter Modellierungsmethoden (Pi-Kalkül) auf Daten über die Aufnahme und Verteilung von Nanopartikeln, um das Verhalten nanopartikelförmiger Sys-teme und der zugehörigen zellulären Einsatzorte zu verstehen. Zudem wurde eine formale Modellierungssprache zur Beschreibung topologischer Übergänge entwickelt. Die von uns aufgestellten Modelle wurden mit Hilfe von Experimenten an Modellmembransystemen auf ihre Gültigkeit hin überprüft.
Im zweiten Kapitel wird ein erstes Beispiel für ein nicht-virales Gentransfersystem vorgestellt, in dem der intrazelluläre Transport von Teilchen zu einer direkt messbaren exogenen Genexpression führt. Hierzu wurde in Zusammenarbeit mit J.-T. Kuhr aus der Arbeitsgruppe von Prof. Dr. Erwin Frey ein Hybridmodell aus Differentialgleichungen und einem stochastischen Modell geschaffen. Dieses Modell wurde dazu verwendet, die Ur-sache für Schwankungen von Genexpressionsparametern wie der maximalen Anzahl grün fluoreszierender Proteine (GFP) pro Zelle, der Expressionsrate und des Zeitpunkts des Expressionsbeginns zu verstehen. Es erfasst nicht nur die Verteilung der Daten, sondern kann auch dazu verwendet werden, die Anzahl der tatsächlich transkribierten Plasmide abzuschätzen. Hierbei zeigt sich, dass diese Zahl deutlich kleiner ist als die Anzahl der ursprünglich durch die Zelle aufgenommenen Plasmide. Der größte Verlust an Vektoren vor dem Eintritt in den Zellkern kann dabei der unzureichenden Freisetzung aus den En-dosomen zugeschrieben werden.
xii Zusammenfassung
rudimentären Lösungsansatz für die Darstellung von Zellkompartimenten, jedoch keine op-timale Beschreibung von komplexen Systemen mit tief verschachtelten Reaktionsräumen. Aus diesem Grund führen wir zusätzlich einen Formalismus, den sogenannten “projective brane calculus based on activate, bud and mate as primitive actions (PABM)”, ein. Dieser Formalismus berücksichtigt bestimmte Regeln bei membrantopologischen Umformungen sowie die Heterogenität (“patchiness”) der Membran.
Im vierten Kapitel verwenden wir diese Pi-Kalkül Modelle, um die intrazelluläre Ver-teilung von Goldnanopartikeln zu beschreiben. Die Lokalisierung solcher Nanopartikel in Zellkompartimenten kann mit Hilfe von Transmissionselektronenmikroskopie (TEM) gut visualisiert werden. Des Weiteren sind aufgrund von ausführlichen Charakterisierungsstu-dien über Goldnanopartikel kinetische Daten zu deren Aggregation, Aufnahme, endoso-malem Austritt sowie Eintritt in den Zellkern entweder bereits vorhanden oder aber le-icht abzuschätzen. Unsere Ergebnisse und Voraussagen demonstrieren, dass sich das hier verwendete Kalkül für die Modellierung relativ einfacher Probleme aus dem Bereich der Interaktion von Zellen mit Partikeln eignet. Im Gegensatz dazu wäre die Modellierung solcher Wechselwirkungen mit Hilfe von Differentialgleichungen bereits relativ komplex.
Im Anschluss hieran wurde ein Experiment modelliert und durchgeführt, in dem der topologische Übergang des Austritts aus dem Endosom kontrolliert werden kann. Die dazugehörigen Ergebnisse sind im fünften Kapitel zusammengefasst: In Zusammenarbeit mit A. Schmidt aus der Gruppe von Prof. Dr. Thomas Bein wurden lipidbeschichtete, kolloidal-, mesoporöse Nanopartikel, welche mit Protoporphyrin (PPIX) sowie Atto633-QSY21 konjugiert sind, verwendet, um zeitliche Verteilungen einzelner Austrittsereignisse aus Endosomen zu generieren. Die kontrollierte, lichtinduzierte Auflösung von Endosomen über die Aktivierung von PPIX lieferte überraschenderweise unterschiedliche Profile der Lysis in Fibroblasten und Karzinomzellen. Außerdem variierten die Verteilungen der Auf-nahmeraten dieser Nanopartikel. Um den Einfluss jener Faktoren auf Seiten der Zellen wie auch der Nanopartikel, welche die PPIX-induzierte Lysis beeinflussen, abschätzen zu kön-nen, wurde das Goldnanopartikelmodell erweitert. Details wie der unterschiedliche PPIX-Inhalt pro Nanopartikel, die Anzahl von Nanopartikeln je Endosom sowie die Nanopar-tikelaggregation wurden nun zusätzlich berücksichtigt. Unsere Ergebnisse zeigen, dass die zellabhängigen Verteilungen des Austritts aus Endosomen hauptsächlich durch die mini-male Nettoanzahl von PPIX, die für die Auflösung eines Endosoms erforderlich ist, bes-timmt werden. Dies steht im Einklang mit unseren Daten sowie Voraussagen aus einem weiteren theoretischen Modell über die AbhŁngigkeit des Zeitpunkts des endosomalen Aus-tritts von der Größe des Endosoms.
Zusammenfassung xiii
HA Trimeren pro Fusionspore, von denen drei eine Konformationsänderung durchlaufen müssen, um fusionsfördernd zu werden.
Summary
The interaction of membrane systems with particulate material, a recurring theme in drug delivery, and in virus- and nanoparticle (NP)-cell interaction, is characterized by topological transitions such as endocytosis, endosomal escape, and nuclear entry. However, current computational methods do not provide a way for handling topological reactions. In this work, we describe and compare the application of mathematical and rule-based, pi calculus models to uptake and delivery data in order to understand the behavior of nanoparticulate material with their corresponding cellular targets. We also developed a formal modeling language for specifically handling topological transformations. We subsequently designed and performed experiments on model membrane systems in order to test the validity of the created models.
In Chapter 2, we show a first example of artificial gene delivery, where the intracellular transfer of particulate material has a directly measurable outcome in the form of extroge-nous gene expression. We created hybrid ordinary differential equation (ODE)/two-step stochastic model, in collaboration with J.-T. Kuhr the group of Prof. Dr. Erwin Frey, to understand the source of variation in the distributions of gene expression parameters, such as the maximum GFP per cell, expression rate and expression onset time. The model not only captures the data distributions, but can also be used to estimate the number of transcribed plasmids, which was found to be significantly less than the number of plasmids originally delivered to the cell. Of the processes upstream of nuclear entry, majority of the vector loss has been attributed to poor endosomal escape.
The application of ODEs, however, is limited by describing these upstream events, where a step-by-step description of how particles agglomerate and how these interact with the species in different cell compartments leads to combinatorial explosion. For this rea-son, we created rule-based models, which reduce complexity to the number of distinct
reaction patterns. In Chapter 3, we show how stochastic pi calculus, a rule-based formal language for modeling concurrent mobile, communicating systems, can be used for mod-eling biological systems. Pi calculus semantics, while providing a rudimentary solution for representing compartments, is still not the best suited for manipulating complex sys-tems with deeply-nested compartments. For this reason, we also introduced a formalism, a projective brane calculus based on activate, bud and mate as primitive actions (PABM), that has specific rules for handling membrane topological transformations, and that takes membrane patchiness into account.
distri-xvi Summary
bution of gold NPs. We chose gold NPs because these can be imaged using transmission electron microscopy (TEM) to obtain localization data across cellular compartments. Ad-ditionally, kinetic data for aggregation, uptake, endosomal escape, and nuclear entry are either available or easily estimated for gold NPs, owing to its extensive characterization. Data fits and predictions of NP intracellular distribution at time points used in indepen-dent gold NP studies demonstrate the adequacy of the calculus for modeling relatively simple problems of cell-particulate material interactions, which would have otherwise been already fairly difficult to model with ODEs.
We then created, and subsequently modeled, an experimental system where a topo-logical transition, endosomal escape, is triggered on demand, results of which are sum-marized in Chapter 5. Time distributions of individual endosomal escape events were generated using a protoporphyrin (PPIX)- and Atto633-QSY21-conjugated, lipid-coated colloidal mesoporous silica (CMS) NP system, in a joint project with A. Schmidt from the group of Prof. Dr. Thomas Bein. Controlled, light-induced endosomal lysis through PPIX activation surprisingly yielded different lysis profiles in fibroblast and carcinoma cells, and also exhibited varying uptake profiles. In order to estimate the contributions of cell- and NP-related factors that affect PPIX-induced lysis, we extended the previous gold NP model to include details such as varying PPIX load per NP, NP load per endosome, and NP ag-gregation. Our results indicate that these cell-dependent endosomal escape profiles are primarily influenced by the minimum net number of PPIX required to lyse an endosome. This is consistent with our data, as well as predictions from an independent, theoretical model of escape time dependence on endosome size variance.
Chapter 1
Introduction
1.1
Motivation
The ability to predict and control uptake and intracellular interactions of nanoparticulate material, which include artificial delivery vectors, nanoparticles (NPs), and viruses them-selves, is a central theme in gene and drug delivery. To some extent, control is imbued by adding targeting sequences to artificial vectors and NPs, including cell- and organelle-specific ligands. The numerous steps and interactants in delivery, however, could easily result in unexpected vector behavior [1, 2]. Key to understanding these processes is the creation of quantitative, mechanistic models and experimental model systems, that allow us to dissect and interpolate between the steps in these processes, explain why certain behaviors arise, and eventually use these information in vector design. In this thesis, we focus on the construction of such models and model systems, as well as on the development of a modeling language that is specifically appropriate for detailing effects of topological transformations in the cell.
1.2
State-of-the art
2 1. Introduction
cytotoxicity [5]. Currently, nano-QSAR studies account for most of the modeling done in NP-related research. It has been used to predict the uptake [6] and toxicity [5, 7] of different types of metal oxide particles based on twelve structural descriptors, including area and volume parameters [6, 5], as well as detachment enthalpies of metal and gaseous cations from the NP [5]; QSARs have also been adapted to specifically predict the be-havior of compounds with the lipid bilayer, and has been used in identifying factors that may influence carbon nanotube toxicity [8]. However, it is speculated that there will be no generalized, one-nano-QSAR-fits-all solution due to the extremely high variability of molecular structure, which presumably also translates to a similarly wide variety of action mechanisms; instead, it is surmised that different QSARs will be applied to different classes of NPs [4].
Statistical analysis has also been used to characterize the delivery of both protein-targeted and unmodified NPs; the uptake events in both cases were characterized by a broadly-spread Poisson distribution whose variance is greater than its mean. Such a dis-tribution is consistent with heterogenous adsorption and internalization, i.e. uptake events are random [9]. The fates of NPs following cell division were also demonstrated to be both random and asymmetric; the asymmetry might be due to endosome association with microtubules [10, 9], in turn thought to arise from an evolved, protective mechanism of asymmetric partitioning of damaged proteins [11, 12, 9]. The implications of the study on dosing and delivery are very important: given that number of NPs per endosome is ran-dom, and that intrinsic cell-to-cell variability provides an additional layer of randomness to the delivery process, maximizing the number of dose units per cell is crucial – in this case, defined by the endosome; with the number of endosomes, which effectively limits the number of delivery trials, at around 102 per cell, the minimum dose variation that can be achieved is approximately 10%. Direct cytosolic delivery, however, has been reported to result in the internalization of up to 106 molecules, resulting in a variation of around 0.1% [13, 9]. Consequently, the latter mode of delivery is more desirable, if precise dosing is required [9].
1.3 Overview of the thesis 3
endosome size [21].
It is conceded, however, that more realistic and better-integrated approaches that could bridge the different scales of the problem – from atom to organism, are needed [22, 23]. The complexity of biological networks, however, is itself hampering the development of models that capture this “whole picture”. While ODE models have become a standard for monitoring fluxes of biological and biochemical systems, these suffer severely from problems of scale [20]. This is where the advantages of rule-based modeling, which uses reaction patterns, rather than individual reaction definitions, become evident. Rule based models prevent the combinatorial explosion that would otherwise occur with ODEs, and allow models to be written practically module by module. The latter provides a degree of extensibility, permitting the model to be scaled to higher or lower levels of organization [24]. In this thesis, we describe experimental and modeling solutions for evaluating one of the most problematic steps in targeted gene and drug delivery, endosomal escape. Through the methods presented here, we provide the characterization of a reporter system for detecting single-endosome escape events, which, together with a rule-based model, give insights into the immense influence of cell type-specific uptake on endosomal escape.
1.3
Overview of the thesis
4 1. Introduction
Chapter 2
Modeling non-viral gene transfer using
a hybrid stochastic model
The development of safe and efficient transgene and drug delivery methods has been the focus of extensive research efforts for more than 30 years [27, 28, 29]. Most of the vectors are modified viruses, which have the inherent ability to transfer genetic material to cells; however, safety issues and manufacturing issues have shifted the focus on non-viral vector development [27]. However, the most-used synthetic protocol, lipofection has only been used in 6.4 % of the Phase III vector clinical trials [30, 31]. This is because of the relative inefficiency of the non-viral vector compared to its viral counterparts [27]. At the systemic level, this is due extensive interaction of the vectors with serum proteins, which results in rapid clearance [32]; at the cellular level, this can be due to its inefficient endosomal escape, cytosolic degradation or trapping, and suboptimal transport and nuclear entry [33]. Even if the vector enters the nucleus, the transgene is not necessarily stably integrated into the host genome [29]. Nonetheless, non-viral vectors still present several advantages over viral counterparts, which make further research in the field relevant. For instance, non-viral vectors are associated with less safety, toxicity and immune response-related issues [34]. Additionally, it can carry larger transgenes than 8.0 kb limit of most viral vectors [35]. Currently, a lot of effort is in hybrid vector design. These hybrids ideally contain functional elements from viruses to improve targeting, escape and gene integration efficiency without inducing adverse effects [34]. Nonetheless, the success of any hybrid vector design depends on how well the molecular mechanisms governing its delivery is understood.
6 2. Modeling non-viral gene transfer using a hybrid stochastic model
individual lung epithelial cells.
2.1
Single cell expression data-derived distributions of
exogenous gene expression characteristics
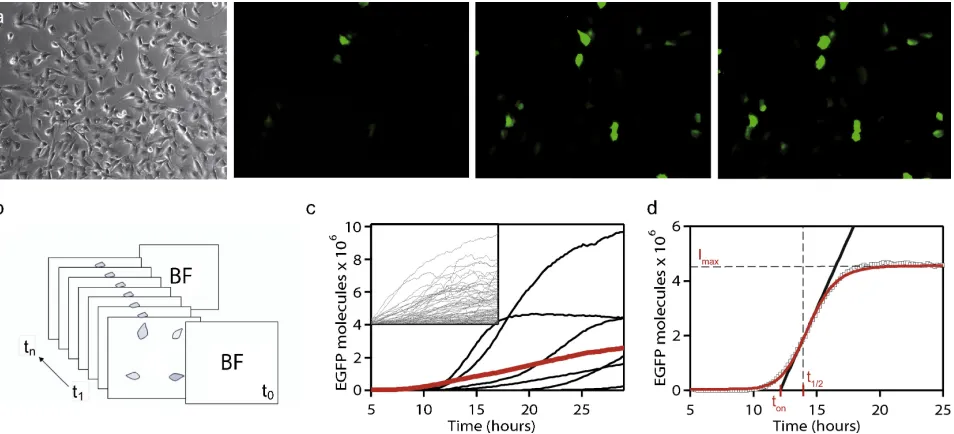
Until early 2000, most experiments investigating gene expression were based on population averages. While such data could be used as indicators for transgene expression efficiency, these naturally do not give insight into the expression behavior of single cells. With the development of semi-automated fluorescence microscopy methods, single-cell image tracking and analysis algorithms, and the and a wider range of fluorophores, single-cell time course studies have become feasible, high-throughput sources of data.
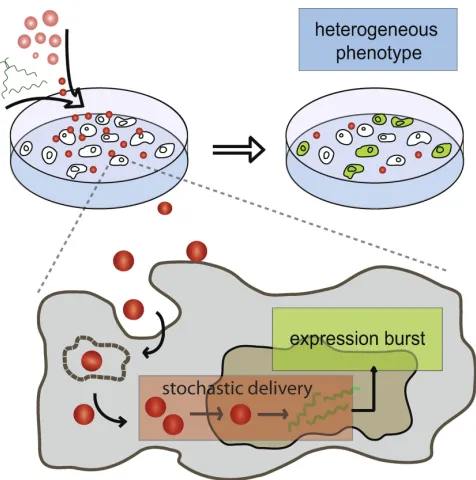
A question that we wished to answer using this approach was how steps in artificial gene delivery influence the population expression characteristics and vice versa. In this study, we analyzed exogenous gene expression from two synthetic delivery vectors, PEI, a cationic polymer; and lipofectamine, a lipid-based system delivery system that condense plasmid DNA into nanoparticle-sized complexes. The two vectors were tested on the lung epithelial cell line, BEAS2B, in both unsynchronized and synchronized setups with plasmids encoding enhanced green fluorescence protein (EGFP) as the load. Each experiment was performed for 30 hours, with a 10-minute sampling interval over 25 view fields. From these images, the change in integrated density over time were extracted for single cells; the integrated density measurements calibrated against EGFP-coated beads to yield the approximate number of EGFP molecules per cell. Typical time-course results for PEI and lipofectamine demonstrate response heterogeneity in terms of exogenous gene expression levels and expression onset (Figure 2.1).
To generate distributions of the maximum expression level Imax, the time to half-maximum expression (t1/2), and the characteristic rise time (trise), we used the following phenomenological fit function to fit individual time traces:
I(t) = Imax 2
1 +tanh
t−t1/2
trise
(2.1)
2.2 Use of a hybrid deterministic/stochastic model to describe delivery
processes 7
Figure 2.1: Single-cell time traces of exogenous EGFP expression using PEI and lipofec-tamine (inset). The population average (red) is shown in comparison. Note the loss of information on the expression variability, as well as the sigmoidal shape of the expression curves. Figure from Paper A [18].
2.2
Use of a hybrid deterministic/stochastic model to
describe delivery processes
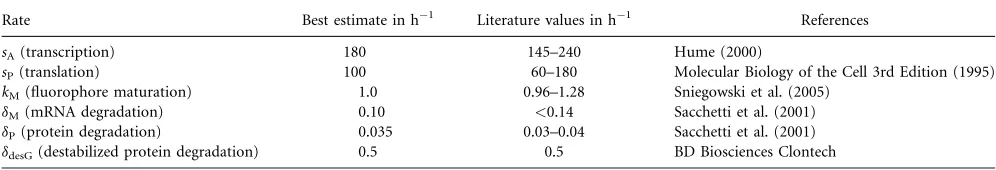
To analyze the expression steady states shown in Figure 2.2, we constructed a hybrid stochastic/deterministic model of nuclear delivery and gene expression. First, we attempt to model the EGFP expression steady state; for this, we used a series of differential equa-tions to describe the expression of EGFP from a single, activated plasmid that considers synthesis (sa, sp) and degradation (δR, δU, δG) rates for RNA, unfolded and folded GFP, as well as a maturation rate for folded GFP (km), from which the following analytical steady state relation can be derived:
Imax =G(t → ∞) =
kmspsA
δGδR(kM +δG)
X (2.2)
which can be alternatively expressed as follows:
[GF P] =kexp[plasmids] (2.3)
8 2. Modeling non-viral gene transfer using a hybrid stochastic model
which leaves [plasmids]to have a value of 1. This result implies that expression level vari-ance originates from a small number of delivered plasmids. We subsequently model delivery as a two-step stochastic process, where the nuclear translocation step, occurs with a prob-ability µ and the plasmid activation step occurs with probability q. The activation step refers to the actual unpacking of the plasmid from a vector and its subsequent expres-sion. We assumed that nuclear delivery occurs rarely, and that the events are statistically independent:
P(C) = µ C
C!e
−µ (2.4)
Supposing that there are X activated plasmids, then n ≥ X plasmids must have first entered the nucleus, with each of the n plasmids having a probability q of being acti-vated. The probability P(X) of findingX activated plasmids is thus given by a binomial distribution:
P(X|n) =
n X
qx(1−q)n−X (2.5)
The distribution of expressed plasmids, directly related to the number of expressed GFPs, can then be related to equation 2.3 with a well defined mean:
h[plasmids]i=µmq (2.6)
The transfection ratio (TR) is then related to this mean, and depends on the average number of complexes delivered, as well asq¯, the effective probability that fromany complex,
at least one plasmid is transcribed:
T R(µ, m, q) = 1−exp{−uq¯} (2.7) For our data, TR is approximately 20 % (Figure 2.3), while the average number of activated plasmids is three, confirming previous reports and estimates on the extremely low amount of vectors that enter the nucleus [19]. The model fits data from synchronized cells; for non-synchronized cultures, the fits are less ideal, given the occurrence of noise occurring from cell cycle-dependence of gene expression.
2.3
Limitations of differential equation models
2.3 Limitations of differential equation models 9
10 2. Modeling non-viral gene transfer using a hybrid stochastic model
between the expression level
I
max
¼
[GFP] and the number
of expressed plasmids
X
¼
[plasmids] is obtained:
½
GFP
# ¼
k
exp
½
plasmids
#
(6)
Here
k
exp
denotes an effective expression factor,
corre-sponding to the number of proteins expressed per transcribed
plasmid in the steady state. With the values given in Table I,
we find
k
exp
$
4
%
10
6
molecules/plasmid, which compared
to the experimental number of molecules (1–15
%
10
6
),
results in the remarkable finding that the number of
plasmids
X
is of order 1. This implies that most of the
variance in expression level originates from stochastic
variations in the small number of plasmids, such that the
distribution of GFP expression is determined by the
distribution of successfully delivered plasmids,
P
(
G
)
&
P
(
X
).
To further substantiate this conclusion, we designed
an experiment where the expression factor
k
exp
is
deliberately modified through the use of destabilized
EGFP. It has a 14-fold higher degradation rate (
d
desG
)
due to an additional amino acid sequence (PEST), which
makes it more susceptible to proteolysis (Kain, 1999).
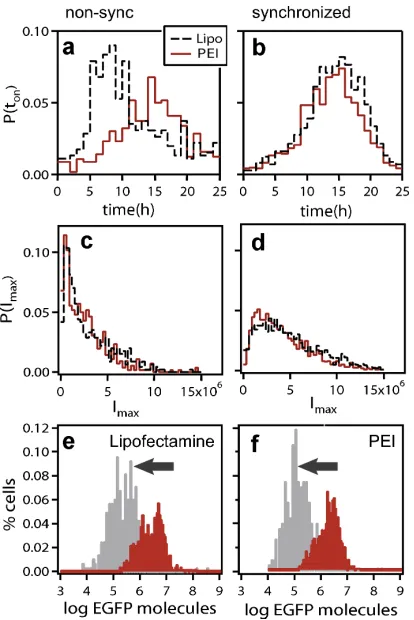
Figure 3e and f display the shift in the steady state
distribution of
I
max
, shown in a logarithmic scale. As
predicted above, the shape of the distribution function is
almost unchanged for both PEI- and
Lipofectamine-mediated transfection. In addition, the peak positions
shifted by a factor 12.5, which is close to the value 14.3
predicted from Equation (5).
Modeling Transfection Noise
Unlike in chromosomal DNA, which contains a fixed
number of genes, the transfection experiments discussed
here result in the delivery of a variable number of genes per
vector. We model gene delivery as a two-step stochastic
process as shown in Figure 4a. As we will argue in the
following, a two-step model is the simplest model that is in
accordance with the experimental data. The model consists
of (i) the nuclear translocation with probability
m
of
complexes containing an average of m plasmids and (ii)
intra-nuclear activation of plasmids, with probability
q
.
Whereas the probability
q
subsumes all phenomena
promoting or interfering with transcription such as DNA
methylation or complexation. We assume that the first
process, the delivery of complexes to the nucleus, is rare and
statistically independent, yielding a Poisson distribution for
the number of delivered complexes
C
:
P
ð
C
Þ ¼
m
C
C
!
e
)
m
(7)
characterized by its mean value
m
. Secondly, the
indepen-dent activation of a plasmid in the nucleus is described
by a Bernoulli process with success probability
q
. The
concatenation of both processes results in an expression for
P
(
X
) which retains the characteristics of a Poissonian.
Mathematical details of its derivation can be found in the
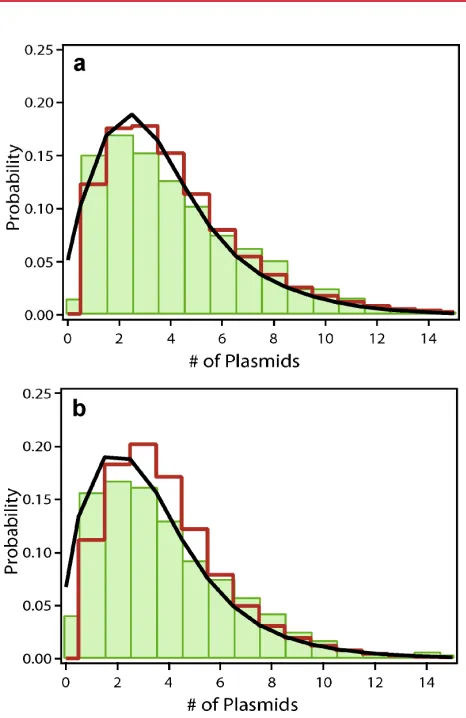
Supplementary Data. Figure 5 shows the calculated
distribution of activated plasmids,
P
(
X
) (red bars), to the
measured experimental protein distribution,
P
exp
(
G
) (green
bars). In addition a theoretical protein distribution is shown
as black lines.
P
theo
(
G
) is obtained from
P
(
X
) by additionally
accounting for noise in gene expression, where we have used
a relative magnitude of 0.3 for post-transfectional noise
from the literature (see Supplementary Data). Note that the
x
-axis of the distributions
P
(
G
) is rescaled by the factor
k
exp
according to Equation (6). The agreement between
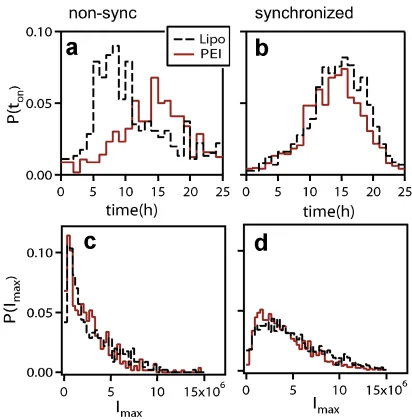
Figure 3.
EGFP expression statistics for PEI- and Lipofectamine-mediated
transfection. Distributions of expression onset times
t
on(
a
and
b
) and maximal
expression values
I
max(
c
and
d
), for PEI-mediated (red) and Lipofectamine-mediated
(dashed black) transfection depict strong variability within the cell cultures. The total
number of expressing cells was 23% out of 560 for PEI and 30% out of 502 in the case of
Lipofectamine.
b
and
d
: Thymidine kinase-synchronized cultures with 40% out of 1981
and 30% out of 1797 cells expressing EGFP for PEI and Lipofectamine, respectively. For
synchronized cells, expression onset time distributions coincide for Lipofectamine and
PEI, indicating that transfection is more likely to happen in specific phases of the cell
cycle. Distributions for
I
max(given in units of EGFP molecules) cannot be explained by
post-transfectional sources of fluctuations alone.
e
and
f
: Effect of the altered
expression rates on the distribution of maximal expression levels
I
max. Distributions
for d2EGFP (gray) and EGFP (red) transfected with Lipofectamine (e) or PEI (f) are
shown. d2EGFP, which has a higher degradation rate, exhibits a systematic shift of the
I
maxdistribution compared to EGFP, independent of the vector used. Besides this shift,
a change in the number of proteins per active plasmid,
k
exp, preserves the shape of the
distribution. This suggests that the shape is determined during plasmid delivery prior to
expression.
Schwake et al.: Predictive Modeling of Gene Transfer
809
Biotechnology and Bioengineering
Figure 2.2: EGFP expression statistics for PEI- (red) and lipofectamine- (black, dashed)2.3 Limitations of differential equation models 11 contain both CFP- and YFP-plasmids in a single complex,
whereas post-mixed complexes contain either CFP- or YFP-plasmids (for clarity see Fig. 6a and b). The steady-state CFP/YFP expression was analyzed at 24 h post-transfection for approximately 15,000 cells. We define the cotransfection ratio,r, as the number of cells expressing both CFP and YFP divided by the number of cells expressing either CFP or YFP. We find that the cotransfection ratio increases from 12.9% for post-mixed complexes to 21.9% for premixed com-plexes. The significant difference could not be explained, if complexes were completely dissolved in the cytosol and delivery of plasmids was independent from the complexes. The two-step delivery model, however, naturally explains the discrepancy between pre-mixed and post-mixed com-plexes. Based on our model, an analytical expression for the cotransfection ratio can be derived (see Supplementary Data) which predicts correctly the measured cotransfection
ratios, if the same parameters are used as determined from the EGFP distribution function.
Discussion
We have measured the distribution of expression onset times and steady-state expression levels derived from single cell fluorescence time courses. Distributions of onset times of PEI and Lipofectamine collapse on a single curve for synchronized cell cultures, suggesting a universal cell cycle-dependent gene delivery mechanism. Synchronized cells exhibit a broad Poissonian distribution in expression levels and cotransfection experiments reveal correlations in the delivery probability for plasmids contained in one complex. Invoking Occam’s razor, we analyzed the findings in terms of an idealized minimalist model of gene transfection, which describes gene delivery as a two-step stochastic process. Yet our model proves to have considerable predictive power by relating measurable quantities such as the overall transfection efficiency, the cotransfection probability and the shape of the gene expression distribution with each other. Thus, the model allows the derivation of the expression factor, the number of activated plasmids per complex and the average number of delivered complexes from the measured single cell transfection statistics. The model also elucidates the origin of expression variance, separating the noise due to small number fluctuations of complexes, which is inherent to the delivery process and extrinsic sources of noise due to cell–cell variability.
In our gene expression model, we refer to complexes as units of coherently delivered plasmids. Those indirectly inferred complexes are consistent with but not necessarily identical to the complexes described in many physico-chemical studies of PEI and lipofectamine mediated transfection. Cationic-lipid complexes are known to form multi-lamellar aggregates that contain a large number of plasmids (Lasic et al., 1997; Ra¨dler et al., 1997; Zabner et al., 1995). Following endocytotic uptake and release, the complexes slowly dissociate in a stepwise, unwrapping mechanism (Kamiya et al., 2002; Lin et al., 2003). PEI complexes are torroids or rods with a typical hydrodynamic radius of 100 nm (Boussif et al., 1995; DeRouchey et al., 2005), which have been seen to be actively transported inside cells (de Bruin et al., 2007) and to accumulate in the periphery of the nucleus (Suh et al., 2003). Both scenarios describe a situation where numerous small complexes have equal chances of entering the nucleus during the course of mitosis, which is consistent with our model assumptions. Microscopy studies have argued favorably for complexes being at least not fully dissolved at the final delivery stage (Lin et al., 2003; Tseng et al., 1999). However, single nuclear entry events have not been documented explicitly. The probability of transgene expression in the nucleus again depends on the nature of the transfection agent. Pollard et al. (1998) reported that cationic lipids, but not PEI prevent gene expression when complexes are directly injected in the Figure 5. Comparison of single-cell data with the theoretical model. The
the-oretical EGFP distribution (black) is intimately connected with the underlying distribu-tion of expressing plasmids (red). To facilitate comparison, the protein distribudistribu-tion has been scaled down by the average number of proteins per active plasmid in steady state, kexp.a andb: For synchronized cultures the measured protein distribution
(green) is fitted very well by our theoretical model (black). The fit for PEI transfection (a) yields an average number of delivered complexes, m¼0.53, and an average number of activated plasmids per complex,meff¼3.2. In the case of Lipofectamine
(b), we findm¼0.37 andmeff¼3.2.
Schwake et al.: Predictive Modeling of Gene Transfer
811
Biotechnology and Bioengineering Figure 2.3: A superposition of the model result (black) with the distribution of expressed
Chapter 3
Modeling stochastic cellular processes:
dealing with compartments and
complex networks
The gene delivery model that we have presented is able to predict the percentage of trans-fected cells, the cotransfection ratio, the distribution of expression levels, and the number of efficient plasmids per complex, which may be used for evaluating gene delivery vec-tors [18]. However, if the scopes of both experiment and model are extended to include mechanistic details of endosomal escape or cytoplasmic trafficking, then amount of detail that has to be incorporated makes it more difficult to create the model using ODEs. For instance, an approach for improving the cytoplasmic transport of vectors could require a study of viral components that mediate engagement and trafficking along microtubules. One might also need to look at signal transduction pathways that viruses activate to induce trafficking [37, 38]. Putting all these information in a model could yield insights into the combinations of components that one could put in a vector. Similarly, comparing models of non-viral and hybrid vector behavior would provide information on the transport com-ponents and mechanisms that can be exploited better [39], while simultaneously resolving some conflicting information on artificial vector transport [40].
14
3. Modeling stochastic cellular processes: dealing with compartments and complex networks
3.1
Introduction to pi calculus
Pi calculus was developed by Milner and colleagues for modeling mobile, concurrent com-municating systems [43], allowing the high-level description and logical analysis of interac-tion, communication and synchronizations between agents known as processes. The basic objects, operations and reduction rules of pi calculus are summarized in Table 3.1.
Object Syntax Description
Process P, Q Agents/objects that make up a system
Channel ?x, !x Named communication ports of processes;
channels are associated with rates, and may be used to pass attributes, channels, or processes between processes
Attributes P(att:type) Process characteristics
Operation Syntax Description
Concurrency P | Q P and Qare processes executed
concurrently
Summation !x.P+?y.Q Represents a competitive choice between mutually
exclusive interactions
Restriction (Series) (vx).P Creation of a new name in P
Replication !P Associated with processes that can always
create a new copy of P
Table 3.1: Objects and operations of pi calculus
In pi, systems are modeled using multiple processes that communicate with each other in a pairwise, synchronized manner over named channels [43]. A computation step is denoted as P −−→rate P0; the main reduction rule of pi calculus is denoted ?x(z).P|!x(y).Q −−→rate P|Q[z/y], showing name-passing between channels. Alternately, an internal state change may be denoted as P −→τ P0, where τ is a delay reaction. These features of pi calculus permit process modification through the acquisition of new communication capabilities [46]. A stochastic extension, where non-determinism is replaced by exponentially-distributed race conditions, was added by Priami for performance modeling of distributed systems; the stochastic extension allows pi calculus systems to be quantitatively analysed with its mapping to a continuous time Markov chain [47]. This particular feature has been used extensively in quantitative models of biological systems [45].
3.2 The Stochastic Pi Machine (SPIM): a pi calculus implementation 15
between biological concepts and objects (Table 3.2); and 3) extensibility, which permits the simulation to be scaled to higher levels of organization than molecules [24]. Pi calculus has since been successfully applied in EGFR network modeling [48], early T cell signaling [49], and more recently, in NP-cell interactions (Chapter 4).
Biochemical object Pi calculus object
Reactant (Proteins, ligands, compartments, etc.) Process
Binding site Channel
State Attribute
Table 3.2: Correspondence between biochemical and pi objects. Note that the definition of the process is broad enough to allow it to be used as an abstraction for a compartment.
3.2
The Stochastic Pi Machine (SPIM): a pi calculus
implementation
3.2.1
Introduction to SPiM
The stochastic pi Machine (SPiM) is an implementation of a stochastic pi calculus variant [50]. In SPiM v.0.05, each process is encoded as a computer object with a scope that corresponds to the visibility of its associated channels; that is, a processP having a hidden channel x excludes another process Q from seeing x. A process may evolve as a result of an action on a channel or through a delay, which is often used to represent a change in internal state of a process [48]. A state change is subsequently effected by changing a parameter specification, the attribution of a new channel, or the redefinition into another process.
In addition to the basic pi calculus implementation, SPiM allows the use of simple pro-gramming language-type statements, including basic conditional statements and boolean operations. This effectively extends the rule-based formalism that pi calculus provides (Section 3.2.2). Parameters in SPiM are also not limited to channel and channel passing, but include attributes that may assume different data types. Although not an integral version of CCS, these attributes have been used in order to provide enough flexibility to handle problems ranging from very straightforward handling of state changes to its ad hoc
16
3. Modeling stochastic cellular processes: dealing with compartments and complex networks
3.2.2
Rule-based modeling in SPiM
Arule specifies features of a reactant that are either required for or are affected by reactions, and how these features are to be “rewritten”, in case the reaction is chosen for execution [52, 53]. Rules can thus be viewed as generalized reaction patterns that permit reactant recognition, a mapping of reactants to products, and an association of a rate law with this mapping [53]. The view of a rule is very local – that is, it often represents a local pattern of a site or a state (Figure 3.1). For instance, given a pair of proteins P and Q that may interact only when P is phosphorylated at site x, a rule would permit any such reaction, regardless of whetherP orQare bound to other proteins or not – thus, the rule only looks at x, and not the whole P and Q – and has the potential to encompass a lot of reactions that would have otherwise been treated as occurring between distinct molecular species [52].
Rule
Reactions
Sunday, March 11, 2012
Figure 3.1: Rule based modeling uses patterns to identify possible reactions, and to map all the reactions encompassed by these patterns into products. In this figure, the reactions that can be encompassed by the illustrated rule are shown. By reducing the number of reactions that have to be defined, rule based models can significantly reduce the combinatorial complexity that features frequently in models of biological systems.
3.2 The Stochastic Pi Machine (SPIM): a pi calculus implementation 17
protein modifications, a frequent feature of signaling pathways. Consider the case of epi-dermal growth factor (EGF) signaling, which involves a network of at least 211 reactions and 322 interactants. Each interactant generally has more than one state that deter-mines its possible binding partners [54]. However, the reactions can be categorized into more general classes such as state transitions, including phosphorylation; association and dissociation; or translocation-type reactions [54]. Assuming that n of the state transi-tion reactransi-tions are phosphorylatransi-tion reactransi-tions, and a general pattern of phosphorylase | substrate→substrate−P, wheresubstrate−P is a state of the substrate process, then these n reactions can be recognized using a single rule, and would not have to defined individually.
In addition to rules, SPiM also implements programming language-like constructs such as if −then statements, which permit the inclusion of reaction preconditions on top of patterns. These constructs could also be used for defining rules in an alternative manner. This is particularly advantageous for problems that could not be represented as chemical reaction-type models.
The strength of combining some logic-based operations of programming languages with a rule-based modeling becomes evident when we need to define thresholds. Suppose that
P has two attributes, a and b, and Q interacts with P with a rate f(a) if a ≤ b and f(b)
if b <a. A SPiM code representation is very straightforward:
let P(a:int, b:int) = if a <=b then
delay@f(a); !react else
delay@f(b); !react
and Q() = ?react; PQ() and PQ() = ()
Assuming further thata andb can each range over values1..nand 1..m, respectively, a plain Gillespie implementation that is able to track all reactions ofP(a: 1..n, b: 1..m)will result in a reaction matrix where the n∗m reactions of P have to be explicitly defined. Overall, these features of SPiM eliminate redundancies often required when ODEs, or even a direct implementation of Gillespie, are used.
3.2.3
The Gillespie algorithm
18
3. Modeling stochastic cellular processes: dealing with compartments and complex networks The physical basis for the stochastic formulation of chemical kinetics lies in the premise that collisions in a well-stirred system in equilibrium occur essentially at random. For such a system, it is possible to calculate the probability P(R1,2) of all pairwise collisions 1,2, occurring in V within an infinitesimal time interval [t, t+δt]:
P(R1,2) =X1X2V−1πr122 ¯v12δt (3.1) where X1 and X2 are the concentrations of molecules S1 and S2, respectively; r12 is the sum of the radii of S1 and S2; and ¯v12 is the average relative velocity of the molecules, assumed to follow a Maxwellian velocity [55]. It is further asserted that astochastic reaction constant c1, solely dependent on the physical properties of the reacting molecules and the temperature of the system, exists, such that the probability of the collision within the time interval[t, t+δt] is:
P(R1,2) = X1X2c1δt (3.2)
This can be generalized for chemical speciesSi, i= 1..N that react throughM reaction channels Rµ, µ = 1...M, for which there must be M constants cµ, µ = 1...M. These yield an expression for the average probability that a particular combination of Rµ reactants will react within[t, t+δt]:
¯
P(Rµ) =cµδt (3.3)
The next step would be actually describe the stochastic time evolution of the system, which is traditionally done by setting up the master equation – in this case, directly derivable from the sum of probabilities of theM + 1 ways by which the system can arrive at a state (X1...XN) at timet+δt:
P(X1, ..., XN;t+δt) = P(X1, ..., XN;t)
"
1−
M
X
µ=1
aµδt
#
+ M
X
µ=1
Bµδt (3.4)
whereaµδtis the probability that a reactionRµwill occur, given the state of the system at timet:
aµδt≡cmuδt×RµC (3.5)
3.2 The Stochastic Pi Machine (SPIM): a pi calculus implementation 19
1. For each Rµ, define the hazard function,hµ:
(a) For reactions of the form S1+S2 →P roduct:
hµ=X1X2 (3.6)
(b) For reactions of the form 2S1 →P roduct:
hµ= 1
2X1(X1−1) (3.7)
2. Calculate P(τ, µ) from the product of (P0(τ)), the probability that no reactions will occur within [t+τ, t+τ +δt] state of the system at time t; and aµδt, which is the probability that reaction Rµ occurs:
P(τ, µ)δt=P0(τ)aµδt (3.8)
Noting that the probability that no reaction will occur at δt is 1−Pνaνδt0 within time δt0, then:
P0(τ+δt0) =P0(τ0)
"
1−
M
X
ν=1
aνδt0
#
(3.9)
Integration of which yields:
P0(τ+δt0) = exp
" −
M
X
ν=1
aντ
#
(3.10)
so that Equation 3.8 can be rewritten as:
P(τ, µ)δt=
(
aµexp−a0τ ,0≤τ <∞, µ = 1...M
0 (3.11)
where aµ ≡ hµcµ and a0 ≡
PM
µ=1aν ≡
PM
µ=1hνcν. It is noteworthy to mention that
P(τ, µ)depends on all reaction constants, as well as the count of all reactant species [55]. With this background, the stochastic simulation algorithm can be algorithmically defined as follows:
1. Initialize t =t0, the system state X = X1...XN, and specify the reaction constants
cµ, µ= 1...M. Set the reaction counter to 0.
20
3. Modeling stochastic cellular processes: dealing with compartments and complex networks 3. Generate two random numbers, r1 and r2, taken from a unit interval
4. Generate values for τ and µas follows:
τ = 1
a0x
ln1 r1
(3.12)
µ= µ−1
X
ν=1
aν < r2a0 ≤ µ
X
ν=1
aν (3.13)
5. Update the time as t + τ; update the system state, and recalculate the reaction hazards for species whose states have changed. Increase the counter by 1.
6. Return to step 2, and iterate until t≥tend
Several methods exist for the Gillespie algorithm, including the direct method [55], and subsequent alternative solutions, which attempt to improve the performance of the algo-rithm such as the next reaction method [56], the slow-scale stochastic simulation algoalgo-rithm [57], and tau-leaping [58, 59]. SPiM v.0.05 implements the direct method [50].
3.3
Brane calculi: modeling stochastic membrane
pro-cesses
While pi calculus provides a possibility of representing compartments as processes (Ta-ble 3.2) between which other processes or channels are passed, the fact that it does not have specific reduction rules for these compartment processes could limit its expressivity, given that the consequences of a compartment transformation is not limited to itself, but extends to its contents – in this case represented as attributes. As an example, we can take a fusion-type reaction between two compartments modeled as processes that have different contents. This can be roughly modeled in SPiM using the following commands:
let Compartment_A (a:Proc) = !fuse(a)
and Compartment_B (b:Proc) =
?fuse(a’); (Compartment_AB (a, b) ) and Compartment_AB(a:Proc, b:Proc) = ()
Now, supposing Compartment_AB itself can merge with other compartments, the code has to be modified as follows:
let Compartment_A (a:Proc) = !fuse(a)
3.3 Brane calculi: modeling stochastic membrane processes 21
?fuse(a’); (Compartment_AB (a, b) ) and Compartment_AB(a:Proc, b:Proc) = !fuse(a,b)
and Compartment_X(x1:Proc ... xn:Proc) = () ?fuse(a’,b’); Compartment_ABX(a,b,x1 ... xn)
and Compartment_ABX(a: Proc ,b: Proc ,x1 ... xn: Proc) = ()
One problem that becomes evident in this example is that it is not possible to create a single rule for fusion. This limitation arises from the fact that pi, and particularly SPiM, semantics neither permit the use of process list structures as attributes, nor have native operators that tell the machine what to do with this list. Consequently, a pi implementation that involves topological operations on compartment processes with deeply nested content suffers from a degree of combinatorial complexity.
Brane calculus was introduced for explicitly handling these effects of membrane-bound compartments, and more specifically, of the topological changes that these can undergo, in models of biological systems [45]. Cardelli’s brane calculus introduces the concept of
branes as dynamic wrappers that contain other branes or (pi) processes. Actions refer to the rules that define how branes may interact, and the consequences of these reactions; these are directly inspired by the actual topological transformations that biological membranes undergo. Actions include uptake-type reactions in the form ofphago andpino; fusion-type reactions in the form ofmate andexo; and split-type reactions in the form of bud anddrip. Figure 3.2 summarizes the rules of the calculus, while Tables 3.3 and 3.4 provide details of the syntax and reduction rules. Note that the fusion-type reactions, exo and mate result in the mixing the branes, or of both the branes and their content, respectively.
Object Syntax Description
System [σ](|P |) Parallel compositions of Branes and their
contents
Brane [σ] Membrane bound compartment that can
contain other Branes or (pi processes)
Action σ, τ ∈ {phago,pino, Names of brane calculus rules; each action is
exo,mate,bud,drip} associated with a channel to delineate inter-action specificity
Process P,Q Agents/objects that
Operations Syntax Description
Parallel, Systems [σ](|P |)◦[τ ](|Q|)
Parallel, Actions σ|τ
Series τ.σ
Choice σ+τ
Table 3.3: Objects and operations of Brane calculus
22
3. Modeling stochastic cellular processes: dealing with compartments and complex networks Action Reduction rule
phago [σ|phago!x](|P |)◦[τ|phago?x](|Q|)→[τ ](|[−](|[σ](|P |)|)Q|) pino [σ|phago!x|phago?x](|Q|)→[σ](|[−](| − |)Q|)
exo [τ|exo?x](|[σ|exo!x](|P |)Q|)→P ◦[τ|σ](|Q|) mate [σ|mate!x](|P |)◦[τ|mate?x](|Q|)→[σ|τ ](|P ◦Q|)
bud [τ|bud?x](|[σ|bud!x](|P |)Q|)→[τ ](|[σ](|P |)Q|)◦[τ](|Q|) drip [σ|bud!x|bud?x](|Q|)→[σ](| − |)◦[σ](|Q|)
Table 3.4: Reduction rules of Brane calculus
language that sufficiently captures most features of a cellular system. Going back to the example given at the start of this section, the whole can be re-written simply in brane as follows; note that there are no explicit specifications of the product, given that this would be resolved by the reduction rules, with the order of reactions being determined as in Section 3.2.3:
[ mate!x|bud?x|bud!x](|A[−](|a|)|)◦[ mate!x](|B[−](|b|)|) (3.14) Danos and Pradalier extended the calculus by introducing the concept of sidedness
– that is, that the outer and inner layers of a biological membrane can be specified to have different interaction capabilities – in order to create a language closer to biological membranes (Figure 3.3, [60]). The calculus essentially has the same objects and actions as Cardelli’s brane calculus, and has the difference in the syntax that reflects the sidedness of a brane: [hσ; τi](|P |), with σ representing the actions on the outer leaflet, and τ, of the inner leaflet.
3.4
A Projective Brane calculus with activate, bud and
mate as primitive actions (PABM)
In our work [44], we further extended projective brane calculus by introducing the concept of domains, or brane patches. Unlike in previous calculi where branes are treated as con-tinuous objects, domains allow portions of membrane to behave autonomously (Tables 3.5 and 3.6). The use of domains imbues greater control over how membranes are merged and split. This is most evident in the case of bud, where the extruded membrane is derived exclusively from the domain that received the trigger to bud (Figure 3.4).
3.4 A Projective Brane calculus with activate, bud and mate as primitive
actions (PABM) 23
Object Syntax Description
System [~ρ](|P |)◦Q System of Branes
Brane [~ρ] Membrane bound compartment
that can contain other Branes or (pi processes)
Domain ~ρ≡ hσ1; σ2i Discrete part of a membrane containing
functionally-related actions
Action σ ∈bx, mx,!x ; reduced to mate and bud, with its
corresponding activator
Process P,Q Agents/objects that make up a system
Operations Syntax Description
Parallel, Systems [~ρ](|P |)◦[~ρ](|Q|) Systems [~ρ](|P |)◦[~ρ](|Q|) occur concurrently Parallel, Domains hσ1; σ2i|hτ1;τ2i Domains hσ1; σ2i|hτ1; τ2i occur concurrently
Parallel, Actions σ, τ Actions σ and tau occur concurrently
Parallel, Processes P | Q P and Q are processes executed concurrently
Series σ.τ Indicates that σ can only be executed
after σ
Choice σ+τ Indicates that either σ or τ can occur;
selection of one results in the elimination of other option
Replication, Parallel (n)σ,(n)~ρ n instances of action σ or domain ~ρ
Replication, Series σ(n) n instances of σ executed one after
the other
Table 3.5: Objects and operations of PABM calculus
interior would be very natural:
[bx.(n)h−;P roteinAi|!x.(m)h−; P roteinBi](|ER|) (3.15)
Here, n and m represent the critical numbers ofP roteinAand P roteinB, accumulated on separate domains, that have to be present before a transport vesicle from the endoplas-mic reticulum (ER) is formed with bud.
Apart from extending brane, we also provide a generalization of its rules, which we reduce from six to two. This is possible by using the concepts of projective invariance and projective equivalence, which first appeared in projective brane calculus [60]. Briefly, pro-jective invariance postulates that thephysics of an interaction does not make a distinction between inside and outside. Given the following system:
[h−; mxi](|[h!x; −i](|P |)◦[hmx; −i](|Q|)◦S|) (3.16)
24
3. Modeling stochastic cellular processes: dealing with compartments and complex networks
Action Reduction rule
bud (Type I), b P ◦[~ρ1|hσ2; bxi](|[ρ~2|h!x; σ2i](|Q0 |)◦R|)−→
P ◦[hσ1; −i](|[ρ~2|h−; σ2i](|Q0|)|)◦[ρ~1 ](|R|) bud (Type II), b [~ρ1|hbx; σ1i](|P |)◦[~ρ2|h!x; σ2i](|Q0|)◦R −→
[~ρ1](|P ◦[hσ1; −i](|[ρ~2|h−; σ2i](|Q0|)|)|)◦R mate (Type I), m P ◦[~ρ1|h!x; σ1i](|Q|)◦[~ρ2|hmx; σ2i](|R|)−→
P ◦[~ρ1|~ρ2|h−; σ1, σ2i](|Q◦R|)
mate (Type II), m [~ρ1|hσ1; mxi](|P ◦[ρ~2|h!x; σ2i](|Q|)|)◦R−→ [~ρ1|ρ~2|hσ1;σ2i](|P |)◦Q◦R
Table 3.6: Reduction rules of PABM
effectively transmuting inside to outside:
3.4 A Projective Brane calculus with activate, bud and mate as primitive
actions (PABM) 25
P Q P Q
Q
P P Q
Q Q
P Q P Q
Q
P P Q
Q Q
phago!x
phago?x
pino!x | pino?x
exo?x
exo!x
mate!x mate?x bud?x
bud!x
drip!x | drip?x
Phago
Pino
Exo
Mate
Bud
Drip
26
3. Modeling stochastic cellular processes: dealing with compartments and complex networks
P Q
R
mate!x mate?x
exo!x exo?x
P Q
R
mate!x | exo?x mate?x
exo!x
P Q
R
exo!x mate?x
exo!x mate?x
A
B
3.4 A Projective Brane calculus with activate, bud and mate as primitive
actions (PABM) 27
!x bx
σ1 σ2
σ3 4
σ5 σ6
σ
σ1 σ3
4 σ
σ2 σ5 σ6
σ1 σ3
4 σ
σ2 σ5 σ6
Figure 3.4: PABM domains delineate discrete regions of a brane on which operations can be performed autonomously. While a bud-type reaction in calculi without domains would result in an extruded membrane that would also include σ5 and σ6, bud with domains would cause the extrusion of the brane defined by the domain locally involved in the bud
reaction.
Figure 3.5: Graphical representation of PABM reduction rules. These rules generalize
endo, pino and exo reactions (top) and mate, bud and drip reactions (bottom) as mate
28
Chapter 4
Modeling gold NP uptake and
intracelluar distribution
Creating a general model for NP uptake and intracellular distribution is an important complementary approach to experimental investigations in NP efficiency and cytotoxicity evaluation. For efficiency estimation, we are mostly interested in finding out how much time is needed for endosomal escape as a function of the physico-chemical features of the NP. In establishing the first model, we wanted to have an idea of how much of the particles localize in the nucleus, based on empirically measured aggregation, uptake, endosomal escape, cytosolic transport and nuclear entry rates, as well as known physical constraints provided by the cell. The model should, of course, capture experimentally-derived intracellular NP distribution before it is extended for cytotoxicity modeling, but extensibility should be an expected feature. Specifically, we need to at least incorporate details on how NPs interact with or influence the transcription of genetic material, perhaps going as far as identifying specific genes and gene products, and detailing the signaling pathways that influence its expression, for which experimental evidence exists [62, 41]. Compatibility with existing models of signaling and gene expression pathways, mostly written in SBML [63], is also a non-trivial considerations in modeling. There is a program that converts SBML models into SPiM which should allow for a possibility of integration with pathway models [64].
30 4. Modeling gold NP uptake and intracelluar distribution
structure-dependent electronic configuration, surface charge, and crystal structure [4, 7]. Executable biological models, on the other hand, are expected to yield testable mechanistic scenarios of how a particular NP causes cytotoxicity; in this sense, results from QSAR can be viewed as complementary, rather than competing. In this chapter, we discuss how we built our generic model using gold NP data, highlighting the advantages of creating it in pi calculus.
4.1
Choice of gold nanoparticles as a case study
One of our first considerations in setting up a generic model of NP uptake and intracellular movement is data availability, particularly with respect to kinetic parameters. This mini-mizes the need for parameter estimation, in turn increasing the probability that disparities between experimental and model-derived data result from the model structure itself, and not from wrong parameter estimates. Gold NPs are fairly well-characterized, given its wide array of existing and potential biological applications, including its use as contrast agents, drug and gene delivery vectors, and as a heat source in anti-cancer hyperthermia therapy [66]. This implies that data exist on its uptake [67, 68] and aggregation [69] characteristics, as well as its potential cytotoxicity [41, 70, 71]. These assays have involved both modified and unmodified gold NPs of different sizes, tested on different cell types [67].
4.2
Nanoparticle aggregation, uptake, and
combinato-rial explosion
4.3 Pi calculus model of gold NP uptake and intracellular distribution 31
4.3
Pi calculus model of gold NP uptake and
intracel-lular distribution
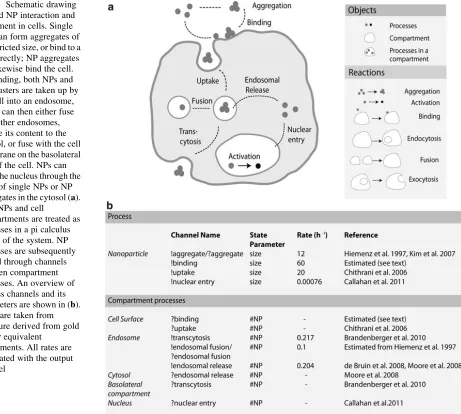
In Paper C, we describe a pi calculus model for nanoparticle aggregation, size-restricted uptake and movement within the cellular compartments. Briefly, we defined the follow-ing rules, detailfollow-ing inter-NP interaction and NP-cell interaction; the rules are written as reaction-type statements for readability:
1. Aggregation: NP(size1) + NP (size2)→ NP(size1+ size2)
2. NP-cell Binding and internalization: NP(size) + Cell → NP(size)-Cell → Cell + Endosome(NP(size))
3. Endosome-Endosome fusion: Endosome(NP(size1)) + Endosome(NP(size2))
→ Endosome(NP(size1), NP(size2))
4. Transcytosis: Endosome(NP(size)) + Basolateral membrane → Basolateral mem-brane1
5. Endosome lysis: Endosome(NP(size)) →Cytosol(NP(size))
6. Nuclear entry: Cytosol(NP(size)) → Nucleus(NP(size))
Cell compartments were treated as processes that can send and receive the number of NPs or NP aggregates that enter it. The initial runs were performed without incorporating the effect of aggregate size on the uptake rate. The main results from the model are in the form of spatio-temporal distributions of NPs (Figure 4.1). The model results, however, feature generally higher nuclear translocation of NPs. In order to improve the data fit, as well as to demonstrate the ease by which one could implement changes in a pi model, we introduced a simple restriction of optimal uptake rates for aggregates of size 43 - 125 NPs. Although uptake is several steps upstream of nuclear entry, this modification already has a large impact on predicted nuclear entry, as well as the number of clusters that can be found in the nucleus.
What this work primarily demonstrates is how rule-based models can be used in un-derstanding delivery information better. Using this base model, it becomes possible to ask questions as ‘What is the effect of having n cytosolic NPs on a signaling pathway P, considering that NPs release ions that react with proteins X and Y in P?’ Similarly, we could use the model to ask to what extent does inter-NP variability have an effect on NP efficiency – a question that we answer in the next chapter.
32 4. Modeling gold NP uptake and intracelluar distribution
Chapter 5
Experiments and modeling of
endosomal escape events
Endosomal escape has been identified as the main bottleneck in gene and drug delivery [27, 19]; it has been consequently of interest to develop both experimental techniques and complementary modeling techniques that would allow us to analyze endosomal escape characteristics of different vectors, including the elucidation of themechanisms that permit some vectors to perform better than others. There are, however, few real-time, single endosome lysis studies because of difficulties in detecting the events reliably. Previous studies of vector or viral tracking involved labeling of multiple cellular and vector/viral components, and used confocal laser scanning microscopy was used [77, 78, 79, 80, 81]. In Akita et al., at least 20 z-slice images for each of 30 cells were reported to yield statistically meaningful tracking results [77]. If this method were applied to a 30-hour transfection experiment [18], this would entail the capture, consolidation and analysis of 216,000 images. Due to these technical limitations, studies have mostly concentrated on spatial distribution of the material, without the temporal aspect [79, 80]. Endosome escape efficiency is only inferred from a minimal amount of sampling points [77]. Having a direct method for analyzing uptake and endosomal escape will not only yield time distributions of the escape events, but also information on other factors that might influence the time distribution such as the vector load per endosome and cell-specific endosome size distributions. Such a method will be powerful in exploring the performance of a delivery vector, especially if information is obtained for different cell types.