Available Online atwww.ijcsmc.com
International Journal of Computer Science and Mobile Computing
A Monthly Journal of Computer Science and Information Technology
ISSN 2320–088X
IJCSMC, Vol. 4, Issue. 5, May 2015, pg.107 – 112
RESEARCH ARTICLE
Case Simulation of Pedestrian Movements
using Cellular Automata Model
Kanchan Chavan
1, Amruta Dhanawade
2, Shefali Sonavane
31,2,3
Information Technology & Shivaji university, India
1 [email protected]; 2 [email protected]; 3 [email protected]
Abstract— This paper presents the simulation of evacuation scenario of a institute seminar hall to compare the crowd performance with different arrangements of furniture e.g. chairs. The objective is to determine the best suited chair arrangement for student populations based on the evacuation time required. It describes a 2-dimensional cellular automaton model for the simulation of pedestrian dynamics. The model is extremely efficient and allows simulations of large crowds faster than real time since it includes only nearest-neighbour interactions. A method for calculating the static floor field, which describes the shortest distance to an exit door is presented. Dynamic floor field describes the virtual trace left by the pedestrian.
Keywords— “Cellular Automata, Floor Field, Evacuation Time”
I. INTRODUCTION
The Pedestrian behavior plays an essential role in planning of large construction. After constructing a room, it becomes essential to determine the appropriate positions of the obstacles, so that they will not obstruct the pedestrian flow. The model should be able to simulate the evacuation process of a room with different arrangements of the obstacles and take into account different human behaviors, combining individual decisions with collective behavior. As individual human mind is generally unpredictable, but statistical models can be applied on human masses. The obstacles should be placed in such a way that in case of an emergency, the pedestrian must be able to evacuate the room safely and within less time possible. To find out the best suitable arrangement of obstacles for various number of population is the main reason for simulating this model.
II. CELLULAR AUTOMATA
A cellular automaton is a collection of "colored" cells on a grid of specified shape that evolves through a number of discrete time steps according to a set of rules based on the states of neighboring cells. The rules are then applied iteratively for as many time steps as desired.
A. Types of grid structure
For practical purpose, the grid has to be regular; what that it is made only of one sort of regular polygons [2].
Fig. 1 Triangular Grid, Rectangular Grid, Hexagonal Grid [2]
B. Types of neighborhood cells
In CA, for the change of the cell states; only information from neigh-boring cells are taken into account. In principle, any definition of neighborhood is possible. The only restriction is that the same definition has to be used for all cells. A rectangular grid is perfectly suited for walls, because most rooms are rectangular. Hexagonal and triangular grid are not appropriate to represent straight walls, but are more flexible for obstacles with complex shapes [2].
Fig. 2 Von Neumann neighborhood in the different grid types [2]
Fig. 3 Moore neighborhood in the different grid types [2]
III. DESCRIPTION OF THE MODEL
A. Model Overview
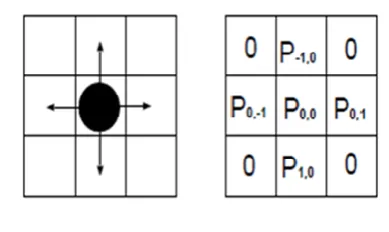
Fig. 4 Target cells for a person at the next time step[1]
Two types of floor fields are presented. Static floor field S describes the individual pedestrian behavior whereas Dynamic floor field D describes the collective behavior. The static floor field S describes the shortest distance to an exit door. The field strength Sij is set inversely proportional to the distance from the door. The dynamic floor field D is a virtual trace left by the pedestrians. Dynamic floor field D is modified according to its diffusion and decay rules, controlled by the parameters α and δ. In each time step of the simulation dynamic field D at the origin cell of each moving particle is increased by one as well as decays with probability δ and diffuses with probability α to one of its neighboring cells. D can take any non-negative integer value.
The transition probability is determined by,
pij = Nexp(kDDij)exp(kSSij)pI(i, j)pW (1)
The values of Static (S) and Dynamic (D) are weighted using sensitivity parameters kS and kD respectively. The normalization N = ∑ pij and pI represents the inertia effect given by pI(i,j) = exp(kI) for the
direction of one’s motion in the previous time step, and pI(i, j) = 1 for other cells, where kI is the sensitivity parameter. pW is the wall potential.
Whenever two or more pedestrians attempt to move to the same target cell, the movement of all involved particles is denied with probability µ € 2 [0, 1], i.e. all pedestrians remain at their site. This means that with probability 1 - µ one of the individuals moves to the desired cell.
B. Seminar Hall Geometry
The hall consist of a table , stand , two book shelves and 40 chairs , which act as obstacles. They are implemented in following two cases. Depending on the number of population and chair arrangement, in each case three different sub-cases are implemented. Fig. 6, 7, 8 represents various case arrangement for two exit doors where
A:- Table
B:- Stand
C:- Book Shelves
D:- 40 chairs
E:- Exit doors
TABLEI CASE CLASSIFICATION
Cases 1 2
No of exit doors 1 2
Sub-Cases 1.1 1.2 1.3 2.1 [fig6] 2.2[fig7] 2.3[fig8]
No of grouping of chair 2 3 4 2 3 4
No of columns 3 2 2 3 2 2
No of rows 7 7 5 7 7 5
C. Calculation of static floor field
arbitrary obstacles between them. Contraction of wide exit is considered for finding the minimal distance to doors so that pedestrians try to avoid the door walls. The formula used for calculating is
StatField(i,j) = Ks*exp(-minDistToDoor(i,j)/maxDist*750); (2)
Fig. 5 Calculation of the static floor field using the Dijkstra method. (a) A room with one obstacle. The door is at O and the obstacle is represented by lines A-H. (b) The visibility graph for this room. Each node connected by a bond is “visible”, i.e. , there
are no obstacles between them. The real number on each bond represents the distance between them as an illustration [1].
IV. SIMULATION RESULTS AND DISCUSSION
Based on simulation, graphs are drawn for each case. X-axis represents the number of pedestrian evacuated, e.g, p3 represents 3 pedestrians evacuated. Y-axis represents the evacuation time in seconds.
A. Graph for Sub-case 2.1
Fig. 6 Two chair arrangement structure and evacuation time vs population graph
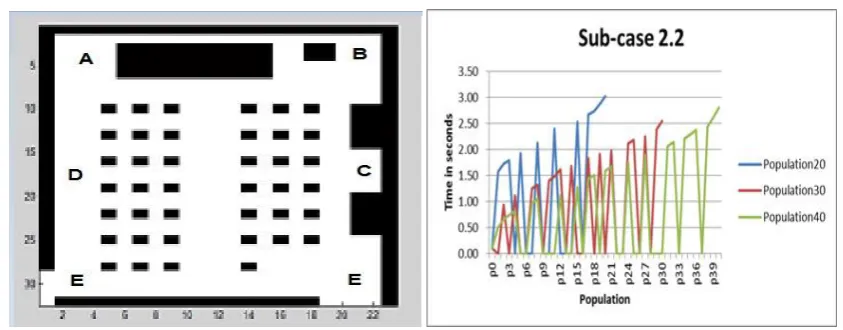
B. Graph for Sub-case 2.2
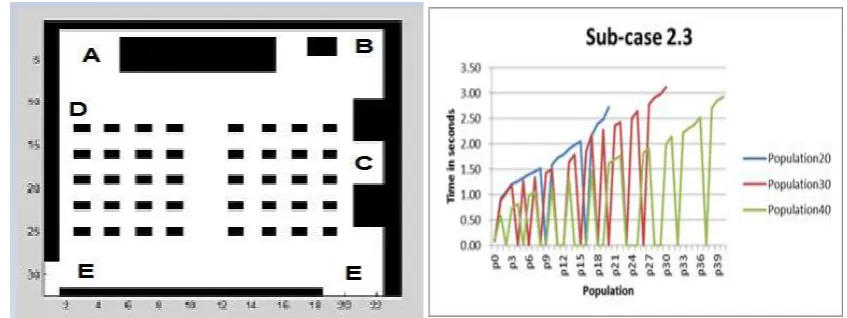
C. Graph for Sub-case 2.3
Fig. 8 Four chair arrangement structure and evacuation time vs population graph
T1=Total time required to evacuate entire population in seconds. T2=Total time required to evacuate first pedestrian in seconds.
TABLEII
COMPARISON TABLE FOR ONE DOOR ARRANGEMENT
Population Size Time for Sub-Case 1.1 Time for Sub-Case 1.2 Time for Sub-Case 1.3 Best Sub-Case Estimation
T1 T2 T1 T2 T1 T2
Population20 0.07 0.06 4.48 1.47 3.68 1.52 Sub-Case 1.1
Population30 0.09 0.07 4.46 1.13 3.53 1.40 Sub-Case 1.1
Population40 4.68 0.74 4.56 0.72 4.39 0.81 Sub-Case 1.3
Best population Estimation
Population 20 Population 30 Population 30
TABLEIII
COMPARISON TABLE FOR TWO DOOR ARRANGEMENT
Population Size Time for Sub-Case 2.1 Time for Sub-Case 2.2 Time for Sub-Case 2.3 Best Sub-Case Estimation
T1 T2 T1 T2 T1 T2
Population20 5.14 2.02 2.67 1.19 2.67 0.94 Sub-Case 2.2 or 2.3
Population30 3.06 0.87 2.61 0.08 3.05 0.83 Sub-Case 2.2
Population40 3.54 0.50 2.71 0.49 3.07 0.58 Sub-Case 2.2
Best population Estimation
Population 30 Population 30 Population 20
D. Observations
Best sub-case estimation and Best population estimation are done based on less time required to evacuate the entire population e.g. In Table IIfor population size 20 and 30, sub-case 1.1 requires less evacuation time as compared to sub-case 1.2 and 1.3. Hence, sub-case 1.1 is more suitable. Similarly other estimations are done.
From both the tables i.e. TableII and Table III it is observed that for maximum cases evacuation time required for 2 door arrangement is less than the evacuation time required for 1 door arrangement. However, total time required to evacuate for first person increases for two door arrangement if population size is 20-30 and decreases for full capacity i.e. when population size is 40.
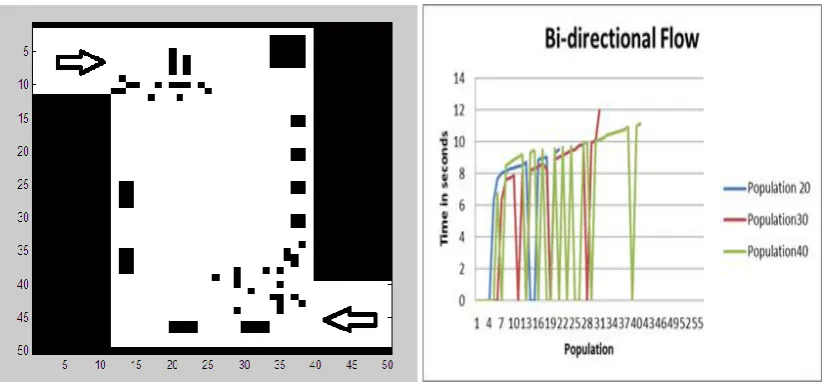
Fig. 9 Bi-directional Flow and evacuation time vs population graph
Arrows in the fig 9 represents the direction of movement of the pedestrian. Rectangular and square blocks represents the obstacles
TABLEIV
COMPARISON TABLE FOR BI-DIRECTIONAL FLOW
Population Size Evacuation Time in seconds
Population20 9.52
Population30 11.17
Population40 14.05
As population size increases, time required to evacuate total pedestrians also increases. With more population size the collisions between pedestrians are also more which requires more time to resolve. Hence, evacuation time increases with population size.
V. REMARK
This pedestrian dynamics model helps to get optimum possible arrangement of a room arrangement. Similar approaches can be extended further for design approach of road traffic & vehicular movement or network traffic analysis. The multidirectional pedestrian movement is a great challenge to study, but the simulation studies using CA are helpful for best suited solution.
REFERENCES
[1] K. Nishinari, A. Kirchner, A. Namazi and A. Schadschneider. “Extended floor field CA model for evacuation dynamics.” IEICE Trans Inf Syst (Inst Electron Inf Commun Eng) VOL.E87-D;NO.3 (2006) pp(726-732).
[2] Ralf Schneider , Berndt Bruhn, “Cellular automata modeling for pedestrian dynamics”, Bachelor Thesis,
Christian Nitzsche Greifswald, (2013)
[3] A. Kirchner, K. Nishinari and A. Scha Dschneider. “Friction effects and clogging in a cellular automaton
model for pedestrian dynamics.” Physical review E67 056122(2003)
[4] D. Helbing, A. Johansson, J. Mathiesen, M. H. Jensen, and A. Hansen. “Analytical Approach to Continuous and Intermittent Bottleneck Flows.” Physical review letters PRL 97 168001 (2006)
[5] W. J. Yu, R. Chen, L. Y. Dong, and S. Q. Dai. “Centrifugal force model for pedestrian dynamics”. Physical review E72 026112 (2005)
![Fig. 2 Von Neumann neighborhood in the different grid types [2]](https://thumb-us.123doks.com/thumbv2/123dok_us/1949620.1256589/2.595.251.351.401.477/fig-von-neumann-neighborhood-different-grid-types.webp)