Improved EMG Upper Limb Classification
Features
P.Swetha
M. Tech (Telematics), Dept. of ECE, VR Siddhartha Engineering College, Vijayawada, India
ABSTRACT: The sequential method for classifying the data extracted from EMG which gives better accuracy is proposed. Previous research was mainly related to the data extracted from the forearm. In contrast, this current paper presents the physically taken data for classifying upper-limb extremity data for the control strategy. Here, we are going to take the data from 4 different subjects belongs to different categories such as, Age, gender, healthiness, applied force content etc., The recorded data measurements were obtained from 4 different subjects under various categories for 12 different activities. The results represents the accuracy responses of classification for the activities taken under different combinations with frequency domain feature extraction,for feature reduction and SVM classifier for the final classification purpose.
This paper represents the responses which, we have attained total physical data accuracy of 97.92%, and kappa accuracy of 95.68%. The confusion matrix is also built for each stage. In among all these the aggressive data has attained high accuracy of 90.55% (kappa accuracy), and internally the higher aggressive actions gives better response.
KEYWORDS:Upper limb-extremity, Feature extraction, SVM-SMO classifiers.
I.INTRODUCTION
EMG deals with the signals related to the muscle contractions due to the varying muscle contraction levels. The myo-electric pattern recognition activity has been decreased while working at various Unpredictable situations.(Feature extraction, Dimentional reduction, classification).Here, the SEMG is a bio-medical phenomenon which records the generated signal which corresponds to the muscle movements along with the electrodes placed on the surface of the skin. On placing the electrodes the action potential be generated which is observed on the screen.EMG signals are applied in various fields. In among all the applications the control strategy plays a crucial role in classification. To improve the performance in control strategy, classification gives the best solution for the EMG signals to recognize the intended movements. This is also helpful to tackle with the neuromuscular abnormalities. Now, the EMG signals thus extracted have to be proceeded further. The extracted signal will be in the raw form which should be rectified further for more efficient signal outcome. After this, this has to undergo through some stages. They are data acquisition, feature extraction along with dimentional reduction, and finally classification is carried out.
II. RELATED WORK
The classifiers DT,ANN,LDAetc. are used for the classification purpose. In among all these, Artificial neural networks (ANN) are preferable due to its ability to deal with the non-linear data and also be able to distinguish the classifying features but, this is related to the Time-domain features but here, we are using the frequency domain features, and this is also Least square error limited, and through this obviously the performance will be effected.Because of all these factors the SVM (Support vector machine) classifier has been chosen.
III.METHEDOLOGY
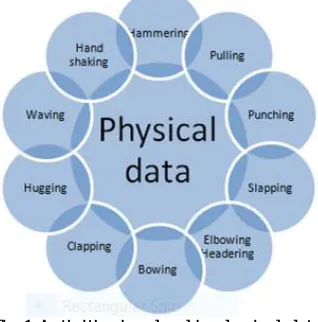
taking the measurements for classification. For this purpose, SVM classifier is used for finding out the optimal boundaries as this is the non-linear classification by kernel trick by mapping them into high dimentional feature spacing. This is used for both classification and regression purposes, and this is belonged to supervised learning because the labelling is involved in this. The Figure shows the all the gestured activities used for various signal strengths.
Fig 1.Activities involved in physical data
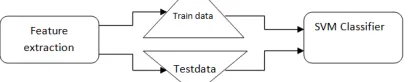
The features involved in this are Wavelet entropy, wavelet energy entropy, FFT, Template entropy which is driven to the classifier, in which the classification is done for both Aggressive and normal activities. After extracting the features from the data, the extracted data should train-up first and test in a sequential manner. These have to be sent to the SVM classifier as shown in the Fig 2.
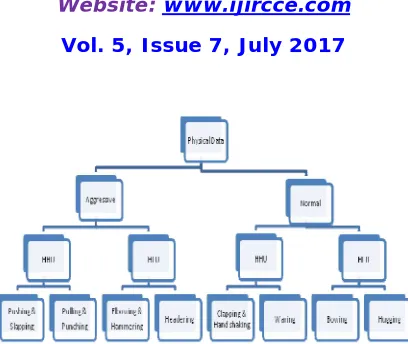
As the Fig 3 shows different sections of activities which are segregated as Aggressive and normal. These are again divided into HHUL and HHLU’s as they represents high stressed hand unit limb and
Lower stressed actions. The corresponding actions are as shown in the following figures This SVM classifier separates the feature with a strong boundary line which is the hyper-plane with the maximum possible margin in between them. The data from this is transformed into the high dimentional space. To overcome the confusion in trained and tested data, SMO classifier s also used to tackle the problems with SVM classifier.
The processing has three steps mainly. They are i. Feature projection,
ii. Feature extraction, iii. Classification.
Firstly choosing the features which apts to extract have to be selected first, then the original features should be dimensionally reduced for the proper feature specification, based on our extracted data.
A. Adaptive features: This represents the first most step which compares the models with others and filtered out the best which best suits for our approach in classifying the data which we have acquired currently.
1. Time series: This is the sequential order of discrete time data. Time series uses one-way ordering of time, in which the expressions uses the past values rather than the future values which represents the time series forecasting, and the regression analysis which compares the values of single time-series analysis or multiple- time series.
4. Short time Fourier Transform: This is mainly intended for the spectral changes with time for the rapid head and wrist movements. Here the used windowed function tackles the fluctuations. The problems involved here are proper signal extraction, and also to specify various components that affects the performance of each method. This gives constant resolution in all frequencies
5. FFT: The FT converts initial original signal form to the frequency domain. This rapidly reduces the complexity in computing.
6. Template entropy: On filtering up the models which well suits for our purpose, we should check for the better sequence which gives better results by the above models. The wavelet analysis used here filters the signal which eliminates noise and other fluctuations.
7.PSD (Power spectral density):The sequence of Time-series spectrum is well characterized by PSD, in which the leakages during the signal transmission/generation can overcome by windowing technique, for less error content.
B. Data acquisition: (Based on gestures)
(i) Data acquiring process: The measurements plays an important role in the processing the data for the further steps to be carried out. The data acquiring can be of many types. Some among them are., through DAQ modules, Arduino kit with separate data storage for the storage of data. The components involved for this are EMG sensors, electrodes, cables, jumpers data acquiring software, matlab interface.
The hardware setup in the fig.1.The measured EMG signal is in terms of voltage. The variation from activity to activity varies through the amplitude fluctuations. The signal outcome for each activity is extracted through the muscle contraction levels in each case. Here, the sensor acquires the power from the supply and takes the data from each activity is given to the software which we have used. The extracted data is saved in any of the particular name. This takes the data, analyses the extracted signal and compares the response of each activity. Now this data is proceeded for classification.
(ii)Features involved: The data taken for the EMG testing can be segregated into Aggressive and normal features. The classification step is attained after under- going through training and testing as shown in the (Fig 2) Aggressive represents the stressed actions, which are with the little variation from the normal activities. The activities taken under normal are Bowing, clapping, hugging, waving, and hand shaking and Hammering, Pulling, Punching, slapping, elbowing and heading. These all are related to the gestured activities. Hence, the classification under this category gives the information of how the extracted data is analysed and the classified for the further use.
Fig 2. Classification Block diagram
C. Feature Extraction:
This converts the raw EMG data to the feature vector format. This gives a particular structure of the EMG data taken in the vector mode, is in the dimentional reduced form. That means simply to say, the data which we have extracted is displayed totally in the vector form for the reductional purpose. The features are generally represented in Time-Domain, frequency domain or TF- domain. Here we used the frequency domain which supports the extracted features which we have chosen for the better performance.
Feature extraction is a critical part here in representing the muscle contractions which are extracted from EMG data. In this, five different features are used for the purpose with appropriate combinations of time-frequency domains. The TD feature set for the movements, wavelet energy features, entropy features, Fourier transforms in frequency domain. This paper defines the data tested with these features.
Fig 3.Physical data classification
E. Classifier training: The data which we have chosen for the particular activities should undergo through segregation of training schemes to ease the intake data to train sequentially through sets, for this the samples of data should bundled to some set of groups, this labelling makes training data to process easier. For this the folded cross validation technique is to train and test the data sets .For training and testing the data, partial and whole training schemes(WTS) are used. Here we have chosen WTS because all the features are tested on all the data. SVM classifier with the time-domain suits better for any sort of scheme. After training up each data set, that should be piped to allow the other sets to train. This trained data should be tested and then have to give to the classifier.
E. Procedure involved: As the main purpose is to classifying the data, this uses the SMO classifier for the classification, because SMO which stands for Sequential minimal optimization is the way to solve quadratic problem during SVM training. This uses the heuristics technique in resolving the training problems which are generated in the SVM. This also speedup the process in doing so. This solves the optimization problems because of its iterative natured algorithm. This is done by sub-dividing the problem into some sub-problems. The general working of the algorithm flow is that it starts the set randomly solves the problem and adds the usable methods iteratively to solve-up the whole problem. This also solves the convex problems.
The steps involved here are
1. Feature standardization that supports the comparative measure of the particular data activity taken and for the further processing.
2. Training and testing the data of each while shuffling: This involves the training the data testing. After the completion of each set, this has to be shuffled for the proper functioning of the algorithm.
3. Applying classifier: After training and testing up the algorithm, the SVM classifier has to be applied and then the data has to be classified accordingly as per the activities which we have chosen.
IV. DISCUSSION AND RESULTS
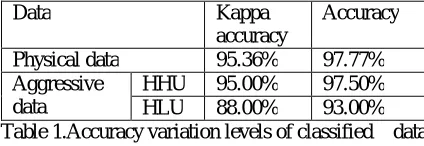
1. Classification of data acquired: The classified data which we have acquired is mainly categorized under the stress levels which we have applied. The responses of the activities which we taken are as in the below table.
2.Better comparative measures: On observing all the models used and the activities which we have chosen, the response of the activities have to be compared with each other and finally the better sequential flow has to be chosen as shown in (Table 1).
3. Adapted methods influence: The classifications are done using all the domains, as per previous researches, in the upper limb scenarios, the classifiers using ANFIS and SVM classifiers with TFD are better when compared with all other classifiers.
subjects are involved. The classification is done based on the stress levels involved in the activity. The aggressive data gives better response in among all those.
5. Final results: The models which we have chosen are with different variations. The responses are as in the Fig 4 when we take the features with sequences other than above mentioned features, those shows less performance. When we take the sequence Time-series, wavelet energy entropy, Wavelet entropy features, FFT energy, and Template entropy gives (97%, 87% accuracy levels.)the accuracy levels are as shown in the (Table1).This shows different variations in accuracy levels which replicates the performance levels of each sequence. In the next step we acquire the data for the activities which gives better response of the activities which shows the stressful actions. We have represented all these in the above sections. Thus, the data taken is given as the input to the further classification. The main variation between the stressed and the stress less actions are as shown in the (Table 1)below.,
Data Kappa
accuracy
Accuracy
Physical data 95.36% 97.77% Aggressive
data
HHU 95.00% 97.50% HLU 88.00% 93.00% Table 1.Accuracy variation levels of classified data
V.FUTURE SCOPE
Now-a-days large number of limb disabled people are increasing due to various reasons due to accidents, in armies etc., So, the researches which are related to them will really be a great boon for such kind of people. In this paper, we have focused on the control strategy mainly used for the classification that will helps mostly to automate the EMG signals received. The EMG signal received will be in the raw state. So, the work should be done to simplify the functionality.
This work has great scope because of the used equipment (both hardware & software interfacing).This really works great because if the work done by us helps the impaired people which helps them in their daily needs.
VI.CONCLUSION
This paper represents a new approach in feature extraction as well as data acquiring using the appropriate models with the proper sequence too. For this the Aggressive and normal responses are as., 95.36% and 92% respectively. Also by the wavelet analysis, the noise and all the unwanted portions of the extracted signal are eliminated. This is the advanced beneficial feature here. The major step of classification involves the inner segregation of data which gives better performance with total of 97% of total aggressive accuracy and 93% of total lower level accuracy. So, finally the chosen features and the classifier makes the difference in the control strategy for giving input to the prosthetics. This was done by comparing the output responses of each activity with different combinations. This concludes with the following outcomes.,
Hence, we have concluded that in among all the classifiers, SVM suits better for the classification and there will be the effect of the extracted features on the performance with proper sequence ,classifying the data correctly as per the stress applied on the muscles the accuracy levels be varied.
REFERENCES
[1] M. Jiang, R. Wang, J. Wang, and D. Jin, “A method of recognizing finger motion using wavelet transform of surface EMG signal,” in 27th Annual International Conference of the IEEE-EMBS Engineering in Medicine and Biology Society, 2005, pp. 2672-2674.
[2] G. Naik, D. Kumar, and S. Arjunan, “Use of SEMG in identification of low level muscle activities: Features based on ICA and fractal dimension,” in Annual International Conference of the IEEE Engineering in Medicine and Biology Society (EMBS) 2009, pp. 364-367.