Feature Selection Using Information Gain for
Improved Structural-Based Alert Correlation
Taqwa Ahmed Alhaj1
*, Maheyzah Md Siraj1, Anazida Zainal1, Huwaida Tagelsir Elshoush2, Fatin Elhaj1
1 Information Assurance and Security Research Group, Faculty of Computing, Universiti Teknologi Malaysia, UTM, Johor Bahru, Johor, Malaysia, 2 Faculty of Mathematical Sciences, University of Khartoum, Khartoum, Sudan
Abstract
Grouping and clustering alerts for intrusion detection based on the similarity of features is referred to as structurally base alert correlation and can discover a list of attack steps. Previ-ous researchers selected different features and data sources manually based on their knowledge and experience, which lead to the less accurate identification of attack steps and inconsistent performance of clustering accuracy. Furthermore, the existing alert correlation systems deal with a huge amount of data that contains null values, incomplete information, and irrelevant features causing the analysis of the alerts to be tedious, time-consuming and error-prone. Therefore, this paper focuses on selecting accurate and significant features of alerts that are appropriate to represent the attack steps, thus, enhancing the structural-based alert correlation model. A two-tier feature selection method is proposed to obtain the significant features. The first tier aims at ranking the subset of features based on high infor-mation gain entropy in decreasing order. The second tier extends additional features with a better discriminative ability than the initially ranked features. Performance analysis results show the significance of the selected features in terms of the clustering accuracy using 2000 DARPA intrusion detection scenario-specific dataset.
1. Introduction
Intrusion detection systems (IDS) work as the "second line of defense" for computer and net-work systems [1]. Intrusion detection systems employ one intuitive rule that intrusive patterns are noticeable and they are unusual to regular communication. Generally, an IDS is catego-rized to be a host-based or network-based system depending on its monitoring capability. Host-based IDSs focus on monitoring the individual host/computer with regard to the internal activities and statuses. It cannot detect intrusion across the network [2]. Network-based IDSs (NIDSs) detect intrusions over the network by examining the packets arriving into the net-work. Since attempted intrusions can occur via the network, an NIDS needs to monitor differ-ent actions triggered on multiple hosts in order to build adequate evidence. In this case, NIDSs are made to handle huge data packets and communications in large networks as compared to
a11111
OPEN ACCESS
Citation: Alhaj TA, Siraj MM, Zainal A, Elshoush
HT, Elhaj F (2016) Feature Selection Using Information Gain for Improved Structural-Based Alert Correlation. PLoS ONE 11(11): e0166017. doi:10.1371/journal.pone.0166017
Editor: Houbing Song, West Virginia University,
UNITED STATES
Received: June 20, 2016
Accepted: October 21, 2016
Published: November 28, 2016
Copyright:©2016 Alhaj et al. This is an open access article distributed under the terms of the
Creative Commons Attribution License, which permits unrestricted use, distribution, and reproduction in any medium, provided the original author and source are credited.
Data Availability Statement: The DARPA 2000
dataset is available from Figshare:https://figshare. com/articles/DARPA_2000_dataset/4127157
Funding: We would like to thank Ministry of Higher
host-based IDSs. A NIDS collects and analyses network information to check if there are actions violating security strategies [3]. The NIDS triggers alert to the network operator to take action against the suspicious activities. However, even a single NIDS generates a huge amount of alerts that overwhelms the operators [4] [5]. Most of the generated alerts have irrelevant fea-tures which result in slow training and testing correlation processes, higher resource consump-tion, lower accuracy and higher performance costs [6]. Furthermore, inappropriate features lead to the less accurate discovery of the attack steps. The pattern of attack steps taken by the attacker is discovered when a similar pattern of alerts are recognized and grouped. Therefore, this paper aims to identify appropriate features to achieve high accuracy in the identification of the attack steps. After that, the list of the attack steps from the alerts patterns can be deter-mined accurately by clustering the most significant features of the alerts. The selected features are evaluated in terms of clustering accuracy. This paper proposes a 2-tier feature selection method, namely, feature ranking (first tier) and additional feature (second tier). The feature ranking tier ranks the features based on high information gain entropy while the additional feature tier provides extended additional features with better discriminative ability.
This paper is organized as follows: Section 2 provides an overview of some related research and presents the necessary background information regarding feature selection in alert corre-lation. Section 3 presents an overview of the proposed feature selection and discusses the experimental results. Finally, in Section 4 the paper is concluded.
2. Related Work
Feature selection has been widely applied in many domains, such as text categorization [7], genomic analysis [8], intrusion detection [9][10] and bioinformatics [11][12].
In a complex classification domain, such as intrusion detection, features may contain a false correlation that hinders the learning task to be processed [13]. Some features may be irrelevant and others may be redundant [14]. These extra features can increase computational time and can have an impact on the system accuracy [13]. Therefore, selecting important features from input data leads to the simplification of a problem, and faster and more accurate detection rates [9]. For this reason, alert correlation researchers have tried to select the relevant features of alerts. However, the relevant features were manually selected with different researchers selecting different features based on their knowledge and experience. For example, in alert clustering, seven different features are selected by Tjhai et al. [15] and Man et al. [16]. Tjhai et al. [15] proposed a framework that contains four phases: feature extraction, alarm aggrega-tion, cluster analysis and classification. In the phase of feature extracaggrega-tion, seven alerts features (attributes) such as the number of alerts, number of signatures, port number, protocol, prior-ity, time interval and the number of events are evaluated and chosen to represent the value of each input vector in the last phase. Man et al. [16] proposed ISODATA algorithm or the pur-pose of solving flood and duplicated alarms of IDS effectively. The essence of their algorithm is to generate an initial class as "seed", and then iterate clustering automatically according to some discriminate rule. DARPA 1999 is used to test their algorithm. Considering that there were a lot of useless information in the original alert, they selected a part of the attributes as their main characteristic attributes in their aggregation algorithm and represented them as a tuple containing the attributes: alert id, alert type, SrcIP, DestIP, SrcPort, DestPort, and Time. Mohamed et al. [17] extracted three attributes from the alerts (destination IP, signature type or id and timestamp) and applied these attributes to the MD5 hash function. The MD5 generates a unique hash value that is used for the initial clustering process. Meanwhile, Siraj [18] pro-posed a novel hybrid clustering model based on Improved Unit Range (IUR), Principal Com-ponent Analysis (PCA) and unsupervised learning algorithm (Expectation Maximization) to Competing Interests: The authors have declared
aggregate similar alerts and to reduce the number of alerts. Three different attributes (source port, destination port, and alert type) from the DARPA 2000 dataset were selected and repre-sented as a vector. Shittu et.al. [19] propsed A comperhensive System for Analysing Intrusion Alerts (ACSAnIA). it contains seven components which are: (1) Offline Correlation (2) Online Correlation (3)Meta alert Comparison (4) Meta–alert Prioritisation (5)Meta–alert Clustering (6) Attack Pattern Discovery and (7) Reporting System. The ACSAnIA system uses six of the alerts attributes where as: alert’s timestamp, source IP, source port, destination IP, destination port and intrusion type. Furthermore, based on Ramaki et al.[20] an efficient framework for alert correlation in Early Warning Systems (EWSs) is proposed. An important process in EWSs is the analysis and correlation of alerts aggregated from the installed sensors. The authors mentioned that an alert consists of some features based on specific attributes of net-work traffic. The most important features that are used for the their alert correlation process are: source IP address, destination IP address, source and destination port numbers, intrusion type or alert type, attack severity and timestamp.
The literature review indicates that there are no standards or specific features used in alert clustering; thus, every researcher selects a different number of feature subsets based on their own experience. Therefore, this paper focuses on applied automated feature selection that improves clustering accuracy and presents accurate attack steps.
3. Feature Selection
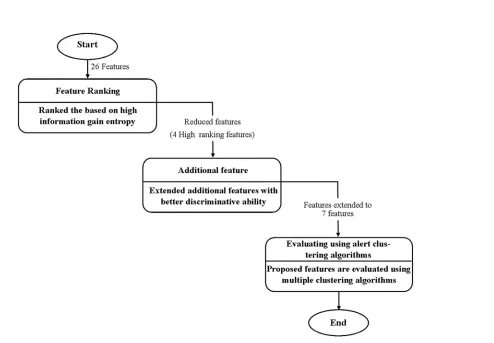
The reason for selecting the important and significant features is to represent the attack steps from the alerts pattern correctly and improve the accuracy of the Structural based Alert Corre-lation (SAC). This section describes the two-tier feature selection, i.e., feature ranking and additional feature. The feature ranking stage employs Information Gain algorithm (IG) that uses a filtering approach. The stage aims at ranking subsets of features based on high informa-tion gain entropy in decreasing order. Meanwhile, the addiinforma-tional feature stage is based on the work of Ren et. al. [21] where they mention that identifying relationships between alerts essen-tially needs to analyses the alerts’ attributes, and extracting the basic attributes may not be suf-ficient to fully discover the relationship between the alerts. Therefore, the aim of this stage is to extend additional features that contribute to the relationship between alerts with a better dis-criminative ability than the initially ranked features.Fig 1shows the feature selection proce-dure that is adopted in this research. The effectiveness of the reduced feature subsets was evaluated on SAC.
3.1 Feature Ranking
Ranking methods are used due to their simplicity and the fact that good success has been reported for practical applications [22]. A suitable ranking criterion is used to score the vari-ables and a threshold is used to remove varivari-ables below the threshold. The basic property of feature ranking is to identify the relevance of the features. It essentially states that if a feature is to be relevant it can be independent of the input data but cannot be independent of the class labels, i.e., the feature that has no influence on the class labels can be discarded [22]. The main reason behind the application of feature ranking in this study is based on this property, which ranks the feature that has an influence on the class labels.
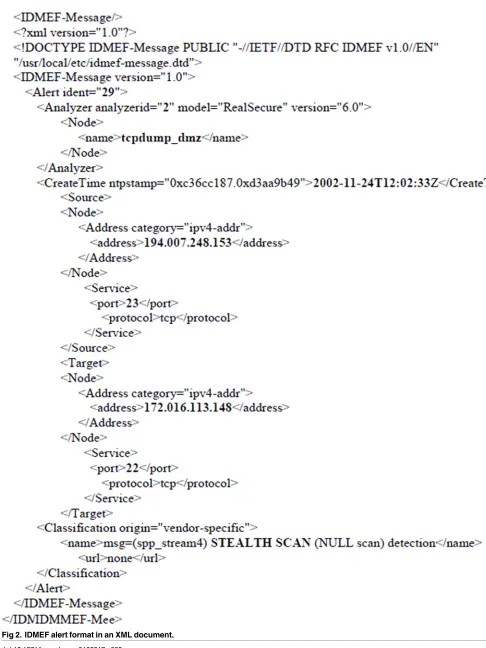
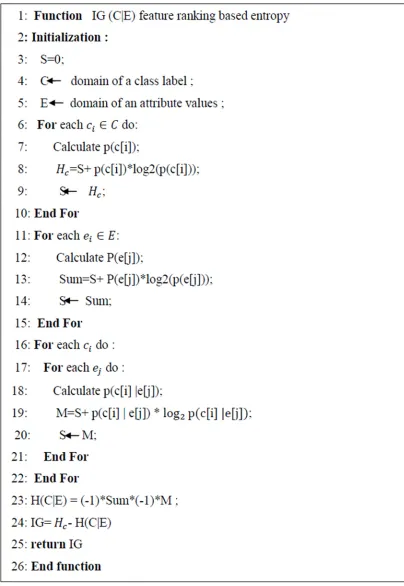
As mentioned earlier, the feature ranking was implemented using Information Gain (IG). IG is frequently employed as a term-goodness criterion in the field of machine learning [23]. It is measured based on the entropy of a system, i.e., of the degree of disorder of the system. Therefore, the entropy of a subset is a fundamental calculation to compute IG. For feature ranking purpose, IG is implemented in all four files of datasets. Twenty-six features are applied to IG for feature ranking. This study manually identified some of those features that have net-work meaning and is based on the XML file presented inFig 2.
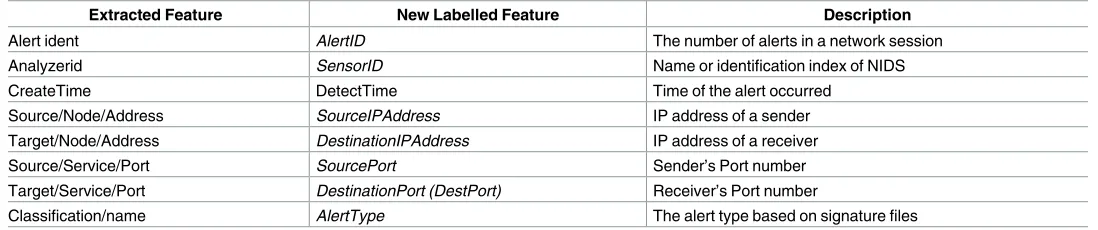
Referred toFig 2the alert is uniquely identified by the alert ident feature. The source and target feature describe the node and service of the sender and the receiver respectively. The node contains the IP address and its category, while service holds the port number and its cor-responding protocol. The alert type is given by the Classification name feature. Specifically, this alert simply represents a stealth scan attack via port 23 from 194.007.248.153 to 172.016.113.148 via port 22. Based on this information, eight features have been identified from the XML documents as listed inTable 1and the rest have been labelled without network meaning.Table 2is an example of all features in DMZ network for scenario one.
IG looks at each feature in isolation, computes its information gain and measures how important and relevant it is to the class label (alert type). Computing the information gain for a feature involves computing the entropy of the class label (alert type) for the entire dataset
Fig 1. Two-Tier Feature Selection Procedure.
Fig 2. IDMEF alert format in an XML document.
and subtracting the conditional entropies for each possible value of that feature. The entropy calculation requires a frequency count of the class label by feature value. In more details, all instances (alerts) are selected with some feature value v, then the number of occurrences of each class within those instances are counted, and the entropy for v is computed. This step is repeated for each possible value v of the feature. The entropy of a subset can be computed more easily by constructing a count matrix, which tallies the class membership of the training examples by feature value. The algorithm of IG implementation is given inFig 3.
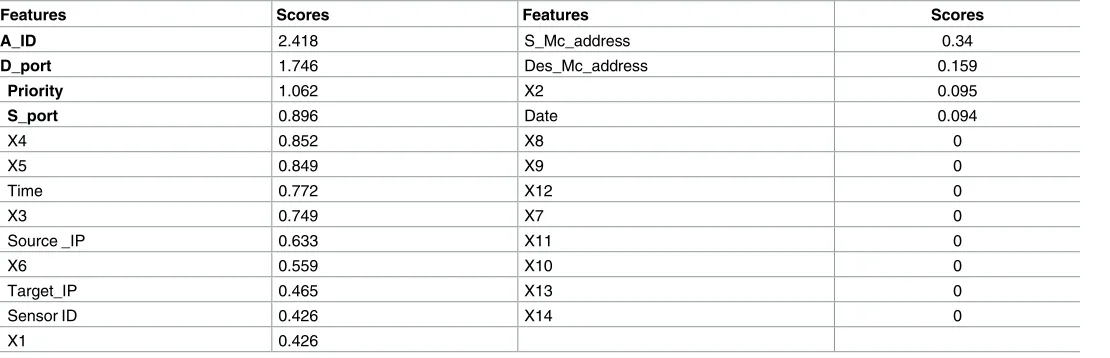
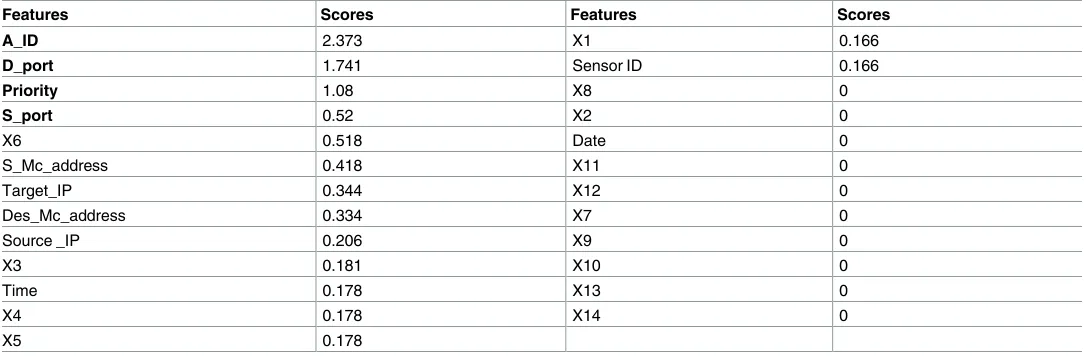
3.1.1 Results on Feature Ranking. Tables3,4,5and6show that for each dataset file, the different set of features are ranked differently in decreasing order based on their relevance to class label. The reason behind this variation is that the DDoS attack has five attack phases, in each phase different attack steps occurred. The rank score measures how much each feature relates and contributes to class label. These tables indicate that A_ID, D_port, Priority and S_port which are: alert id, destination port, priority and source port (as highlighted in bold) have obtained the same sequence of order with higher scores than other features in all files of datasets. Therefore, we can conclude that those four features are more related and influential to alert type (class label).
3.1.2 Evaluation Performance on Feature Ranking. To evaluate the significance of these ranked features on clustering accuracy that present the attack steps and to find the best algo-rithm that produces the highest clustering accuracy, three clustering algoalgo-rithms have been applied both before and after the feature selection method. The algorithms are K-Means, EM,
Table 1. Attributes of an alert extracted from the XML document.
Extracted Feature New Labelled Feature Description
Alert ident AlertID The number of alerts in a network session
Analyzerid SensorID Name or identification index of NIDS
CreateTime DetectTime Time of the alert occurred
Source/Node/Address SourceIPAddress IP address of a sender
Target/Node/Address DestinationIPAddress IP address of a receiver
Source/Service/Port SourcePort Sender’s Port number
Target/Service/Port DestinationPort (DestPort) Receiver’s Port number
Classification/name AlertType The alert type based on signature files
doi:10.1371/journal.pone.0166017.t001
Table 2. All features of DRAPA 2000 datasets.
Label Network Data Features Label Network Data Features
A_ID AlertID Des_Mc_address Destination MAC Address
X1 not identified in xml file S_Mc_address SourceMAC Address
X2 not identified in xml file X7 not identified in xml file
X3 not identified in xml file X8 not identified in xml file
X4 not identified in xml file X9 not identified in xml file
Date Detect Date X10 not identified in xml file
Time DetectTime Priority Priority
S_port SourcePort Sensor ID Sensor ID
Source _IP SourceIPAddress A_ Type Alert type
D_port DestinationPort X11 not identified in xml file
Target_IP Target IPAddress X12 not identified in xml file
X5 not identified in xml file X13 not identified in xml file
X6 not identified in xml file X14 not identified in xml file
Fig 3. Information Gain algorithm.
and Hierarchical. Clustering refers to unsupervised learning and for that reason, it has no pri-ori data set information. Therefore, many different cluster validity methods have been pro-posed without prior class information, these are named internal validity. In contrast, there is a number of external cluster validity for which a priori knowledge of dataset information is required. As noted before, the absence of truth labels in DARPA 2000 datasets for evaluating structured (cluster) based alert correlation leads this research to propose a single class label that is an alert type for external validation of the clustered alerts.
Firstly, the clustering algorithms were performed on the original features, a total of 26, for all datasets before applying IG for feature ranking. The average accuracy rates (AR), which include the percentage of alerts that are accurately clustered, are reported in Figs4,5and6.
1) Performance using K-means algorithm
Fig 4presents that K-means algorithm achieves the best result (37% to 43%) with two and three clusters. In average, for all dataset, the best performance of K-means algorithm is 39.7% AR at 2 clusters. After that, the accuracy is slowly downgraded when the number of clusters is increased. The graph in all figures shows that the performance of K-means is poor, it gives in
Table 3. Feature ranking using IG on DMZ 1 DARPA 2000 dataset.
Features Scores Features Scores
A_ID 2.418 S_Mc_address 0.34
D_port 1.746 Des_Mc_address 0.159
Priority 1.062 X2 0.095
S_port 0.896 Date 0.094
X4 0.852 X8 0
X5 0.849 X9 0
Time 0.772 X12 0
X3 0.749 X7 0
Source _IP 0.633 X11 0
X6 0.559 X10 0
Target_IP 0.465 X13 0
Sensor ID 0.426 X14 0
X1 0.426
doi:10.1371/journal.pone.0166017.t003
Table 4. Feature ranking using IG on Inside 1 DARPA 2000 dataset.
Features Scores Features Scores
A_ID 2.367 Sensor ID 0.267
D_port 1.815 X1 0.267
Priority 0.977 X14 0.209
S_port 0.575 X2 0
X5 0.555 X11 0
Time 0.543 X12 0
X4 0.542 X13 0
X3 0.532 Date 0
Target_IP 0.469 X7 0
Source _IP 0.455 X8 0
X6 0.453 X9 0
S_Mc_address 0.389 X10 0
Des_Mc_address 0.276
average AR of 39.7%. In addition, the drawback of this algorithm is that there is no efficient and universal method for identifying the initial partitions; and the centroids are varied with different initial points that lead to different results in different iterations.
2) Performance using EM algorithm
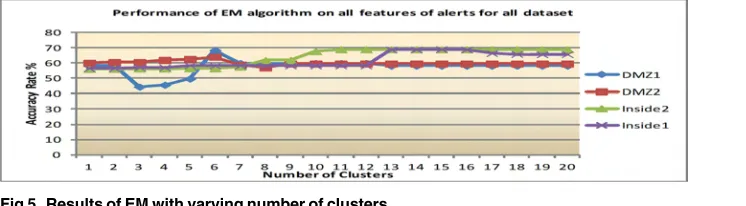
Within the EM algorithm, the highest accuracy (64% to 68.9%) is obtained when the num-ber of clusters is between 7 and 16. When the numnum-ber of clusters is more than this range, the performance of EM decreases. In average for all dataset, the EM’s best performance is 67.5%. The result of EM algorithm is shown inFig 5. The results show that EM is about 27.8% better than K-means. However, when the number of clusters is increased there is a possibility of EM to produce clustering and an incorrect group of alerts pattern. Hence, the experiments were continued with another algorithm.
3) Performance using Hierarchical algorithm
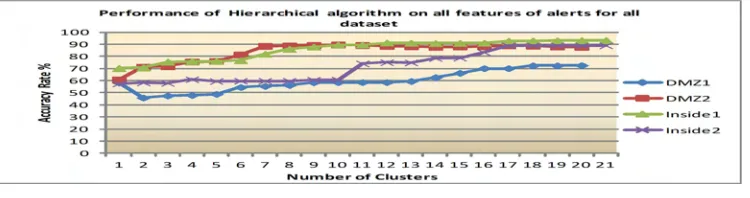
Meanwhile,Fig 6shows that Hierarchical cluster gives a slight improvement in its curve compared to EM. It produces a consistent result in the range of (72.3% to 93.2%) when the number of clusters equals the number of alerts type (class label) which are 17 clusters and above in all datasets. In average for all dataset, the hierarchical has the best performance 85.6%
Table 5. Feature ranking using IG on DMZ 2 DARPA 2000 dataset.
Features Scores Features Scores
A_ID 2.2 Sensor ID 0.077
D_port 1.561 X1 0.077
Priority 1.049 X11 0.
S_port 0.674 X2 0
Target_IP 0.663 X12 0
Source _IP 0.538 X13 0
X6 0.528 X10 0
X3 0.303 Date 0
Time 0.302 X7 0
X5 0.302 X8 0
X4 0.291 X9 0
S_Mc_address 0.163 X14 0
Des_Mc_address 0.16
doi:10.1371/journal.pone.0166017.t005
Table 6. Feature ranking using IG on Inside 2 DARPA 2000 dataset.
Features Scores Features Scores
A_ID 2.373 X1 0.166
D_port 1.741 Sensor ID 0.166
Priority 1.08 X8 0
S_port 0.52 X2 0
X6 0.518 Date 0
S_Mc_address 0.418 X11 0
Target_IP 0.344 X12 0
Des_Mc_address 0.334 X7 0
Source _IP 0.206 X9 0
X3 0.181 X10 0
Time 0.178 X13 0
X4 0.178 X14 0
X5 0.178
AR. With this, hierarchical performs better than K-means and EM with approximately 45.9% and 18.1% improvements respectively. The justification for adopting Agglomerative hierarchi-cal cluster is that the algorithm starts with each data point (feature) as a separate class and then each step of the algorithm involves merging two clusters that are most similar. This point is very useful in alert clustering to identify the accurate attack step.
Table 7details the best clustering Accuracy Rate (AR) produced by, K-means, and EM and Hierarchical algorithms on all datasets before feature selection. The details are based on results from Figs4–6.
Secondly, with the feature ranking that is mentioned above, four significant features which are: alert id, destination port, priority and source port are applied to the same clustering algo-rithms. The reason for this is to empirically prove that the ranked features improve clustering performance. Figs7–9show clustering accuracy rate with varying number of clusters to find optimum results.
1) K-means performance after feature ranking
In regards to K-Means, this study found that a range of 4 to 6 clusters yield the best perfor-mance, namely that of 75.1 percent AR for all datasets. After that, any increase in the cluster numbers implies a decrease in the clustering accuracy. There is a 35.4% improvement when compared to cluster performance before feature ranking. The result of K-means after feature selection is shown inFig 7.
2) EM performance after feature ranking
88.5% has been obtained in average for all dataset within the EM algorithm when the number of clusters is between 11 and 14. The results show that after feature ranking there is an improve-ment of about 22.2%. The detailed result of EM after feature ranking is presented inFig 8.
3) Hierarchical performance after feature ranking
In this experiment, the hierarchical clustering algorithm obtained the highest accuracy rate when the number of clusters equaled the number of alerts type in all datasets. As shown inFig 9, with DMZ1, 100% AR is obtained when the number of clusters equals the number of alert type (19). Therefore, 19 clusters of attack steps are presented. If the number of clusters is more
Fig 4. Results of K-means with varying number of clusters.
doi:10.1371/journal.pone.0166017.g004
Fig 5. Results of EM with varying number of clusters.
than 19, the clustering accuracy slowly downgrades. Furthermore, the clustering algorithm gives a high accuracy of 100% with 17, 20 and 22 number of clusters in DZM2 for inside1 and inside2 datasets respectively. Consequently, the improvement of hierarchical clustering algo-rithm after feature ranking is about 14.6%.
Table 8summarizes the best clustering accuracy offered by K-means, EM and Hierarchical algorithms on all datasets after feature ranking. The details are based on results from Figs7–9. The hierarchical algorithm gives the best result among the studied algorithms.
The reported empirical results on the investigated clustering algorithms lead to several observations and discussions:
1) Observation 1: Hierarchical cluster is a suitable candidate to cluster alerts in the struc-tural-based AC because the algorithm starts with each feature as a separate class or cluster and then merges the clusters or the classes that are more similar. This mean that, each ranked fea-ture (i.e., alert id, destination port, priority and source port) has its own cluster. After that, each cluster of a feature is compared to a class label (alert type) that denotes a certain attack class/step to measure the similarity and relevance between the cluster feature and the class label. Therefore, when the cluster of alert id feature compares to a class label (alert type), the algorithm obtains 100% AR because alert id is a dominant feature to alert type. However, this algorithm considers alert id as the main feature and the validation of the algorithm is based on this feature regardless of other features. For this reason, the investigation of other clustering algorithms to evaluate the significance of the other three features is needed.
2) Observation 2: The empirical results prove that the ranked features which are: alert id, destination port, priority and source port yields the best performances for EM and K-means algorithms, namely that of 88.5% and 75.1% AR respectively for all datasets. However, this improvement is still moderate, and according to Ren et al. [21], selecting the basic alert fea-tures may not be sufficient to fully discover these patterns. Furthermore, this research seeks to find accurate features that offer high cluster accuracy and represent the step of the attack accu-rately. Thus, additional features from the available dataset features which are useful in alert correlation are derived.
The above discussions motivate further investigations and experiments to improve the clus-tering accuracy. The experiments involve the use of three additional features along with ranked
Fig 6. Results of Hierarchical with varying number of clusters.
doi:10.1371/journal.pone.0166017.g006
Table 7. Summary on AR using K-means, EM and Hierarchical algorithm on all datasets before feature selection.
Datasets k Accuracy of K-means k Accuracy ofEM k Accuracy of Hierarchical
DMZ1 3 43.7 7 68.3 19 72.3
Inside1 2 37.7 7 64 17 88.2
DMZ2 4 43.1 16 68.9 22 93.2
Inside2 2 37.7 12 68.9 20 88.9
Mean 3 40.5 11 67.5 20 85.6
features, to produce an enhanced SAC model. The corresponding results are reported in the next section.
3.2 Additional Feature
IDS alerts features capture intrinsic attack characteristics that are mainly for identifying attack strategy such as the IP address of an alert, its port number, and time when the alert is triggered [21]. While the values of these features are the same for low-level alerts grouped on hyper-alert (except time), their values differ among the hyper alerts of the same type. At the same time, fea-ture values of hyper alerts share common patterns that allow describing the hyper-alert type [21]. Therefore, selecting the basic alert features may not be sufficient to fully discover these patterns. For this reason, additional features from the available dataset features which are use-ful in alert correlation were derived.
Source_IP, target_IP and time have been added as additional features because the source and destination IP addresses are the key of correlation [24]. Also, the time attributes can help to associate and cluster alerts that occur in short intervals [25]. It is concluded that alert ID, source port, destination port, source IP, destination IP, priority and time are the most signifi-cant features that are needed in alert correlation as described inTable 9.
Fig 10,Fig 11andFig 12show the performance of the clustering accuracy of K-means, EM and Hierarchical algorithms based on the seven selected features. They show that for each clus-tering algorithm tested K-means, EM, and Hierarchical, the selected features contribute supe-rior results with an average of 77.9%, 90.6% and 100% AR respectively. As mentioned before, the 100% AR obtained by the hierarchical algorithm is due to the dominant feature of alert id. K-means and EM empirical results prove that the additional features improve the clustering accuracy in the average of 2.8% and 2.1% respectively. The Summary of AR using K-means, FCM and EM algorithm on all datasets is presented inTable 10.
4.Discussion
In this paper, the practical results have confirmed that using the proposed features (ranking + additional features) gives significantly better clustering performance for representing attack
Fig 7. Results of K-means after feature ranking.
doi:10.1371/journal.pone.0166017.g007
Fig 8. Results of EM algorithm after feature e ranking.
step. As mentioned before each alert cluster represents an attack step of multi-stages attacks. Table 11represents the attack steps which are listed alphabetically and a number of alerts for each cluster is shown in the brackets. Based on the hierarchical clustering algorithm, the num-ber of attack steps discovered in each dataset is 19, 22, 17 and 20 respectively. A brief meaning of each attack step is described inTable 12. We observe that the Email_Ehlo is the highest num-ber of alerts in all dataset. This indicates that the attacker is trying hard to access information as much as he/she can from the Simple Mail Transfer Protocol (SMTP) configurations. Since SMTP is used to transfer e-mail messages between computers, this attempt is most likely to find a vulnerable path that the attacker can use to send harmful messages or files. When such intru-sion is successful, a lot of Email_Almail_Overflow are detected, indicating that the attacker is trying to overflow the email buffer. Other clusters which have a large number of alerts are Tel-netTerminaltype alerts, which indicate the beginning of a telnet session using the reported Ter-minal type has been detected. Furthermore, a high volume of alerts also precedes the File Transfer Protocol (FTP), for example, FTP_Pass, FTP_Syst, FTP_Put, and FTP_User. Based on Table 12, they are related to a standard network protocol which used to copy a file from one host to another over a TCP/IP-based network, such as the Internet. Additionally, FTP is built on a client-server architecture and utilizes separate control and data connections between the client and the server. Although users need to authenticate themselves using a clear-text sign-in protocol, sometimes they can connect anonymously if the server is configured to allow it. This is most probably the best reason for the attacker to exploit the FTP at the destination host.
Furthermore, For comparison with the proposed features, the features subsets selected by Siraj [18] and features subsets selected by Elshoush [26] were compared. The metrics for com-parison is the clustering accuracy. Siraj [18] claimed that three significant features were enough to cluster alerts; these are Alert type, Source port, and destination port. While Elshoush [26] suggested seven features to cluster alerts namely: EventID, times, SrcIPAddress, DestPort, DestIPAddress, OrigEventName, and SrcPort.Table 13shows the performance comparison among these feature subsets. The second row ofTable 13is the clustering accuracy of K-means and EM of all datasets based on the features subset proposed by Siraj[18]. Meanwhile, the final row is the accuracy rate of the same clustering algorithms for the features that were reported by Elshoush [26]. Performance comparison inTable 13shows that, overall, the selected
Table 8. Summary of clustering accuracy using K-means, EM and Hierarchical algorithm on all datasets after feature ranking.
Datasets k Accuracy of K-means k Accuracy of EM k Accuracy of Hierarchical
DMZ1 5 72.2 13 84.3 19 100
Inside1 4 73.7 14 86.8 17 100
DMZ2 6 77.6 14 91.7 22 100
Inside2 5 76.8 11 91.2 20 100
Mean 5 75 13 88.5 20 100
doi:10.1371/journal.pone.0166017.t008
Fig 9. Results of Hierarchical after feature ranking.
features proposed in this research give better clustering results compared to the features pro-posed by [18] and [26].Fig 13andFig 14illustrate the comparison in graphical formats.
In conclusion of the performance validation and benchmark of the proposed features, some observations have been outlined:
Table 9. The description of significant features of DARPA 2000 dataset.
Label Corresponding Features Description of Features
A_ID Alert ID Unique identifier of alert
D_port Destination Port Receiver’s Port number
Priority Priority Describes the Severity of alerts
S_port Source Port Sender’s port number
Source _IP Source IP address IP address of sender
Target_IP Target IP address IP address of a receiver
Time Time The time when alert is generated
doi:10.1371/journal.pone.0166017.t009
Fig 10. Results of K-means based on the seven selected features.
doi:10.1371/journal.pone.0166017.g010
Fig 11. Results of EM based on the seven selected features.
doi:10.1371/journal.pone.0166017.g011
Fig 12. Results of Hierarchical based on seven selected features.
1. The Alert ID, Destination Port, and Source Port, which are high impact features in ranking, are the same features used in [18], however, giving lower accuracy than the proposed selected features.
2. Source IP address, Destination IP address and time which are proposed as additional fea-tures with the proposed feafea-tures ranking are the same feafea-tures used in [26]. Also, [26] gives better performance than [18] which used the same ranking features only.
5. Conclusion
Clustering and finding relationships between alerts is an important issue since alerts are not significant if they are isolated. The pattern of attack steps taken by the attacker is discovered when the similar pattern of alerts are recognized and grouped based on proper features.
Table 10. Summary on AR using K-means, FCM and EM algorithm on all datasets.
K-means EM Hierarchical
DMZ1 Inside1 DMZ2 Inside2 Mean DMZ1 Inside1 DMZ2 Inside2 Mean DMZ 1 Inside1 DMZ2 Inside2 Mean
Raw Data 43.7 37.7 43.1 37.7 40.5 68.39 64 68.9 68.9 67.5 72.3 88.2 93.2 88.9 85.6
Rank Feature 72.2 73.7 77.6 76.8 75 84.3 86.8 91.7 91.2 88.5 100 100 100 100 100
Selected Feature 76.8 73.7 81.4 79.9 77.9 87.5 90.4 93.4 91.2 90.6 100 100 100 100 100
doi:10.1371/journal.pone.0166017.t010
Table 11. List of attack steps (clusters) discovered on all dataset. Cluster
index
DMZ1 (19 clusters, 886 alerts) Inside1 (22 clusters, 922 alerts) DMZ2 (17) clusters, 425 alerts) Inside2 (20 clusters, 489 alerts)
1 Admind (38) Admind (17) Admind (2) Admind (4)
2 Email_Almail_Overflow (40) Email_Almail_Overflow (38) Email_Almail_Overflow (23) Email_Almail_Overflow (22)
3 Email_Debug (2) Email_Debug (2) Email_Ehlo (253) Email_Ehlo (272)
4 Email_Ehlo (515) Email_Ehlo (522) Email_Turn (1) Email_Turn (1)
5 FTP_Pass (36) FTP_Pass (49) FTP_Pass (20) FTP_Pass (27)
6 FTP_Syst (34) FTP_Syst (44) FTP_Put (1) FTP_Put (2)
7 FTP_User (36) FTP_User (49) FTP_Syst (16) FTP_Syst (18)
8 HTTP_Cisco_Catalyst_Exec (2) HTTP_Cisco_Catalyst_Exec (2) FTP_User (20) FTP_User (27)
9 HTTP_Java (8) HTTP_Shells (15) HTTP_ActiveX (1) HTTP_ActiveX (1)
10 HTTP_Shells (15) HTTP_Java (8) HTTP_Cisco_Catalyst_Exec (5) HTTP_Cisco_Catalyst_Exec (5)
11 Rsh (16) Mstream_Zombie (6) HTTP_Java (30) HTTP_Java (30)
12 Sadmind_Amslverify_Overflow (32)
Port_Scan (1) Sadmind_Amslverify_Overflow (2)
Mstream_Zombie (3)
13 Sadmind_Ping (6) RIPAdd (1) SSH_Detected (2) Port_Scan (1)
14 SSH_Detected (8) RIPExpire (1) TCP_Urgent_Data (2) RIPAdd (1)
15 TCP_Urgent_Data (8) Rsh (17) TelnetEnvAll (1) Sadmind_Amslverify_Overflow
(4) 16 TelnetEnvAll (1) Sadmind_Amslverify_Overflow
(14)
TelnetTerminaltype (45) Stream_DoS (1)
17 TelnetTerminaltype (87) Sadmind_Ping (3) TelnetXdisplay (1) TCP_Urgent_Data (1)
18 TelnetXdisplay (1) SSH_Detected (4) TelnetEnvAll (2)
19 UDP_Port_Scan (1) Stream_DoS (1) TelnetTerminaltype (65)
20 TelnetEnvAll (1) TelnetXdisplay (2)
21 TelnetTerminaltype (126)
22 TelnetXdisplay (1)
Different features were selected manually by previous researchers based on their knowledge experience which lead to less accurate in the identification of attack steps and inconsistent per-formance of clustering accuracy. This paper focuses on presenting accurate attack steps by pro-posing a 2-tier feature selection method to select appropriate and significant features. The selected features are evaluated in terms of clustering accuracy. The empirical results show that the selected features can significantly identify accurate attack steps and improve the overall clustering performance.
Table 12. Description of attack steps based on RealSecure Signatures Reference Guide Version 6.0 (Internet Security Systems.
Alert Cluster Description
Admind If it is used with insecure authentication, an attacker could compromise the computer and add user accounts. Email_Almail_Overflow It can overflow a buffer (e.g. email) and the attacker can execute arbitrary code.
Email_Debug An attempt to initiate a root-level shell on the target host.
Email_Ehlo An attempt to determine the configuration information on SMTP daemons.
Email_Turn An attempt to pick up mail intended for other hosts. Since only very old versions of Sendmail are vulnerable to this attack, it is a false positive
FTP_Pass The FileTransfer Protocol (FTP) passes a plaintext password across the network to allow a user has access to the files. FTP_Put The FTP uses a PUT (technically STOR) command in order to transfer the files.
FTP_Syst An attempt to know the type of server’s operating system to exploit other vulnerabilities likely to be present. FTP_User It records the username on the FTP server of the person transferring files.
HTTP_ActiveX ActiveX is a Web technology that can be used to execute a local command (e.g. to shut down) the computer. HTTP_Cisco_Catalyst_Exec An attempt to view the configuration file and obtain user passwords.
HTTP_Java In a Java enabled Web browser, the browser may access files that contain Java code from remote Web sites.
HTTP_Shells It is considered a bad security practice to put shell interpreters (e.g. sh) in the cgi-bin directory. This vulnerability is false positive.
Mstream_Zombie The mstream program is a distributed denial of service tool based on the stream.c attack.
Port_Scan A portscan is an attempt by an attacker to determine what services are running on a system by probing each port for a response.
RIPAdd An attempt to gain access by loading false information into the network routing tables.
RIPExpire When a RIP entry is being timed out, one of the networks is about to be marked as unreachable.
Rsh Rsh uses very weak authentication mechanisms, and has historically been frequently used by attackers to penetrate systems.
Sadmind_Amslverify_Overflow An attempt to overflow a buffer in the amsl_verify() function and execute arbitrary code with root privileges. Sadmind_Ping An attempt to scan a network for potentially vulnerable systems.
SSH_Detected The Secure Shell (SSH) protocol is an encrypted alternative to other interactive login protocols like rsh, rlogin, and telnet. Stream_DoS The stream.c attack is a denial of service attack designed to crash a vulnerable system by sending a flood of spoofed TCP
packetswith the ACK flag set to random destination ports on the host.
TCP_Urgent_Data An attacker could misuse Out of band (OOB) data to evade IDS or execute some Windows denial of service attacks. TelnetEnvAll An attempt to allow users to pass environment variables from the remote system.
TelnetTerminaltype The beginning of a telnet session using the reported Terminaltype has been detected. TelnetXdisplay An XDisplay that is different than the source IP address may indicate an attack.
UDP_Port_Scan An attempt to scan UDP ports to reveal listening client or server processes before performing an attack.
doi:10.1371/journal.pone.0166017.t012
Table 13. Performance comparison with other feature subsets.
K-means EM
DMZ1 Inside1 DMZ2 Inside2 Mean DMZ1 Inside1 DMZ2 Inside2 Mean
Proposed Features 76.8 73.7 81.4 79.9 77.9 87.5 90.4 93.4 91.2 90.6
Proposed Features by Siraj (2013) 73.9 73.4 77.6 79.5 76.1 82.3 76.5 89.1 72.3 80.1 Proposed Features by Elshoush (2013) 73.9 73.4 77.6 79.5 76.1 82.3 87.7 87.7 82.2 84.9
Acknowledgments
We would like to thank Ministry of Higher Education (MoHE) and Universiti Teknologi Malaysia for funding this work under Potential Academic Staff research grant with reference number PY/2014/02899.
Author Contributions
Conceptualization: TA.
Data curation: TA.
Formal analysis: TA MS AZ.
Funding acquisition: MS.
Investigation: TA.
Methodology: TA.
Project administration: MS AZ.
Resources: TA.
Software: TA MS AZ HE FE.
Supervision: MS AZ HE.
Validation: TA MS AZ HE FE.
Visualization: TA MS AZ HE FE.
Writing – original draft: TA MS AZ HE FE.
Writing – review & editing: TA MS AZ HE FE.
Fig 13. Comparison on accuracy performance of K-means in all datasets.
doi:10.1371/journal.pone.0166017.g013
Fig 14. Comparison on accuracy performance of EM in all datasets.
References
1. Srilatha C, Ajith AB, Johnson PT. Feature deduction and ensemble design of intrusion detection sys-tems, 2005.
2. Anderson D et al. Safeguard final report: Detecting unusual program behavior using the NIDES statisti-cal component. Computer Science Laboratory. SRI International, Menlo Park, CA, Technistatisti-cal Report (1993).
3. Yang D, Qi H. A network intrusion detection method using independent component analysis. Pattern Recognition (ICPR), 19th International Conference on. 2008; 1–4.
4. Debar H, Wespi A. Aggregation and correlation of intrusiondetection alerts. Recent Advances in Intru-sion Detection. 2001; 85–103.
5. Qin X, Lee W. Statistical causality analysis of infosec alert data. Recent Advances in Intrusion Detec-tion. 2003; 73–93.
6. Wang J-X, Wang Z-Y. Intrusion Alert Analysis Based on Pca and the Lvq Neural Network. Neural Infor-mation Processing. 217–224.
7. Forman G, An extensive empirical study of feature selection metrics for text classification, Journal of Machine Learning Research. 2003; 3:1289–1305.
8. Inza I, Larranaga P, Blanco R, Cerrolaza A. Filter versus wrapper gene selection approaches in dna microarray domains. Artificial Intelligence in Medicine. 2004; 31:91–103. doi:10.1016/j.artmed.2004. 01.007PMID:15219288
9. Zainal A, Maarof MA, Shamsuddin SM. Feature Selection Using Rough Set in Intrusion Detection. 2006. 10. Lee W, Stolfo SJ, Mok KW. Adaptive intrusion detection: a data mining approach. AI Review. 20001; 4
(6): 533–567.
11. Saeys Y, Inza I, Larrañaga P. A review of feature selection techniques in bioinformatics. Bioinformatics. 2007; 23(19): 2507–2517. doi:10.1093/bioinformatics/btm344PMID:17720704
12. Xing E, Jordan M, Karp R. Feature selection for high-dimensional genomic microarray data. In: Pro-ceedings of the 8th International Conference on Machine Learning. 2001; 601–608.
13. Bolon-Canedo Veronica, Sanchez-Marono N, Alonso-Betanzos A. Feature selection and classification in multiple class datasets. An application to KDD Cup 99 dataset. Expert Systems with Applications. 2011; 38(5): 5947–5957.
14. Chandrashekar Girish, Sahin F. A survey on feature selection methods. Computers Electrical Engineer-ing. 2014; 40(1): 16–28.
15. Tjhai GC, Furnell SM, Papadaki M, Clarke NL. A preliminary two-stage alarm correlation and filtering system using SOM neural network and K-means algorithm. Computers & Security. 2010; 29: 712–723. 16. Man D, Yang W, Wang W, Xuan S. An alert aggregation algorithm based on iterative self-organization.
Procedia Engineering. 2012; 29:3033–3038.
17. Mohamed AB, Idris NB, Shanmugum B. Alert correlation using a novel clustering approach. In: Pro-ceedings of the International Conference on Communication Systems and Network Technologies (CSNT). 2012; 720–725.
18. Siraj MM. Hybrid of Structural, Causal and Statistical Model for Intrusion Alert Correlation. University Technology Malaysia. PhD Thesis.
19. Shittu Riyanat, et al. "Intrusion alert prioritisation and attack detection using post-correlation analysis." Computers & Security.2015. 50., 1–15.
20. Ramaki Ali Ahmadian, Amini Morteza, and Atani Reza Ebrahimi. "RTECA: Real time episode correla-tion algorithm for multi-step attack scenarios deteccorrela-tion." computers & security .2015: 206–219. 21. Ren Hanli, Stakhanova N, Ali AG. An online adaptive approach to alert correlation. Detection of
Intru-sions and Malware, and Vulnerability Assessment. Springer Berlin Heidelberg, 2010; 153–172. 22. Chandrashekar Girish, Sahin F. A survey on feature selection methods. Computers & Electrical
Engi-neering. 2014; 40(1): 16–28.
23. Yang Yiming, Pedersen JO. A comparative study on feature selection in text categorization. ICM 1997, 97.
24. Reuben S et al. Using unsupervised learning for network alert correlation. Advances in Artificial Intelli-gence. Springer Berlin Heidelberg. 2008; 308–319.
25. Salim Lalla Fatima, Mezrioui A. Improving the quality of alerts with correlation in intrusion detection. IJCSNS International Journal of Computer Science and Network Security. 2007; 7(12): 210–215. 26. Elshoush, Tagelsir H, Osman IM. An improved framework for intrusion alert correlation. Proceedings of