Division V
AN EXPERIMENTAL STUDY OF THE IN-PLANE CYCLIC BEHAVIOR
OF STEEL-PLATE COMPOSITE WALLS WITH
BOUNDARY ELEMENTS
Chang-Ching Chang1, Yin-Nan Huang2, Yu-Cheng Cheng3, and Chi-An Ho3
1 Associate Research Fellow, National Center for Research on Earthquake Engineering,
National Applied Research Laboratories, Taiwan
2 Associate Professor, Department of Civil Engineering, National Taiwan University, Taiwan
3 Graduate Student, Department of Civil Engineering, National Taiwan University, Taiwan
ABSTRACT
Steel-plate composite (SC) walls recently have been used for the construction of nuclear power plants. A SC wall is composed of steel faceplates, infill concrete, and connectors. The faceplates are joined with steel tie rods that ensure structural integrity. Steel studs are welded to the faceplates to ensure composite action. The AISC N690s1 specification includes provisions for the design of SC walls in safety-related nuclear facilities, and the design strength formulas of SC walls in AISC N690 were developed partly based on the results of pure shear tests of SC wall specimens without boundary elements or flanges. More research is needed to study the seismic behavior and design of SC walls with boundary elements.
This paper summarizes the results of in-plane cyclic tests of three SC walls with boundary elements. The tests were executed in the laboratory of National Center for Research on Earthquake Engineering (NCREE) in Taiwan. Thick steel plates were used as boundary elements of the three specimens. To study two kinds of failure modes, we included in the test 1) two shear-critical walls with an aspect ratio of 0.75 and a thickness of 3 cm for boundary elements; and 2) one flexure-critical wall with an aspect ratio of 1.22 and a thickness of 2 cm for boundary elements. The failure mode and cyclic behavior of each specimen are reported. The test results are compared with the recommendations of AISC N690s1 and predictions of selected literatures. The impact of wall aspect ratio on in-plane shear strength of SC walls with boundary elements is discussed.
INTRODUCTION
Steel-plate composite (SC) walls are being constructed in nuclear power plants (NPPs) in the United States and China. These walls are composed of steel faceplates, infill concrete, welded connectors that tie the plates together and provide out-of-plane shear reinforcement, and shear studs that enable composite action of the faceplate and the infill concrete and delay buckling of the faceplate. The use of SC walls in safety-related nuclear facilities in Korea, Japan, and the United States has been studied (e.g., Ozaki et al. 2004, Epackachi et al. 2014, Varma et al. 2014) for the past 20 years. In earlier days, most of numerical studies and test data in the studies of SC walls have focused on the elastic range of response, because NPPs are designed to remain elastic under design basis shaking. Since a decade ago, the nonlinear behavior of SC walls has drawn more and more attention.
with boundary elements should include two parts: the shear force required to yield the steel plates and an incremental shear resisted by the concrete in diagonal compression up to the failure of the wall. The study on the nonlinear flexural-critical behavior of SC walls with boundary elements is relatively rare.
This paper addresses the inelastic response of three SC walls with boundary elements subjected to reversed, in-plane cyclic loading. In this study, thick steel plates, termed endplates, attached at the ends of a SC-wall specimen are used to represent the boundary elements of the specimen. To study two kinds of failure modes, we included in the test 1) two shear-critical walls with an aspect ratio of 0.75 and a thickness of 3 cm for boundary elements; and 2) one flexure-critical wall with an aspect ratio of 1.22 and a thickness of 2 cm for boundary elements. The following sections of the paper describe the testing program, present key experimental results, and the predictions of the strength of SC walls with boundary elements.
EXPERIMENTAL PROGRAM
Test Specimen Description
Three SC walls with boundary elements (SC1 through SC3) were constructed and tested under displacement-controlled, reversed cyclic loading. The tests were performed at the National Center for Research on Earthquake Engineering (NCREE) in Taiwan. The design variables considered in the testing program were aspect ratio and concrete strength. The aspect ratio (height-to-length, H L/ ) is 0.75 for the two shear-critical walls, SC1 and SC2, and 1.22 for the flexural-critical wall SCB3. To study the impact of concrete strength on the lateral strength of SC walls with boundary elements, we used very different strength of concrete for SC1 and SC2 (237 and 431 kgf/cm2, respectively). The strength of concrete for SC3 is similar to that for SC1. Table 1 presents the key parameters for the three specimens.
In Table 1, T is the overall thickness of the wall; tp is the thickness of each faceplate is; 2tp T is the reinforcement ratio; and S t/ p is the slenderness ratio of faceplate; and tie rods serve as connectors for all
three specimens, spaced at distance S. The tie rods had a diameter of 13 mm and a length of 8 cm for all walls, and were fabricated using ASTM A490 carbon steel. The steel faceplates had a thickness of 4.5 mm and were fabricated using JIS G3131 SPHC steel. The thickness of endplates for SCB1 and SCB2 was 3 cm and that for SCB3 was 2 cm. All endplates were fabricated using SN490B steel. The yield and ultimate strengths of the faceplates, endplates and tie rods are listed in Table 2.
Table 1: Test specimen details
Specimen
Wall dimension (H L T) (cm cm cm )
Concrete strenth (kgf/cm2)
Tie rod spacing (cm)
Reinforcement Ratio (%)
End-plate thickness
(cm)
SC1 90×120×25.9 237.3 11 3.5 3
SC2 90×120×25.9 430.8 11 3.5 3
SC3 146×120×25.9 226.3 11 3.5 2
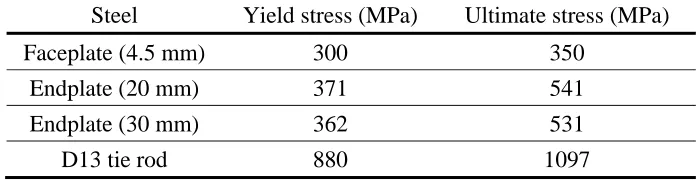
Table 2: Yield and ultimate stresses of steel faceplates, endplates and tie rods Steel Yield stress (MPa) Ultimate stress (MPa)
Faceplate (4.5 mm) 300 350
Endplate (20 mm) 371 541
Endplate (30 mm) 362 531
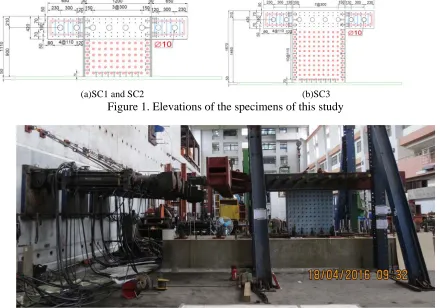
Panel a of Figure 1 presents an elevation view of SC1 and SC2 and panel b presents that of SC3. The base of each wall included a 50-mm thick A572 Gr.50 steel baseplate. Endplates and faceplates of a specimen were welded to the baseplate. Two rows of 19-mm diameter headed studs were welded to the baseplate to improve the transfer of shearing and tensile forces. Transverse reinforcement (tie rods) was passed through holes in the embedded sections of the faceplates to further anchor the faceplates.
Test Setup and Loading Procedure
Figure 2 presents the test setup. Six 100-tonne actuators were used to apply quasi-static cyclic lateral loads horizontally to each specimen via loading brackets. The foundation block was post-tensioned to the NCREE strong floor with 16 number 69-mm diameter (M69) threaded bars to prevent foundation movement during testing. The loading brackets were attached to the specimen using 8 M69 bars post-tensioned to 160 tonnes per bar.
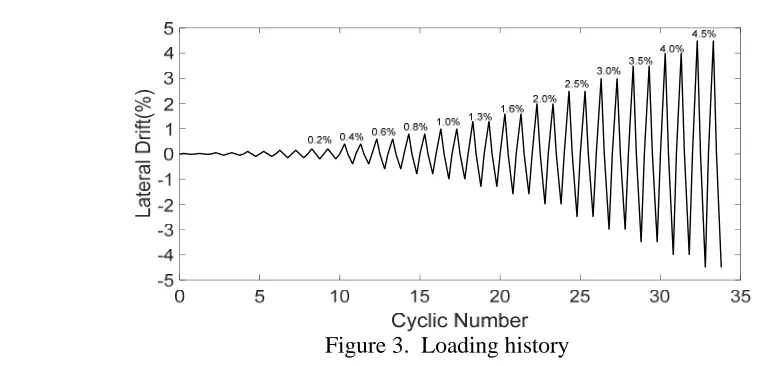
The displacement-controlled, reversed cyclic loading protocol is presented in Figure 3. Two cycles of loading, with a speed of 0.2 mm/sec, were imposed at each displacement increment. In each loading cycle, a push was exerted first, followed by a pull, where push was defined as the loading in the positive direction to the east (+). Testing was terminated after peak strength had been achieved, at a displacement corresponding to a 50% reduction in resistance.
(a)SC1 and SC2 (b)SC3 Figure 1. Elevations of the specimens of this study
Figure 3. Loading history
Instrumentation
An optical measurement system, strain gauges, linear variable displacement transducers, and dial gauges were used to monitor the response of the wall piers. Linear variable displacement transducers were attached to the ends of the walls to measure in-plane displacement. The movements of 1) the foundation block relative to the strong floor and 2) the loading block relative to the specimen were monitored using dial gauges. The trackers of the optical measurement system were attached to one steel faceplate as presented in panel a of Figure 4 to measure in-plane and out-of-plane deformations. Strain gauges were installed on the other faceplate and both endplates as presented in panel b of Figure 4 to directly measure strains.
(a) Optical trackers of the optical measurement system (b) Strain gauges Figure 4. Measuring the strain fields on the faceplates of SC1 and SC2
EXPERIMENTAL RESULTS
Summary of Test Results
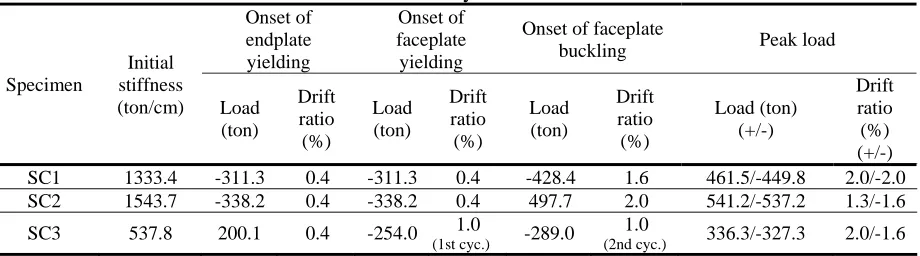
drift angle corresponding to the onset of endplate (faceplate) yielding are listed in columns 3 and 4 (columns 5 and 6) of Table 3. First yielding of the faceplates was identified using strain gage data. Columns 7 and 8 present the lateral force and drift angle corresponding to the onset of faceplate buckling. Columns 9 and 10 present the peak loads and the corresponding drift angles in the positive and negative directions.
Both the initial stiffness and peak load for SC2 are greater than those for SC1 because although the two specimens have the same dimension, the strength of concrete for SC2 is greater than that for SC1. For the two shear-critical walls (SC1 an SC2), the yielding of endplates and faceplates occurred at the same time and earlier than the onset of faceplate buckling. For the flexural-critical wall (SC3), the yielding of faceplates occurred much later than the yielding of endplates since the flexural behavior dominated the demand of the wall.
Table 3: Summary of test results
Specimen Initial stiffness (ton/cm) Onset of endplate yielding Onset of faceplate yielding
Onset of faceplate
buckling Peak load
Load (ton) Drift ratio (%) Load (ton) Drift ratio (%) Load (ton) Drift ratio (%) Load (ton) (+/-) Drift ratio (%) (+/-) SC1 1333.4 -311.3 0.4 -311.3 0.4 -428.4 1.6 461.5/-449.8 2.0/-2.0 SC2 1543.7 -338.2 0.4 -338.2 0.4 497.7 2.0 541.2/-537.2 1.3/-1.6 SC3 537.8 200.1 0.4 -254.0 1.0
(1st cyc.) -289.0
1.0
(2nd cyc.) 336.3/-327.3 2.0/-1.6 Sequence of Damage to SC Walls
Figure 5 illustrates the sequence of damage to the faceplates and endplates of SC1, including (1) the yielding of the endplates and faceplates, (2) welding rupture between the faceplate and endplate, (3) buckling of the faceplates, and (4) rupture of the faceplates. Figure 6 illustrates the sequence of damage to the faceplates and endplates of SC3, which is different from that for SC1 and SC2, including (1) the yielding of the endplates (first) and faceplates (later), (2) welding rupture between the faceplate and endplate, (3) buckling of the faceplates near the toes of the specimen, and (4) rupture of welding between the endplate and baseplate. The lateral-load capacity of SC3 dropped significantly after the brittle failure of the welding between the endplate and baseplate, which terminated the test.
A steel faceplate was removed from each of the three specimens for the purpose of documenting damage to the infill concrete. The shear-critical and flexural-critical walls show entirely different damage mechanism. Panels a and b of Figure 7 presents the result for SC1 and SC2, respectively. Infill concrete was severely damaged along the diagonal lines of the specimens. Panel c of Figure 7 presents the result for SC3. Although some diagonal cracks in the lower half of the wall and crushing of concrete near the toes of the wall were observed, most of the infill concrete stayed undamaged.
(a) Yielding of steel endplates and
faceplates
(b) Welding rupture between faceplates
and boundary elements
(c) Buckling of
faceplates (d) Rupture of faceplates
Figure 5. Sequence of damage of SC1
(a) Yielding of steel endplates and
faceplates
(b) Welding rupture between faceplates
and boundary elements
(c) Buckling of faceplates
(d) Welding rupture between baseplate
and boundary elements Figure 6. Sequence of damage of SC3
(a) SC1 (b) SC2 (c) SC3
Figure 7. Damage of in-fill concrete after the test
(d) SC1 (e) SC2 (f) SC3
Force-Displacement Cyclic Response
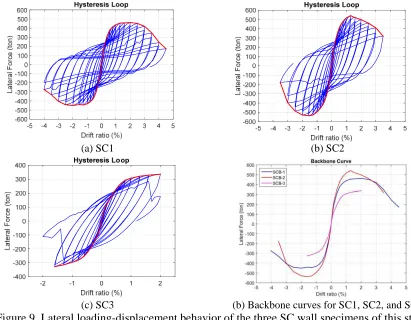
Panels a, b, and c of Figure 9 present the hysteresis loops for SC1 through SC3, respectively. SC1 has the best ductility among the three. The strength of SC1 did not show degradation and the pinching of the loop was not obvious before a draft ratio of 2.5%. After a draft ratio of 2.5%, the faceplates buckled significantly and cannot provide enough confinement to the infill concrete. The strength of SC1 began to degrade and the pinching in the loop became more obvious. However, the specimen still maintained 80% of its peak lateral-load capacity until a draft ratio of 3.5%. The strength of SC2 began to degrade right after the specimen reached its peak capacity. A possible reason is that the specimen was subjected to higher shear and moment demands than SC1 and the increasing moment in the specimen reduced its shear capacity. SC2 maintained 80% of its peak strength until a draft ratio of 3%.
Panel d of Figure 9 presents the backbone curves of the hysteresis loops of panels a, b and c. SC3 has the worst ductility among the three since the failure mode for the specimen is the brittle failure of welding at the bottom of the endplates.
(a) SC1 (b) SC2
(c) SC3 (b) Backbone curves for SC1, SC2, and SC3
Figure 9. Lateral loading-displacement behavior of the three SC wall specimens of this study
PREDICTION OF THE STRENGTH OF SC WALLS WITH BOUNDARY ELEMENTS
Shear-Critical SC Walls
ub y
V V V (1)
0.33 0.5 ( c cy) c
V f f A
(2)
( 1)
2
c xy s
cy
p s sc c
E S
f
t E t E
(3)
where Vy can be computed per the recommendations of AISC N691-12s1; fc is the concrete
compressive strength; fcy is the diagonal concrete compressive stress occurring when the applied shear is equal to Vy; Ac is the concrete area; Ec is an effective elastic concrete stiffness; SXY is the unit element shear force at yield; s is the Poisson’s ratio for steel; tp is the thickness of faceplate; Es is the elastic modulus of steel; and tsc is the thickness of the SC wall. The authors of this paper evaluated the effectiveness of the model of Eqs. (1) through (3) using the experimental data from literature and found that the model can be further improved by taking into account the impact of the aspect ratio of a wall:
cos( ) cos(45 ) ub ub
V V (4)
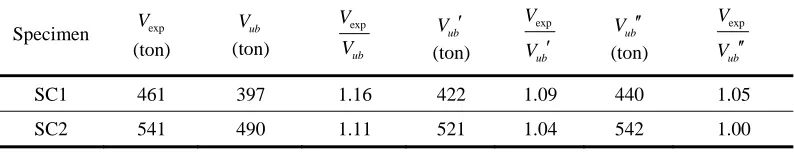
where is the angle between the diagonal line of a wall and the horizontal line. The peak strengths of SC1 and SC2 from the test (Vexp) and the predictions of Eq. (1) and Eq. (4) are presented in the 2nd, 3rd, and 5th columns of Table 4. The model of Eq. (4) improves the accuracy of the prediction of Eq. (1). The value of used in the computation of Vub in Table 4 is the angle between the blue line of Figure 10 and the horizontal line. Since the upper part of the specimens were clamped by the loading beams, we recalculated the predictions of Eq. (4) using the angle of the red line of Figure 10 rather than the blue line and the results (termed Vub) are presented in the 7th column of Table 4. The ratio of Vexp to Vub is 1.05 for SC1 and 1.0 for SC2.
Table 4. Test results and the prediction of models on the strength of SC1 and SC2
Specimen Vexp (ton) ub V (ton) exp ub V V ub V (ton) exp ub V V ub V (ton) exp ub V V
SC1 461 397 1.16 422 1.09 440 1.05
SC2 541 490 1.11 521 1.04 542 1.00
Figure 10. The definition of
Flexural-Critical SC Walls
Table 5 presents the peak strength of SC3 from the test (Vexp) and the prediction of simple section analysis using software XTRACT (VXTRACT). The value of VXTRACT was computed using the moment capacity of the
section of SC3 divided by the height of the specimen. The ratio of Vexp to VXTRACT for SC3 is 1.02. The
Table 5: Experimental results and numerical results using XTRACT on the strength of SC3
Specimen Vexp
(ton)
XTRACT XTRACT
V
(ton)
exp
XTRACT
V
V
SC3 336 330 1.02
CONCLUSION
Three SC walls with boundary elements, SC1 through SC3, were constructed and tested under displacement-controlled, reversed cyclic loading at the National Center for Research on Earthquake Engineering in Taiwan. The specimens were designed to be shear-critical (SC1 and SC2) and flextural-critical (SC3). Key conclusions of this study are listed as follows:
(1). The shear-critical specimens of this study demonstrated very ductile behavior. Both specimens
reached a drift ratio of 3% without losing 80% of their peak capacity.
(2). The test of the flexural-critical specimen SC3 stopped at a drift ratio of 2% after the brittle rupture of the welding between the endplate and baseplate. The connection design for such SC walls is challenging and needs to be conducted carefully.
(3). The model of Booth et al. (2015) in predicting the shear strength of a shear-critical SC wall with boundary elements can be improved by taking into account the aspect ratio of the wall.
(4). The lateral-load strength of a flexural-critical SC wall can be predicted well using section analysis.
ACKNOWLEDGMENTS
The research presented in this paper was supported by a grant from National Center for Research on Earthquake Engineering, National Applied Research Laboratories, Taiwan. The support is gratefully acknowledged.
REFERENCES
AISC (2015). ”Specification for safety-related steel structures for nuclear facilities, Supplement No. 1.” N690s1, American Institute of Steel Construction, Chicago, IL.
Ozaki, M., Akita, S., Osuga, H., Nakayama, T., Adachi, N. (2004). “Study on steel plate reinforced concrete panels subjected to cyclic in-plane shear.” Nuclear Engineering and Design, 228, 225–244. Varma, A. H., Malushte, S., Sener, K., Lai, Z., (2014). “Steel-plate composite (SC) walls for
safety-related nuclear facilities: design for in-plane force and out-of-plane moments.” Nuclear Engineering and Design, 269, 240-249.