ABSTRACT
SIMMONS, KARLA PEAVY. Body Shape Analysis Using Three-Dimensional Body Scanning Technology. (Under the direction of Dr. Cynthia L. Istook and Dr. Trevor Little, co-chairs.)
Clothing fit is a major cause of frustration for consumers today. The
current sizing systems for women in the US are based on a study that is over 6
decades old. The greater influence of ethnic diversity along with changes in
lifestyles since the 1940s is making our bodies look differently. New technology
is allowing the rapid and accurate ability to determine the true shape of human
bodies through 3D body scanning. No attempts have been made to study body
shapes and sizes using the 3D body scanner until this pilot study.
A computer program was developed to derive a numerical difference in
body measurements between those of the subjects and those defined by all
current and past sizing standards demonstrating that the current sizing system is
insufficient. Three methods were developed in the Best Fit software to ascertain
the sufficiency of the standards: percentage difference, tolerance difference, and
weighted tolerance difference. Even though the CS215-58 was the most chosen
standard for the best fit in the percentage difference, 30% of the measures in that
standard deviated more than 5% from the subject’s measurements. For the
tolerance difference, the ASTM5586-95 was the most chosen standard and had
an average of 14 measurements (out of 23) that were out-of-tolerance as
compared to the subject’s measurements. For the weighted tolerance difference,
the 23 measurements for a subject were out-of-tolerance to the most severe
amount, then the subject would get a score of 69. This study had an average
score of 20 for weighted tolerance.
A new shape identification software was developed through the computer
program of Visual Basic Pro called FFIT (Female Figure Identification Technique)
for Apparel. Nine shape categories were identified: “hourglass”, “oval”, “triangle”,
“inverted triangle”, “rectangle”, “spoon”, “diamond”, ”bottom hourglass”, and “top
hourglass”. The bust, waist, hip, stomach, and abdomen circumferences were
used in combination to describe each shape. The Bottom Hourglass was the
shape identified most frequently (40%), followed by the Hourglass (21.6%),
BODY SHAPE ANALYSIS USING THREE-DIMENSIONAL BODY SCANNING TECHNOLOGY
By
KARLA KRISTIN PEAVY SIMMONS
A dissertation submitted to the Graduate Faculty of North Carolina State University
In partial fulfillment of the Requirements for the Degree of
Doctor of Philosophy
Textile Technology and Management
Raleigh
July 29, 2002
APPROVED BY:
Dr. Nancy Cassill Dr. Thomas Johnson
Dr. Cynthia L. Istook Dr. Trevor Little
Karla P. Simmons ii DEDICATION
To my loving parents,
John Lester and Patricia Vail Peavy: through your sacrifices, support,
encouragement and prayers, I
Karla P. Simmons iii BIOGRAPHY
Karla Kristin Peavy Simmons, daughter of John Lester and Patricia (Vail)
Peavy, was born July 17, 1970, at Nellis Air Force Base in Las Vegas, Nevada.
She graduated from J. U. Blacksher High School in Uriah, Alabama in 1988. She
then attended Auburn University and graduated with a Bachelor of Science
degree in Textile Management and Technology with a minor in Apparel
Production Management in 1992. After working as a quality control supervisor
and a cutting department shift supervisor for Oneita Industries, she returned to
Auburn University for a master’s degree in Apparel Production Management and
graduated in December 1996. Karla was a Textile and Apparel Technology
Instructor for Central Alabama Community College in Alexander City, Alabama,
until she started her doctoral degree in Textile Technology and Management at
North Carolina State University in Raleigh, North Carolina. Before graduation,
she began teaching at the University of Missouri-Columbia in the College of
Human Environmental Sciences, Department of Textile and Apparel
Management. She is the head of the Apparel Manufacturing Management area.
Karla has been married to Cronor Gilliam (Gill) Simmons of Raleigh, North
Karla P. Simmons iv ACKNOWLEDGEMENTS
Numerous individuals have touched my life over the years. The author would
like to thank:
• David Wiggins, chemistry and physics teacher at J.U. Blacksher High
School. Thank you for always pushing, encouraging, and preparing me
for the world ahead. Without you, my academic road would not have been
so fruitful!
• Vanity Fair Mills: Thank you for sponsoring high school students, like
myself, to attend open house at the Textile Engineering Department at
Auburn University. That’s where it all got started!!
• Dr. Lenda Jo Anderson Connell, Associate Professor at Auburn University:
Thank you for your nurturing, guidance, and instruction in the many years
you’ve been my mentor. I have learned an immense amount from you!!
• Lisa Parillo Chapman and LaShawnda McKinnon, Ph.D. students at NC
State: Thanks for giving me inspiration when I needed it, an ear to bend at
times, and always being my friend.
• My committee: Dr. Nancy Cassill, Dr. Tom Johnson (the best statistics
teacher of all time!!!), and Dr. Trevor Little: Your contributions were
directional and contributed to the successful completion of this work.
Karla P. Simmons v • Priya Devarajan and Dr. Hoon Hong: For your invaluable assistance in
the programming of code for these software.
• Textile/Clothing Technology Corporation: A special thanks to David Bruner
and the R&D staff for their support, guidance, and assistance in my work
and also for developing the best 3D body scanner on the market!!
• Dr. Cindy Istook, Associate Professor at NC State, mentor, and friend:
Thanks for always wanting me to be involved, keeping me informed, giving
me advice, coming to my defense/rescue, introducing me to body
scanning, and, last but not least, being my friend. This road has not been
easy and I can’t imagine it without you!
• My grandmothers, Iris Godwin Peavy and Elizabeth Mims Vail: To Mother
Vail, a home economics teacher, I wish that I had known you. But your
legend still left a mark on my life. To Granny, head sewing trainer at
Vanity Fair for 40 years, You were my inspiration. My life hasn’t been the
same since you left us. But your encouragement, love, and influence of
your gift of sewing has been burned into my heart. Your memory will live
forever.
• My family: The Simmons’ side (Blanche, Terry, Charlie, Annette, Blaire`,
Tyler) and the Peavy side (Daddy, Momma, Lisa, Laura, Craig, Ellen).
Thank you for the encouragement and understanding over the last few
Karla P. Simmons vi • Gill Simmons: My dear husband, thank you for your support,
encouragement, and love through this degree. I know it hasn’t been easy
being married to a “kid in college”!! I love you, my soulmate, Big Daddy!
• My Parents, Lester and Pat Peavy: I am who and what I am because of
the love between you two. Thank you for giving me solid roots,
unconditional love, discipline (when needed), a strong spiritual
background, your time and muscles (for many, many moves!), and your
hearts. I am truly blessed to have known you as parents and as friends.
• And lastly, to my Savior, Jesus Christ: Without you, my world would be
meaningless. I pray that you would continue to be a strong and visible
Karla P. Simmons vii TABLE OF CONTENTS
LIST OF FIGURES...XII
LIST OF TABLES ... XVI
CHAPTER 1: INTRODUCTION... 1
RESEARCH OBJECTIVES... 3
STUDY LIMITATIONS... 4
ASSUMPTIONS... 4
DEFINITIONS OF TERMS... 5
CHAPTER 2: LITERATURE REVIEW ... 7
FIT AND SIZING ISSUES... 7
HISTORY OF MEASUREMENT STUDIES IN UNITED STATES... 17
The U.S. Department of Agriculture Study by O’Brien and Shelton... 18
The Organization of CS215-58... 20
The Organization of PS42-70 ... 21
Current Standards for Female Clothing... 24
Junior Category ...24
Misses’ Category...24
Women’s Category...25
Suggested New Sizing Systems... 26
Karla P. Simmons viii
Early Physique Classifications... 28
Twentieth Century Contributions to Figure Typing ... 30
William Sheldon...30
Carter and Heath...41
Douty ...43
The photographic setup...44
Douty body build scale. ...46
Douty posture scale...47
Research using Douty’s scales. ...50
CAD Modelling ...51
FIGURE TYPE CLASSIFICATIONS BY PATTERN INDUSTRY... 52
THREE-DIMENSIONAL BODY SCANNING... 56
Textile/Clothing Technology Corporation (TC)2 Body Measurement System ... 60
History ...60
Body Measurement Systems (BMS) ...61
System Design ...62
SOFTWARE FOR BODY EVALUATION... 65
KNOWLEDGE MANAGEMENT... 66
CHAPTER 3: METHODOLOGY... 69
BODY SCANNING DATABASE DEVELOPMENT... 69
Subject Recruitment and Data Collection ... 69
Scanning Protocol ... 70
Karla P. Simmons ix
Measurement Procedure ... 72
Bust Circumference...72
Waist Circumference ...73
Hip Circumference...74
High Hip Circumference ...74
Abdomen Measure ...75
Stomach ...76
EVALUATION OF CURRENT SIZING STANDARDS... 76
Determining Percentage Difference ... 80
Determining Tolerance Difference... 81
Determining Weighted Tolerance Difference... 82
BODY SHAPE IDENTIFICATION... 85
SUBGROUP IDENTIFICATION... 86
CHAPTER 4: RESULTS ... 87
SUBJECT INFORMATION... 87
DATABASE DEVELOPMENT... 89
EVALUATION OF CURRENT SIZING STANDARDS... 90
Percentage Difference... 90
Tolerance Difference ... 92
Weighted Tolerance Difference ... 94
Best Fit for All Subjects ... 96
SHAPE SORTING AND SUBGROUP IDENTIFICATION... 97
Individual Shape Category Information ... 101
Karla P. Simmons x
Hourglass Shape...102
Bottom Hourglass...105
Top Hourglass ...109
Spoon ...111
Rectangle ...114
Diamond ...118
Oval ...119
Triangle ...123
Inverted Triangle ...126
CHAPTER 5: SUMMARY, IMPLICATIONS AND RECOMMENDATIONS... 128
SUMMARY AND IMPLICATIONS... 130
3D Database ... 130
Sample ... 130
Best Fit software... 131
Shape Sorting software ... 134
RECOMMENDATIONS... 137
REFERENCES ... 139
APPENDICES ... 157
APPENDIX A: CS 215-58, BODY MEASUREMENTS FOR THE SIZING OF WOMEN’S PATTERNS AND APPAREL, 1958 ... 158
Karla P. Simmons xi APPENDIX C: ASTM# D5585-95, STANDARD TABLE OF BODY MEASUREMENTS FOR
Karla P. Simmons xii LIST OF FIGURES
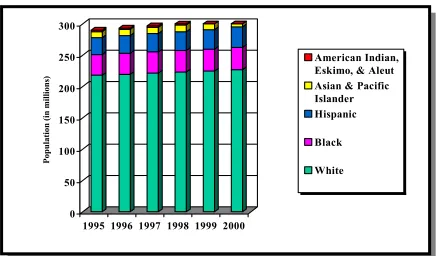
Figure 1. Population of the United States by race... 10
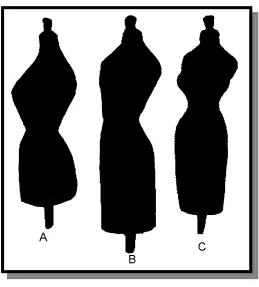
Figure 2. Dress forms illustrating changes in body shape from 1900 to 1950s. 11 Figure 3. Representation of a sizing system based on average values... 14
Figure 4. Representation of a sizing system based on “developed” or proportionate measures... 15
Figure 5. Two women of different shapes wearing the same size pantyhose.... 17
Figure 6. Illustration of Robinette’s anthropometric sizing system... 27
Figure 7. Graphical representation of a somatochart... 34
Figure 8. Photograph of a subject with a 1-1-7 somatotype ... 35
Figure 9. Photograph of a subject with a 4-4-4 somatotype ... 35
Figure 10. Photograph of a subject with a 7-1-1 somatotype ... 36
Figure 11. Locations of the 17 measurements in Sheldon’s study... 39
Figure 12. Photographic setup for Douty “graphic somatometry” method ... 45
Figure 13. “Posture-graph” and “Somato-graph” of a subject. ... 46
Figure 14. Douty scale of body build types... 47
Figure 15. Douty’s posture scale ... 48
Figure 16. Compostion of pattern industry figure types ... 53
Figure 17. Booth layout of the (TC)2 scanner ... 62
Figure 18. Patterned grating in the (TC)2 scanner. ... 63
Karla P. Simmons xiii
Figure 20. Segmentation of the body... 64
Figure 21. Printout available to subject... 64
Figure 22. Bust circumference by the (TC)2 body scanner. ... 73
Figure 23. Waist circumference by the (TC)2 body scanner... 73
Figure 24. Hip circumference by the (TC)2 body scanner. ... 74
Figure 25. High Hip circumference by the (TC)2 body scanner. ... 75
Figure 26. Abdomen circumference by the (TC)2 body scanner. ... 75
Figure 27. Stomach measure by the (TC)2 body scanner. ... 76
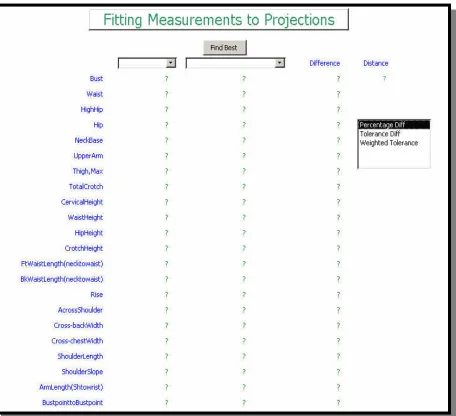
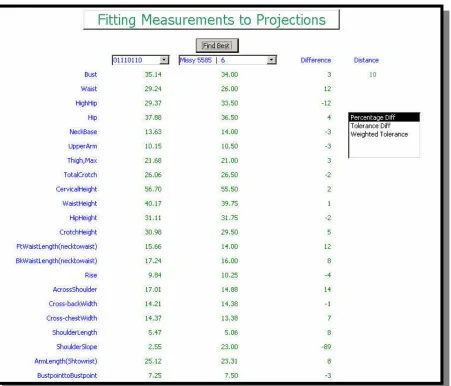
Figure 28. Template for the Best Fit program. ... 77
Figure 29. Percentage difference formula. ... 80
Figure 30. Example of percentage difference. ... 81
Figure 31. Example of a tolerance difference. ... 83
Figure 32. Example of a weighted tolerance difference... 84
Figure 33. Race frequencies for the 222 subjects. ... 87
Figure 34. Age frequencies for the 222 subjects. ... 88
Figure 35. Weight frequencies for the 222 subjects... 88
Figure 36. Height frequencies for the 222 subjects. ... 89
Figure 37. Standard frequencies using percentage difference. ... 91
Figure 38. Percentage difference frequencies. ... 92
Figure 39. Standard frequencies using tolerance difference. ... 93
Figure 40. Tolerance difference frequencies. ... 94
Karla P. Simmons xiv
Figure 42. Weighted tolerance difference frequencies. ... 96
Figure 43. Cluster analysis of shapes within the same category. ... 98
Figure 44. Shape categories by amounts. ... 101
Figure 45. Average age, height, and weight for each shape category... 102
Figure 46. Example of a true Hourglass shape, Subject #HgTrue... 104
Figure 47. Subjects in the Hourglass shape category superimposed on the example of a true Hourglass shape... 105
Figure 48. Example of a true Bottom Hourglass shape, Subject #BHgTrue. .... 107
Figure 49. An Hourglass body shape (black) superimposed onto a Bottom Hourglass body shape (yellow). ... 108
Figure 50. Bottom Hourglass shape comparison... 109
Figure 51. Comparison of the Hourglass, Bottom Hourglass, and Top Hourglass shapes. ... 111
Figure 52. Example of a true Spoon shape, Subject #SpoonTrue... 113
Figure 53. An Hourglass body shape (yellow) superimposed onto a Spoon body shape (black)... 113
Figure 54. Subjects in the Spoon shape category superimposed on the example of a true Spoon shape... 114
Figure 55. Example of a true Rectangle shape, Subject #RectTrue ... 116
Karla P. Simmons xv Figure 57. Subjects in the Rectangle shape category (yellow) superimposed on
the example of a true Rectangle shape (black). ... 117
Figure 58. Comparison of the Diamond and Oval shapes. ... 119
Figure 59. Example of a true Oval shape with a front and side view, Subject
#OvalTrue. ... 121
Figure 60. An Hourglass body shape (black) superimposed onto an Oval body
shape (yellow). ... 121
Figure 61. Subjects in the Oval shape category (yellow) superimposed on the
example of a true Oval shape (black) with front and side views... 122
Figure 62. Example of a true Triangle shape, Subject #TriTrue. ... 124
Figure 63. An Bottom Hourglass body shape (yellow) superimposed onto a
Triangle body shape (black)... 125
Figure 64. Subjects in the Triangle shape category (yellow) superimposed on the
example of a true Triangle shape (black)... 126
Karla P. Simmons xvi LIST OF TABLES
Table 1. Size Ranges for the CS215-58 Standard... 22
Table 2. Size Ranges in PS42-70... 23
Table 3. Classifications of Body Types... 31
Table 4. A Listing of Component Characteristics... 33
Table 5. 17 Measurements Used in Sheldon’s Study. ... 38
Table 6. Pattern Industry Figure Type Characteristics... 54
Table 7. Characteristics of Different Figure Type Terminology ... 55
Table 8. Comparison of (TC)2 Scanner Models, 2T4 and 2T4s. ... 61
Table 9. PROSOMAN Computer Program Description. ... 66
Table 10. Standards Included in Best Fit Program. ... 79
Table 11. Tolerances Used in the Best Fit Program. ... 82
Table 12. Weighted Tolerances for Each Measurement... 85
Table 13. Tally of Most Compatible Standards for Percentage Difference. ... 91
Table 14. Tally of Most Compatible Standards for Tolerance Difference... 93
Table 15. Tally of Most Compatible Standards for Weighted Tolerance Difference. ... 95
Karla P. Simmons 1 CHAPTER 1: INTRODUCTION
One of the most important goals of a garment manufacturer is to provide
the desired fit of their products for their specific consumers. While fit is often a
subjective process, it is always based on an identified set of measures.
Currently, clothing sizes are based on a biased study that is over 6 decades old.
The data, obtained from a volunteer sample which primarily included white
women, aged 18-30, from only 8 states, has been “massaged” over time to
attempt to “fit” the current population. This method of sizing does not conform to
the diversity of human shapes that currently exist in the United States.
Attempts to classify body shapes into analogous types, in order to
establish size standards, have resulted in the formation of several size
groupings. However, the industry as a whole has not adopted a single system of
clothing sizing. We know that manufacturers and retailers use their own sizing
systems as a marketing tool, convinced that this is a differential advantage of
their product for their market. However, most manufacturers would admit to their
frustrations at not being entirely successful in this endeavor.
Regardless of the sizing systems used, almost all are based on the myth
Karla P. Simmons 2 proportional ways. There are times in most persons’ lives that this is relatively
true. From birth to the age of about 15, the American population as a whole
tends to grow taller as it grows bigger around. Actually less than 2% of the
population truly fits the mold described by the mean of the entire population!
Additionally, the shapes and proportions of today’s American population differ
greatly from the shapes of the generations before.
These fit issues continue to be a growing concern. Consumers are not
happy with clothing that does not provide good and desirable fit. Regardless of
how one defines fit exactly, it must always start from basic human proportional
truths. We are currently ill equipped to do this successfully with many products.
This is a significant problem for retailers and manufacturers, alike.
New and improved technologies are now available that allow realistic
images of human bodies to be classified into categories that will better reflect the
differential proportions of the true American population. Mega-computing power,
three-dimensional body scanning, dimensional design programs, and
computer-aided-design software are allowing advances in the product development
process that will lead to a seamless technology of customized clothing and
ready-to-wear garments that can provide fit, as they have been designed to do.
Some attempts have been made to chart the body in two-dimensions but
they do not yield a satisfactory illustration of true body shape. There is currently
Karla P. Simmons 3 dimensionally. No attempts have been made to study body shapes and sizes
using the 3D body scanner.
Research Objectives
The objective of this research was to develop a methodology for
characterization of body types/forms that would more appropriately replicate the
diverse shapes of the American population. A computer model was developed to
compare data from three-dimensional (3D) body scans in order to categorize
individuals by those differences in body stance, proportions, and body angles
that are significant factors in the fabrication of apparel shapes, that fit the body
well.
Specific objectives included:
1. To develop a database of 3D body scan data, from a variety
of consumer markets, that includes both measurement data
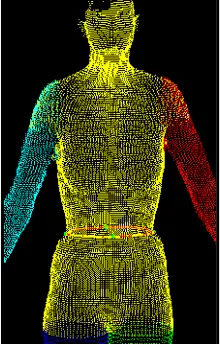
and 3D point cloud data.
2. To demonstrate that the current sizing system is insufficient
and to determine where significant deficiencies exist.
3. To utilize software that can take 3D data and “sort” it into
congruous and related shape categories (body or shape
sort) based on measurements, proportion, and shape.
4. To develop preliminary subgroups for the female population
Karla P. Simmons 4 Study Limitations
This study was limited by the following factors:
1. The data was obtained from a convenience sample from the Triangle
Area (Raleigh, Cary, Durham) of North Carolina. No attempt was
made to randomize the selection of the sample. The only criterion
was that the subject be female and over the age of 18.
2. The data was obtained using the technology of 3D body scanning
developed at [TC]2 as the method of shape and measurement
extraction.
Assumptions
This study was conducted on these basic assumptions:
1. The (TC)2 3D body scanner, with its measurement extraction software,
is accurate in obtaining body measurements plus or minus 1/8”.
2. Body scanning in 3D is more accurate than physical measuring
methods. It is also more private and more expedient. Therefore, most
people would choose to be scanned, in complete privacy, instead of
having someone take anthropometric measurements with a tape
Karla P. Simmons 5 Definitions of Terms
Three-Dimensional (3D) Body Scanning: The use of a light source (laser, white
light or other type) to capture the image of the body in the three dimensions
of x, y, and z (width, height, and depth) ([TC]2 , 2000).
3D Point Cloud: The raw, individual x, y, and z coordinates without any
smoothing or other post-processing (David Bruner, head of R&D at [TC]2,
personal communication, 1999).
Phase Measurement Profilometry (PMP): A 3D scanning method which employs
white light to impel a two-dimensional patterned grating on the surface of the
body. The grating is shifted preset distances in the direction of the varying
phases and images are captured in each position (for each of the four
sensors) ([TC]2 , 2000).
Measurement Extraction Profile (MEP): The file that designates how each
measurement is taken on the body (David Bruner, head of R&D at [TC]2,
personal communication, 1999).
Reduced Body Data (RBD): Data that has been filtered of any stray points,
smoothed to remove low level noise in the scan data, closed of any small
gaps in the scan data and compressed, on the order of 100:1, to achieve a
very "light", yet fully defining data set. In the [TC]2 system, RBD data
includes information about the trunk and limbs of the body, differentiating
each by color (David Bruner, head of R&D at [TC]2, personal communication,
Karla P. Simmons 6 Extracted Measurement Data: Measurement data that has been derived from the
segmented body and limbs (arms, legs, torso) (David Bruner, head of R&D
at [TC]2, personal communication, 1999).
American Society of Testing and Materials (ASTM): Now formally known as
ASTM International, this not-for-profit organization provides a global forum
for the development and publication of voluntary consensus standards for
materials, products, systems, and services (ASTM, 2002).
Karla P. Simmons 7 CHAPTER 2: LITERATURE REVIEW
Literature was reviewed in the areas of fit and sizing issues, the history of
measurement studies, the history of figure typing and somatotyping,
three-dimensional body scanning, software for evaluation of the human body, and
information concerning knowledge management and its role in decision making.
Fit and Sizing Issues
The purpose of a sizing system for apparel should be to make available
clothing in a range of sizes that fits as many people as possible (Ashdown, 1998;
LaBat, 1987). Apparel design and production experts believe that the fit of a
garment is one of the most important factors in producing garments that flatter
the individual (Minott, 1978). Fit has been defined as:
• ..”A correspondence in three-dimensional form and in placement of detail
between the figure and its covering to suit the purpose of the garment, to
provide for activity, and to fulfill the intended style” (Berry, 1963, p.314).
• ..”Simply a matter of length and width in each part of the pattern being correct
for your figure” (Minott, 1978, p.43).
A significant amount of research has been conducted on the topic of fit of
apparel for the general population (AAMA, 1975; Croney, 1977b; Green, 1981;
O’Brien and Shelton, 1941; Salusso, Delong, and Martin, 1979). In general,
consumers have been dissatisfied with fit for some time. In a 1983 study,
consumers did not buy an item because of incorrect fit or a too high cost 80% of
Karla P. Simmons 8 women were willing to trade styling options, time, and money for sizing and fit
options in their career apparel (1987). In 1996, a Kurt Salmon Associates study
for the Textile/Clothing Technology Corporation (TC)2 revealed that over half of
all American consumers were unable to find ready-to-wear garments that fit them
properly. DesMarteau (2000) reported that this study found 50% of women and
62% of men cannot find a good fit in apparel.
Some of this dissatisfaction could be associated with the fact that the
current sizing system for the manufacturing of garments is based on body
measurements that are more than 60 years old (Salusso-Deonier, 1982).
Dissatisfaction with fit can also be attributed to several factors that have changed
the average body types: diets (Meek, 1994; Tamburrino, 1992a, 1992b), physical
exercise and activities (LaBat, 1987; Tambarrino, 1992a, 1992b), increased
immigration (Meek, 1994; Tamburrino, 1992a, 1992b), disproportionate growth
rates in minority groups (Meek, 1994), sedentary lifestyles (CNN, 2001; LaBat,
1987), and changes in ideals of masculinity and femininity (Meek, 1994).
The United States has been called the “fattest country in the world” (Time,
1999) with 54% of the population overweight. Forty million adult Americans
weigh more than 20% above their desirable weight (Blumenkrantz, 2001).
Obesity has increased 60% in the last 10 years (CNN, 2001). Yet, in a 1992
study, a reported 65 million people in the United States, about 25% of the
population, were dieting at any one time (Evans, 2000). The diet industry,
Karla P. Simmons 9 Takes Hit”, 2000; Evans, 2000; Pace Group Exercise, 2000; Time, 1999). An
estimated 60% of the domestic population has expressed interest in losing
weight and/or keeping it off (Kroll, 1997).
Dieting, whether on a consistent or inconsistent basis, can lead to bad
dieting habits. The Healthy Eating Index showed that 88% of Americans have
diets that are poor or need improvement (President Clinton, 2000). With over
half of the country’s population overweight and dieting, figure shapes are
constantly changing. Extra body weight and constant fluctuation in body shape
because of dieting have made the figure types of the current standard, a variation
of a 1941 study, not applicable to the figure types of today.
Physical fitness is another area that is changing the current figure types.
The fitness industry, including health clubs, exercise videos, and clothing, is
worth about $43 billion (Evans, 2000). But, there seems to be a definite divide
on this issue. Even though the fitness industry seems to be booming, the
predominance of a sedentary lifestyle is also rising. More than 60% of adults do
not engage in the recommended amount of physical activity (President Clinton,
2000) and about 25% of all adults, along with 14% of today’s youth, get no
physical activity at all (Johnson, 2001; President Clinton, 2000).
The United States population distribution has gone through dramatic
physiological and demographic transformations since the 1940s when the
O’Brien and Sheldon study (which our current sizing system is based on) was
Karla P. Simmons 10 magnitude that is unmatched to any previous period in human history. During
the 1998-2025 time period, it is predicted that the world’s elderly population (over
65 years) will more than double while the world’s youth (under age 15) will grow
by 6% (McDevitt, 1999).
Figure 1. Population of the United States by Race. (U.S. Census Bureau, 2001).
For many years, the United States population has been a mixture of ethnic
origins, as seen in Figure 1. But over time, the configuration of this mixture has
changed. Minority groups have become larger and new groups of immigrants
have been added to the mixture (LePechoux, 1998). With consumer trends and
products becoming universal, free trade is opening an increasing number of
foreign markets to U.S. commerce. Worldwide interaction and travel are heading
toward increased interracial mixes. These progressions have had direct impact 0
50 100 150 200 250 300
Population (in millions
)
1995 1996 1997 1998 1999 2000
American Indian, Eskimo, & Aleut Asian & Pacific Islander
Hispanic
Black
Karla P. Simmons 11 on body measurements of the international consumer. Many studies have
researched the idea that body proportions differ according to their racial origin
(Abesekera & Shahnavaz, 1989; Al-Haboubi, 1992; Hertzberg, 1972;
Hutchingson, 1981; Miller, 1993; NASA, 1978). The racial mixture in the United
States is also different from that in the 1940s, which is the time frame that our
current body measurement standard is based on. An illustration of how basic
body shapes have changed can be seen in Figure 2. Dress form A is one at the
turn of the century. Form B is one that was used in the 1920s flapper period.
Dress form C denotes a shape change with the 1950s Dior “new look” (Palmer &
Alto, 1998).
Karla P. Simmons 12 Fit of apparel is a significant problem for retailers, manufacturers, and
consumers. The ability to fill the needs of niche markets with high quality, well
fitting apparel is the key to the survival of the apparel industry within its current
competitive tone. In a 1925 article on the standards in clothing manufacturing,
size standardization was being reasoned for the outcome of “better-looking,
neater-fitting clothes and elimination of alterations” (Saum, 1925, p.59). This was
15 years before the O’Brien and Shelton study from which clothing sizing
standards have been issued. These topics are some of the very complaints that
are being heard today.
There is a growing need for an updated anthropometric sizing system for
women (Delk & Cassill, 1989; LaBat, 1987). It has been recommended that body
measurement charts be revised at least every 10 years (Brunn, 1983).
Chun-Yoon and Jasper (1995) recommended an anthropometric size description
system as a solution to the problems of high return rates caused by consumers
purchasing the incorrect size and damaged goods caused by frequent trying-on
of garments. Cyclic changes in diet, activity, lifestyle, and immigration influence
the size and shape of American consumers of clothing which makes updating
sizing systems essential.
The ideal figure of the 1940s was the hourglass shape and, therefore, all
women’s size specifications were developed to fit that hourglass shape. In a
recent study by Gray (1998), the shape of women has changed from hourglass to
Karla P. Simmons 13 Yet another issue about fit is the concept of vanity sizing. In a recent
study, Workman (2000) pointed out that manufacturers have redefined their fit
models. The standards measurements for a size 10 fit model in 1986 are now
the standards for a size 8 fit model. The shape is, however, still the hourglass
shape. Each manufacturer defines fit for their own specific target market and all
manufacturers differ. Fellingham (1991) described that a size 8 fit model
weighing 115 pounds and being 5’8” tall has the body measurements of 36-24-34
(bust circumference, waist circumference, hip circumference respectively). The
fit model tried on six different size 8 sheath dresses with a remarkable difference
in fit among them all, showing that there is a lack of consistency in defining even
one size of clothing. Most clothing manufacturers are reluctant to conform to a
unified standard set of body measurements (Belkin, 1986). Having a sizing
system that is a little different than others is thought to be a competitive
advantage. All in all, research clearly indicates that a problem with
standardization of sizes exists.
Manufacturers have created their sizing systems around a size Medium,
the “perfect size 8”, or a specified size model. All of these terms represent an
average value for a set of dimensions relevant to a specific garment. The size
Medium is then scaled up or down to create a whole range of sizes. But, the
shapes of people usually do not calculate to be scale models of each other.
Daniels (1952) graphically illustrated that no one is average in all body
Karla P. Simmons 14 blocks have only three variables to its dimensionality, height, length, and width.
Human bodies have many curves and are much more complicated. These
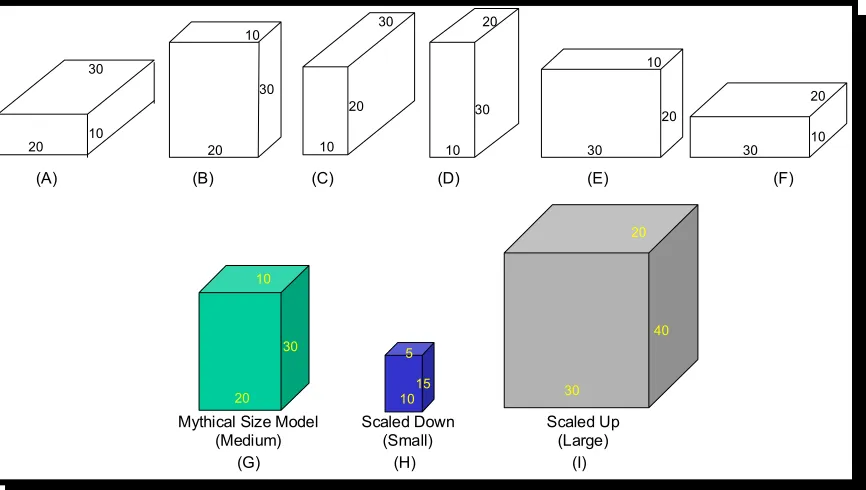
blocks are not based on true three-dimensional shape. Figure 3 represents a
three-size system where a size Medium is based on average values. Block G is
the Medium, Block H is scaled down to a Small, and Block I is scaled up to a
Large. Blocks A through F represent the different shapes of people. A cover
made for Block G would not be large enough in one dimension to fit any of
Blocks A through F. In scaled up Block I (Large), a cover would fit Blocks A
through F but would be too large in 2 of the 3 dimensions.
Figure 3. Representation of a Sizing System Based on Average Values. (Daniels, 1952).
Figure 4 represents a size Medium being based on the dimensions of a
selected person that typifies some predetermined criteria for a manufacturer. In 30
20
10 30
20 10 20
10 30 10 20 30 10 30 20 30 10 20 20 20 20 10 10 10 30 30 30
(A) (B) (C) (D) (E) (F)
(G) (H) (I)
Karla P. Simmons 15 this size model method of sizing, Block G (Medium) would only fit a block like
Block G. Block H (scaled down Small) would not fit any of the Blocks A through
F. The scaled up Large (Block I) will fit Blocks B, D, E, and F but with a 30 unit
gap in one place or another.
Figure 4. Representation of a Sizing System Based on “Developed” or Proportionate Measures.(Daniels, 1952).
Another illustration of fit is within the pantyhose industry. The National
Association of Hosiery Manufacturers (NAHM) published a set of recommended
sizing standards in the 1960s which are still being used today (NAHM, 1991).
Pantyhose size is determined on a height/weight based grid. Height is charted in
increments of 1 inch and weight in increments of 5 pounds. The number and
ranges of sizes are decided by the manufacturers using judgement based on
their own experience (NAHM, 1970). The NAHM developed regression
Mythical Size Model (Medium) Scaled Down (Small) Scaled Up (Large) 20 10 30 30
20 10 10
20 30 10 30 20 30 10 20 10 5 15 20 40 30
(A) (B) (C) (D) (E) (F)
(G) (H) (I)
Karla P. Simmons 16 equations which are functions of height and weight values from which other
dimensions can be estimated. Their recommendations include deriving the
dimensions that pantyhose are required to fit from this set of regression
equations. The surface areas for each height and weight combination have been
calculated and used to identify size groupings on a chart.
There are limitations to this sizing system. First, the sizing standards are
based on outdated body measurements of women. Second, the regression
equations are univariate. Regression equations for height are only related to
stature while those for girths are only related to weight. Third, one single set of
regression equations many not work for all sizes An example is leg surface
areas. These regions which are calculated according to these regression
equations do not reflect the within size variations of dimensions and proportions
(LePechoux, 1998). Figure 5 shows how two women with very different shapes
now fit into the same pantyhose size. Woman A, on the left, is 5’6” and weighs
Karla P. Simmons 17 Figure 5. Two Women of Different Shapes Wearing the Same Size
Pantyhose.(Early, 1998).
History of Measurement Studies in United States
Early sizing systems for women were developed in the late nineteenth
century by professional dressmakers, tailors, and draftsmen (Ashdown, 2000;
Kidwell, 1979; Labat, 1987). They had very individualized techniques of
measuring and fitting their clients.
Limited styles and sizes of ready-to-wear were prevalent in the early
1900s. The loose fitting styles of the 1920s generated elevated consumer
demand for the mass production of ready-to-wear (Salusso-Deonier, 1982).
This, in turn, spawned a need for standard sizes among different manufacturers
(Nystrom, 1928). Nystrom (1928) found that a blouse size 36 had a large
amount of variation of measurements among different brands. He also
recognized that consumers were dissatisfied with ill-fitting garments and retailers
were dissatisfied with the expense involved in the alteration department and with
garment return. However, the fashion of the 1930s brought about tighter-fitting
Karla P. Simmons 18 clothing that augmented confusion of sizing systems and labeling practices. This
caused an enormous amount of variation between the individual manufacturers.
At the time, mail-order houses were very popular and were becoming very aware
of this problem. They were having a large number of returns because of ill-fit
(O’Brien & Shelton, 1941).
The U.S. Department of Agriculture Study by O’Brien and Shelton Prompted by numerous product returns, the Mail Order Association of
America (MOAA) furnished the impetus for a sizing survey which was viewed as
providing a solution to inconsistent sizing. The U.S. Department of Agriculture
sponsored an anthropometric survey that was to become the basis for the
development of several sizing systems for women’s apparel. Designed and
implemented by Bureau of Home economics specialists O’Brien and Shelton, the
survey was conducted by the collaboration of Federal and state work project
administrators and various educational institutions. No scientific study of the
measurements of the human body used to construct women’s clothing had ever
been reported (O’Brien, 1930). The 1939-40 survey consisted of 59
measurements taken on 10,042 women. Although the sample was large, it was
biased by being unrepresentative of the female population. The women were all
white, between the ages of 18 and 30, from only 8 states, and all volunteers
(O’Brien & Shelton, 1941). As White (1978) suggested, women who were not
happy with their body shape were unlikely to volunteer for a process that required
Karla P. Simmons 19 The study’s primary objective was to provide data from which the garment
and pattern industry could develop a sizing system acceptable to consumers
(O’Brien & Shelton, 1941). Several sizing systems were suggested that were all
based on the proportionate sizing theory. Proportionate sizing assumes that
human body forms develop in accordance with common proportional rules. One
control dimension is therefore believed to be adequate to project all body
dimensions needed in sizing apparel. An example of a control dimension would
be the height or weight of an individual. The entire size range was created from
the extension of one size by incrementing control dimensions and projecting
proportionate increments for the other dimensions.
O’Brien and Shelton found in their study that the best foundation for
classifying women’s body types for the organization of a standard system of
garment and pattern sizes was a stature-weight combination (1941). However,
the study also pointed out that if a girth or weight measurement were used as a
control, virtually no variation in heights would be allowed. The short women and
the tall women would have inadequate fit for their garments (O’Brien & Shelton,
1941).
Alternative systems where weight could not be used as a control
measurement were also suggested: 1) Stature and Bust Girth, 2) Stature and
Waist Girth, 3) Stature and Abdominal Extension Girth, and 4) Stature and Hip
Girth. A disadvantage warned by the researchers of these alternate systems
Karla P. Simmons 20 as a foundation for the sizing increases too rapidly in relation to the increases in
other measurements. O’Brien and Shelton (1941) suggested that if one of the
girth measurements must be used, then a third dimension should be added to the
sizing system. This could be accomplished by the addition of the “Stouts” and
“Slims” categories to the other length categories of “Regulars”, “Longs”, and
“Shorts”.
Results of the data collection were to operate as the basic background for
inventing a sizing standard. It was published by the U.S. Department of
Agriculture as a miscellaneous publication entitled Women’s Measurements for
Garment and Pattern Construction (O’Brien & Shelton, 1941).
The Organization of CS215-58
It wasn’t until the 1950s, after further analysis of the 1939-40 data and
another request from the MOAA for a sizing standard, that a standard was
proposed. A public review in the fall 1954 mail order catalogs lead to industry
and consumer endorsement in 1958. This voluntary standard was published by
the National Bureau of Standards (NBS) as CS215-58 titled Body Measurements
for the Sizing of Women’s Patterns and Apparel (U.S. Department of Commerce,
1958). As a voluntary product standard, the CS215-58 could be acknowledged,
discarded, or revised in part or in total by each individual apparel manufacturer.
The CS215-58 identified four classifications of women and covered nine
different body types. The four classifications of women included “Misses’”,
Karla P. Simmons 21 “Tall”, “Regular”, and “Short”. Three hip types were recognized as “Slender,
“Average”, and “Full”. The bust was the same for all of the groups. This yielded
a three-way system of the size number (based on the bust measurement), the
height group, and the body type (based on the bust-hip relationship) (US
Department of Commerce, 1958). An example of the system would be 14S+.
This designation would mean a size 14 bust, short in height, and a full hip type.
A complete listing of the size ranges for each of the four classifications is covered
in Table 1. The revision of CS215-58 was published in 1970 as PS42-70, Body
Measurements for the Sizing of Women’s Patterns and Apparel (U.S.
Department of Commerce, 1970).
Problems did exist with the CS215-58 standard that were credited to the
25 year old data which represented obsolete and outdated body proportions
(Salusso-Deonier, 1982). At the persistence of the MOAA, the NSB brought
about procedures for revising CS215-58.
The Organization of PS42-70
The only available data at the time were health surveys made in 1960-62
by the United States Public Health Service (Stout, Damon, McFarland, &
Roberts, 1965). The studies followed a census plan and were thus
representative of the population. Measurement included height, weight, several
girths and diameters that were satisfactory to suggest general size but not to the
shape differences (White, 1978; Stout et al, 1965). Because the 1939-40 study
Karla P. Simmons 22 Table 1. Size Ranges for the CS215-58 Standard. (US Dept. Commerce, 1958).
Misses Regular Height (R)
Misses Tall Height (T)
Misses Short Height (S)
Hip Type Sizes Hip Type Sizes Hip Type Sizes Average 8 to 22 Average 10 to 20 Average 8 to 18 Slender(-) 10 to 22 Slender (-) 12 to 18 Slender (-) 12 to 18 Full (+) 8 to 16 Full (+) 10 to 14 Full (+) 8 to 12
Women’s Regular Height (R)
Women’s Tall Height (T)
Half-Sizes Short Height (S)
Hip Type Sizes Hip Type Sizes Hip Type Sizes Average 30 to 42 Average 32 to 40 Average 10 ½ to 24 ½ Slender (-) 32 to 42 Slender (-) N/A Slender (-) 12 ½ to 22 ½ Full (+) 28 to 38 Full (+) 30 to 36 Full (+) 8 ½ to 20 ½
Junior
Regular Height (R)
Junior Tall Height (T)
Junior Short Height (S)
Karla P. Simmons 23 adult population, it was again used as a base for the revision process
(Salusso-Deonier, 1982). The revision of CS215-58 was published in 1970 as PS42-70,
Body Measurements for the Sizing of Women’s Patterns and Apparel (U.S.
Department of Commerce, 1970).
The health surveys of 1960-62 determined that adults were somewhat
taller and heavier than those of 1940 (Stout et al, 1965). This prompted a
change in the size designations for females particularly in the PS42-70. Because
the bust girth was a crucial measurement in the old and the new data, the bust
girth was increased by one grade interval per size code for all figure types. The
Misses and Junior figure types were also changed so that the hip girth was a
constant 2” interval where the old hip girth of the CS215-58 was increased
proportionately to bust girth as the size designation increased (Labat, 1987). The
“Slim” and “Full” hip options within all figure types were eliminated, as well as the
“Tall” option in the Juniors’ and Women’s figure types. Size ranges for each of
the classifications also changed. See Table 2 for a complete listing of size
ranges.
Table 2. Size Ranges in PS42-70. (U.S. Dept. of Commerce, 1970).
Juniors’ Juniors’ Petite Sizes: 3 to 17 Sizes: 3P to 15P
Misses’ Misses’ Petite Misses’ Tall Sizes: 6 to 22 Sizes 8P to 18P Sizes: 10T to 22T
Women’s Half-Sizes
Karla P. Simmons 24 Within the CS215-58 standard, the Juniors’ proportions were smaller than
Misses’ by ½ inch at the Bust, 1 inch at the Waist and Hip Girths, and 1/8 inch in
the Back Length. Within the PS42-70 standard, for the same Bust size code, the
Misses’ and Juniors’ categories continue alike except Juniors’ were assigned an
even shorter Back Length. Sizes incorporated would span a bust range of 31½
to 44 inches. Changes in the dimensions of Women’s sizing from the CS215-58
to the PS42-70 were restricted to increasing Bust, Waist, and Hip Girths by 1
inch and Back Length by 1/8 inch. Half-size girths were changed as in Women’s
but Back Length remained the same (Salusso-Deonier, 1982).
Current Standards for Female Clothing Junior Category
For the Junior size category, there is no current standard. The most
recent body measurement tables are found in the PS42-70.
Misses’ Category
Since 1970, no new research has been completed for the Misses’ size
category that would update this body measurement information. The current
standard in the United States which lists body measurements of the adult female
figure type, sizes 2 through 20, is the American Society of Testing and Materials
(ASTM) standard # D5585-95. The Standard Table of Body Measurements for
Adult Female Misses Figure Type, Sizes 2-20 (1995a) publication was derived
originally from the PS42-70 database which was developed from the
Karla P. Simmons 25 Women’s Category
Current research was conducted at the University of Arizona in 1993 by
Reich and Goldsberry that represented body measurements of adult women
ages 55 and older. The ASTM publication # D5586-95 is entitled Standard
Tables of Body Measurements for Women Aged 55 and Older (All Figure Types)
(1995b). This research resulted from the inappropriate representation of the fit
concerns for women over 55.
Morris and Bader (1983) documented that aging was accompanied by
physical changes that took place gradually, at differing times and in varying
degrees. These physical changes included a decrease in stature due to changes
in the spine (Croney, 1977; Curtain, 1972; Kohn, 1978; Mezey, Rauchhorst, &
Stokes, 1980; Woodson & Horridge, 1990), thinning of weight bearing cartilage
(Woodson & Horridge, 1990), careless posture habits (Woodson & Horridge,
1990), increased in waistline and hips (Croney, 1977; Curtain, 1972; Kohn, 1978;
Mezey et al., 1980; Woodson & Horridge, 1990), and increases in weight
(Croney, 1977; Curtain, 1972; Kohn, 1978; Mezey et al., 1980; Woodson &
Horridge, 1990).
Norwood (1944) was the first to study the clothing problems that were
characteristic to elderly women. Only a few studies have been conducted that
concern the fit problems for these women (Brunn, 1983; Patterson & Warden,
Karla P. Simmons 26 women was the unacceptable fit of garments (Bader, 1960; Bartley & Warden,
1962; Ebeling, 1960; Hargeth, 1963).
Suggested New Sizing Systems
Several studies have attempted to create new sizing systems or to
suggest improvements to the current system but none have yet to be adopted by
the United States government as a standard. Gazzuolo (1985) developed a
theoretical framework for describing body form variation which could be useful in
creating a sizing system. Her research determined that a system based on
averages was inadequate. She proposed to limit the variance by sorting the
sample by special user groups or by sorting the sample by a major pattern-shape
variable. Visual analysis would be a crucial element in developing a standard
along with dimensional data.
Salusso-Deonier (1982) proposed a “Principal Component Sizing System”
(PCSS) with principal components of laterality and linearity. From an analysis of
body measurements of 1330 women, she concluded that a majority of the
sample could not achieve appropriate fit with the PS42-70 standard. She found
that her PCSS provided “good fit” for 90% of each sub-sample tested.
McCulloch, Ashdown and Paal (1998) proposed an optimization approach
to apparel sizing. Efficient sizing systems were defined based on a mathematical
model of garment fit. Nonlinear optimization techniques were then used to derive
a set of possible sizing systems using multidimensional information from
Karla P. Simmons 27 sizing systems that could either increase accommodation of the population,
reduce the number of sizes in the system, or improve the overall fit in
accommodated individuals.
Robinette (1986) derived an anthropometric sizing system that was based
on regression estimates from the largest stature and weight values of a sample.
The values selected for a given size represented only the people in that size
category and were not scaled up or down from other sizes. The key dimension
(height and weight) values were the largest for each category. The value of the
third dimension was the top of the range. To illustrate this system, the
three-dimension block example, mentioned previously, was used as in
Figure 6. Size X would fit Block A and Block C, Size Y would Fit Block E and
Block F, and Size Z would fit Block B and Block D. There would be a 10 unit gap
occurring in some blocks. This system would have the same number of sizes, all
of the blocks would be covered, and would be covered with less error than the
scaled Medium or the scaled size models.
Figure 6.Illustration of Robinette’s anthropometric sizing system. (Robinette, 1986).
30
20 10 10
20 30 10 30 20 30 10 20
(A) (B) (C) (D) (E) (F)
(X) (Y) (Z)
Karla P. Simmons 28 History of Figure Typing/Somatotyping
Early Physique Classifications
In the pre-Christian era, the Greeks dominated the scientific and
philosophical studies of the time. As early as 400 BC, the founder of modern
medicine, Hippocrates, had proposed that certain physical types were
susceptible to certain diseases (Wells, 1983). He described people with long,
thin bodies as habitus phthisicus and noticed that they were susceptible to
tuberculosis. Individuals with short, thick bodies were called habitus apoplecticus
(Hippocrates,1886) . These people were said to be susceptible to vascular
disease and apoplexy (Carter & Heath, 1990). In the fourth century BC, Aristotle
attempted to additionally elaborate and develop Hippocrates’ ideas (Tsang,
Chan, & Taylor, 2000). However, there would be many more years until further
studies were conducted on the differing types of human body forms.
Around the 17th century, anthropometry started to be used in combination
with morphology. At the University of Padua, Elsholtz documented a method for
taking body measurements. It would be two hundred years later before Quetlet
would be a pioneer in studying the measurements of man statistically (Carter &
Heath, 1990).
The physicians of the late 18th and early 19th centuries continued to
produce physique classifications following the blueprint of Hippocrates. Halle in
1797, with Rostan following in 1828, portrayed three types of physical structures
Karla P. Simmons 29 Sheldon, Stevens, & Tucker, 1940). In about 1880, another important
contribution to the study of human body classification was by Huter. He divided
people into three types: cerebral (prevailing with ectodermic1 composition),
musculen (prevailing with mesodermic2 composition), and digestive (prevailing
with endodermic3 composition). At the end of the 19th century, di Giovanni
conducted an extensive series of anthropometric studies at the University of
Padua. One of his students, Viola, distinguished three physical types. Large,
heavy bodies with short limbs were named macroplanchnic while those with
small trunks and long limbs were named microsplanchnic. An intermediate
typology was named normosplanchnic. As Viola himself points out, this
microsplanchnic is the old phthisic habitus, the macrosplanchnic is the
apoplectic, and the normosplanchnic is merely an intermediate variation (Viola,
1909). These findings corresponded closely with those of Hippocrates (Carter &
Heath, 1990).
The 20th century had the most significant contributions of any time period
before that concerning the figure typing and classifications of the human body. A
German psychiatrist, Ernst Kretschmer (1926), began important scientific studies
1 Ectodermic means the outermost of the three primary germ layers of an embryo
(Webster’s, 1987).
2 Mesodermic means the middle of the three primary germ layers of an embryo
that is the source of bone, muscle, connective tissue, inner layer of the skin, and other adult structures (Webster’s, 1987).
3 Endodermic means the innermost of the germ layers of an embryo that is the
Karla P. Simmons 30 in the early 1920s. His findings grouped the human body-build in four categories
very similar to those of di Giovanni: pyknic (extreme instinctive development and
extra fat), asthenic (thin, narrow, and light skeletal construction), athletic4, and
dysplastic ( a mixture of types). His bodily characteristics were, like those of
most early physicians, associated with particular disease susceptibilities. The
pyknic body type was linked with manic-depressives and the asthenic body type
was linked with schizophrenics.
Although Kretschmer was an experienced researcher, weaknesses were
evident in this methodology. His body type categories were somewhat extreme
which could only be appropriate for a minority of individuals. Also, aging was a
contributing factor to the slenderness or stoutness associated with his body types
that was overlooked. Schizophrenia occurred mostly in young people that tend
to be slender. Manic-depressives usually start their symptoms in the middle
ages when the metabolism in the body slows and fat deposits form (Wells, 1983).
Twentieth Century Contributions to Figure Typing William Sheldon
The most significant contribution to the existence of body type
classifications began in the 1930s by American psychologist William Sheldon.
He was a university professor and focused his research on the variety of human
4 In the later book editions, Kretschmer discarded the athletic type and relied
Karla P. Simmons 31 bodies and temperaments. In 1940, Sheldon, with Stevens and Tucker,
introduced the concept of “somatotype” in their book The Varieties of Human
Physique. “The patterning of the morphological components as expressed by
three numerals is called the somatotype” of the individual (Sheldon, Stevens, &
Tucker, 1940, p. 7). Sheldon remarked that the purpose was “to provide a
three-dimensional system for description of human physique” (Sheldon & Stevens,
1942, p.11). Table 3 lists the various classifications of body types by the many
sources mentioned in this study.
Table 3. Classifications of Body Types
Source Large frame & fat
Athletic Mixture of athletic and small frame
Small frame & thin
Hippocrates Habitus
apoplecticus phthisicus Habitus Halle Abdominal Muscular Thoracic Nervous,
cephalic Rostan Digestive Muscular Respiratory Cerebral Di Giovanni Third
combination combination Second (Plethoric)
First combination
(Phthisic) Huter Digestive Musculen Cerebral
Viola Macro-splanchnic
Normo-splanchnic
Micro-splanchnic Kretschmer Pyknic Athletic Leptosomic
Sheldon Endomorph Mesomorph Ectomorph
The original Sheldon study consisted of a sample of 4,000 undergraduate
male students aged 16-20. Equipment included a 35mm camera, controlled
Karla P. Simmons 32 frontal, dorsal, and profile views were taken of each nude subject posed in a
standard manner. Even though photographs were taken, negatives measuring
5”x7” were used for determining the measurements of the subjects’ bodies. The
researchers concluded that there were three primary components which when
combined together, make up all physiques or somatotypes. The categories of
body types were very similar to those of Kretschmer. However, Sheldon believed
that there were not just three clear-cut body types but mixtures of each of those.
He remarked that “Kretschmer’s attempt to handle human morphology with three
types is comparable to trying to build a language with three adjectives” (Sheldon
et al, 1940, p. 25).
Sheldon and his colleagues had worked out a system to measure these
components and express them numerically (“Inner Explorations”, 1999). These
components were called endomorphy, mesomorphy, and ectomorphy. A
thorough listing of characteristics of each component can be found in Table 4.
Briefly, the descriptions of each component are:
•
Endomorph – characterized by being round and usually soft, havingsomewhat little muscular development, and a light skeletal frame.
•
Mesomorph – characterized by massive skeletal development, heavybones, broad chest, and resilient muscles.
•
Ectomorph – characterized by frail skeletal frame, lightly boned,Karla P. Simmons 33 Table 4. A Listing of Component Characteristics
Endomorph Mesomorph Ectomorph
Body Round & soft. Mass concentrated
in abdominal area. Smooth contours without projecting
bones. High waist.
Square & hard. Chest area dominates over abdominal area. Narrow & low
waist.
Ribs are prominent. Shoulders droop.
Arms & Legs Short & tapering. Well-developed. Long & weak. Hands & Feet Comparatively
small.
Heavy & massive. Small & nonprominent
joints. Skin Soft & smooth. Thick & coarse. Dry & thin. Head Large in size.
Tendency for premature balding. Spherical in shape.
Prominent bones & muscles. Cubical in shape.
Long & slender neck. Small in size. Small features.
Face Broad.
Features of roundness.
Square & heavy jaw.
Clearly defined cheek bones. Long & broad in
shape.
Sharp & fragile features. Triangular in
shape.
Receeding jawline. Skeletal
Frame Light. Massive. Frail.
Muscular
Development Relatively little. Well-defined. Slight.
Each component was rated on a scale of 1-7 where 1 referred to the
minimum and 7 referred to a maximum. Components are always listed in the
sequence of endomorph, mesomorph, and ectomorph. An example would be a
1-4-7 individual who has almost no endomorphic development, an average
Karla P. Simmons 34 somatotypical ratings were then charted on a two-dimensional diagram to
graphical represent the rating. An example is shown in Figure 7. Figure 8,
Figure 9, and Figure 10 how a graphical depiction of a true ectomorph with a
1-1-7 somatotype, a true mesomorph with a 4-4-4 somatotype, and a true
endomorph with a 7-1-1 somatotype, respectively.
Figure 7. Graphical representation of a somatochart. (Sheldon, W.H. 1949, p.16) The study began by dividing the body into five regions: (1)head, face, and
neck, (2) chest area, (3) arms, shoulders, and hands, (4) abdominal trunk, and
(5) legs and feet. A framework was established for the scaling of the three
components. Fifteen values of ascending series would be made with the value of
one component in one body region. The value of the component (endomorphy,
Karla P. Simmons 35 comparison in evaluation of the component checklist of characteristics (Sheldon
et al, 1940). No anthropometric or other measuring devices were used to
determine the value of these components.
Figure 8. Photograph of a subject with a 1-1-7 somatotype.(Sheldon, 1954, pg. 39)
Karla P. Simmons 36 Figure 10. Photograph of a subject with a 7-1-1 somatotype.(Sheldon, 1954, pg. 325)
Weight and height were taken on all of the subjects whose photograph
was taken. In determining a technique for accurately measuring these subjects
from photographs, Sheldon described the method as:
Karla P. Simmons 37 The researchers could read 120 measurements per hour with less than 1
percent disagreement of the measurements. Sheldon remarked this was only
true in diameters of specific and clearly noticeable landmarks. He also claimed
that this accuracy could be achieved “after a few hours of practice” (1940, p. 51).
Yet, in another instance, Sheldon claimed that the accuracy “depended on the
training and experience of the investigator which had a minimum requirement of
a medical course in anatomy and years of training in physical anthropometry”
(1940, p.100).
All of the measurements were expressed as simple ratios to stature. The
seventeen measures used are listed in Table 5 and can be seen in Figure 11.
These measurements were selected by trial and error. They were originally
included in the study because of their photographic availability and reliability.
They were kept in the study because they produced fairly sharp and constant
differentiation among the physiques (Sheldon et al, 1940).
Sheldon summarized his photoscopic somatotype method as follows:
1. Calculation of height/√3weight ratio (HWR).
2. Calculation of ratios of 17 traverse measurements (taken from
photographic negatives) to stature.
3. Inspection of the somatotype photograph, referring to a table of known
somatotypes distributed against the criterion of HWR, comparing the
photograph with a file of correctly somatotyped photographs, and
Karla P. Simmons 38 4. Comparison of the 17 traverse measurement ratios with a range of scores
for each ratio, to give a final score (Carter & Heath, 1990, pg. 32).
Table 5. 17 Measurements Used in Sheldon’s Study. (Sheldon et al,1940, p. 54-57).
Region 1 Region 2 Region 3 Region 4 Region 5 FB1 Facial-Breadth-One TB1 Trunk-Breadth-One ATU Arm- Thickness-Upper TT2 Trunk- Thickness-Two LTU1 Leg-Thickness-Upper-One FB2 Facial-Breadth-Two TT1 Trunk-Thickness-One ATL1 Arm- Thickness-Lower-One TB3 Trunk- Breadth-Three LTU2 Leg-Thickness-Upper-Two Ntap Neck- Thickness-Anteroposterior TB2 Trunk-Breadth-Two ATL2 Arm- Thickness-Lower-Two TT3 Trunk- Thickness-Three LTL1 Leg-Thickness-Lower-One NTt Neck- Thickness-Transverse LTL2 Leg-Thickness-Lower-Two
Sheldon believed that a person’s somatotype never changed as they grew
older. They would only vary in relative thinness or fatness around the same
somatotypical rating (Sheldon et al, 1940). He was also very confident of the
reliability of his inspectional judgement in the somatotyping of the photographs.
These ideas brought about criticism toward Sheldon. Carter and Heath (1990)
maintained that “the procedure (of somatotyping) was laborious and obviously
not feasible for general use” (p. 31). Tanner (1964) said “this system does not