Anomaly Detection Using Context-Based Intrusion
Detection System
Rupali Garje, Shrawani Bharati, Prakriti Kar, Vaibhav Khatavkar
Department of Computer Engineering, College of Engineering, Pune,
Maharashtra State (India)
Abstract - Intrusion Detection System(IDS) is a software or device which checks the network or the host for tasks which may be harmful or tasks which violate policies of the system or the network. The intrusion can be signature based or anomaly based. This paper is regarding the anomaly based approach. In the anomaly based approach, the IDS studies the regular activities of the system and prepares a normal profile of the system. Anything which varies from the normal recorded profile is considered as an attack. Intrusions can come through the network or through the host itself. We have used the 10% KDD CUP ’99 Labelled Data set for studying the normal profile during the training phase. Then we have used a data set without the labels in the testing phase for checking the anomalies. For determining the nature of a data packet, we have found the Euclidean distance from the threshold for each and then decided the nature of each packet from that. We have used the context-based intrusion detection in the implementation i.e all the data is not included in a single global profile, but there are separate profiles for separate contexts. Studies have shown that the accuracy rate of context-based profiling is much better than global-profiling and the false alarm rates are also much lower, as in the global profile various types of activities fall under a single profile leading to higher false alarms.
Keywords—Intrusion Detection System, Detection Rate, False Positive Rate, KDD CUP ’99 Data Set, Euclidean Distance.
1. INTRODUCTION
With the advent of the Internet and its huge growth and reach with each passing day, crimes using the Internet as a tool have also been on the increase. Developers and protectors of the Internet also are coming up with newer and more effective tools to combat the surge in crimes happening all over the globe. The tools aim both at prevention and then subsequent cures of the affected systems. Firewall is one of the tools which has been widely used for prevention. But with changing times, needs for more dynamic crime or intrusion detection have led to the creation of Intrusion Detection System. Intrusion as we know is the act of illegally entering or seizing someones possessions. In the cyber world, Intrusion Detection System or IDS is a device or software application that monitors network or system activities for malicious activities or policy violations and provides the reports to a management station.
A. Types of Intrusion Detection System(IDS)
In today’s world, many types of IDSs have come up. Following are the main categories in which they can be divided:
1) Network-Based Intrusion Detection System(NIDS): A
network intrusion detection system looks out for malicious events which could be an intrusion in disguise, by monitoring traffic on a network. In addition to monitoring network traffic, it also scans system files to look for any unauthorised activity there and to maintain data and file integrity. While doing this it is capable of finding alterations in the basic components of the system. It is also capable of checking file logs of servers to find out any dangerous traffic or unlawful ways of using that are not safe for the system. It can also do a proactive role wherein it checks the local firewalls or for possible violation of rules or oversees running traffic to find out the accurate scenario. The advantage of NIDS is it is very straightforward to apply and to deploy. It also keeps a constant eye on the network of any system and thus provides constant monitoring. The NIDS is also less costly to install, as it is installed on a particular segment which covers all the sections in that network segment. It also provides real-time detection of the intrusion i.e. the intrusion happening is immediately detected so that the attacker does not get much time to back out or cover his traces. The disadvantage is, an NIDS is an easy target of a DOS attack. Also, sometimes it generates and collects a huge number of alerts or intrusions per day and thus sometimes unnecessarily burdens the system. It should be noted that a NIDS server can’t work in place of basic security systems like firewall or checking the user identity. 2) Based Intrusion Detection System(HIDS): A Host-Based Intrusion Detection System (HIDS) keeps a watch on the systems where they are currently working, finds out attacks or vulnerabilities, and accordingly notifies the required people in charge. An HIDS is capable of working as a mediator who oversees and checks if anyone manipulates the rules and tries to go by bypassing the network or host rules[1]. HIDS agent does the above job by monitoring the adjustments already done on the system, like critical system files (/etc/passwd), registry settings, file checksum, or any such similar parameter. When the machine is under attack, the agent obstructs the contact required, takes a note of the current audits of the running session, notifies the person or device who is responsible and then finally notifies the main authority about the incident. In HIDS normally all the traffic is deciphered, so if the traffic is in encrypted form, then also it can be checked.
2. KDD CUP ’99DATA SET
computer network and protects it from unauthorized users, including sometimes insiders too. Further the main work of the detector is to properly segregate the intrusions from the normal incoming traffic and notify accordingly. MIT Lincoln Labs was the preparer and manager of the 1998 DARPA Intrusion Detection Evaluation Program to do further studies and specifications in intrusion detection. The input traffic given to this intrusion checker system consisted of many various intrusions which were culminated by exposing them in military network environment. An emulation of the above data set was used in the KDD CUP ’99. Data was collected and given as input by monitoring the TCP dump data and emulating a general LAN of the Air Force. Various other types of attacks were incorporated to give multiple dimensions to the training data applied. Thus the credibility of the obtained output increased. In the KDD CUP ’99 Data set on counting we can come across 41 features. Each packet of incoming traffic has a particular value in the respective required column. We have used 10% of the complete KDD Data Set, as using the whole of it is not feasible owing to size and our PC configurations and limitations. Still the 10% data set has almost 4 lakh packets [5]. From [8] we can get the list of all the 41 features along with their type and name in the KDD CUP ’99 Data set.
A. Categories of Attacks:
• Denial of Service Attack (DoS): In this attack the system is overburdened with requests so that it almost hangs and fails to process the actual important and authentic requests. eg. Syn flood.
• User to Root Attack (U2R): In this intrusion the attacker tries to manipulate his way inside the system and tries to gain the root authorities by first posing as an outsider to the system. The ways of discretion used for gaining access are all varied and different.
• Remote to Local Attack (R2L): This type of intrusion is done by the intruder with the rights to send packets over a network. Further advantage of this authority is taken to manoeuvre and manipulate and try to gain access and take advantage wherever possible. e.g. Guessing password.
• Probing Attack: This type of attack is attempted by a professional who claims to avoid the security controls of a network and accumulates all possible information under this context. eg. Port scanning[3].
There are many sub-categories to the above four main attacks.Some of them are stated in Table I :
Category of attack Attack name DOS Neptune, Smurf, Pod, Teardrop, Landback
Probe Portsweep, IPSweep, Nmap, Satan
U2R BufferOverflow, LoadModule, Perl, Rootkit
R2L Guesspassword, Ftpwrite, Imap, Phf, Multihop, Warezmaster, Warezclient Table I : Sub Categories Of Attacks
3. PROPOSED SYSTEM ARCHITECTURE AND DESIGN A. Anomaly Intrusion Detection System
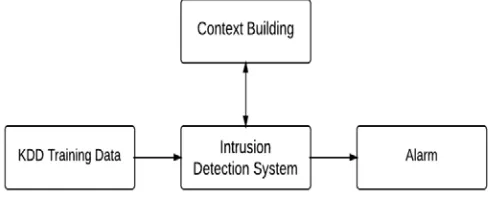
Fig. 1. A Simple Intrusion Detection System
In Anomaly-Based Intrusion Detection System global profile which contains the normal behaviour of traffic is taken. In coming traffic into the network is compared against the global profile, on the basis of result, incoming traffic is classified as normal or attack.
As shown in the block Figure 1 input traffic is given to IDS which shows the results whether it is normal traffic or attack.
B. Shortcomings of Anomaly-Based IDS
• High false positive rate.
• It is very slow in doing exhaustive monitoring and uses up a lot of resources.
To overcome these limitations we will use context based profiling method to build normal profile and global profile. Global profile is a single profile representation of all network traffic such as all protocols like TCP, UDP, ICMP etc and
Services like HTTP, DNS, ssh etc.
C. Context-Based Anomaly Intrusion Detection System
Context based anomaly includes two phases. First is context building and second one is using built context against incoming traffic. The two phases are called the training and testing phase. The block diagrams of the two phases are shown in Figures 2 and 3. The implementation has been done by context-based anomaly intrusion detection and hence the Figures 2 and 3 also represent the actual block diagrams for implementation.
Fig. 2. Training Phase
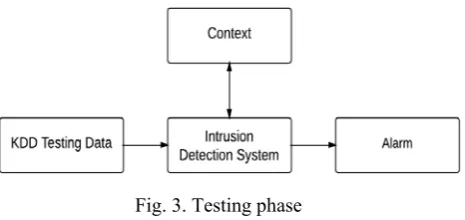
Fig. 3. Testing phase
In second phase, KDD Testing data is provided as a input to Intrusion Detection System. Built context data for testing is analysed against KDD testing data and results are shown whether it is normal or anomalous.
4. PROFILE BASED INTRUSION DETECTION SYSTEM A feature set contains various numerical variables or non-numeric variables. Non-non-numeric may be Boolean or symbolic.
To construct feature set following two cases are considered:
• In numeric feature set construction, two parameters are used, first is average and second one is standard deviation. Numeric features of normal profile are defined as ′= , . The μ and σ are features in training data.
• In non numeric feature set construction, frequencies of various possible values are used. The normal profile is defined as ′= = where = defined
as probability of = , for different values of i in training data.
• Anomaly scoring function is used for calculating the score for anomaly for analysed event. This function uses
two methods:
1. Set similarity method: This method find out the similar feature with respect to the same feature defined in normal profile.
2. Aggregation function: This function is defined for combining overall similar feature in a single anomaly score for finding out whether an event is normal or malicious.
How the given event deviates from normal profile is measured in terms of distance between event features and respective feature defined in normal profile. Deviation of features are aggregated using aggregation function to calculate the final anomaly score.
• Local distance calculation: For calculating local distance we need to compute deviation of available feature corresponding to feature ′ which is available in profile called normal profile. Values are made to fall in the range 0 and 1, so scaling problem is avoided. The calculation of local distance is shown in the equation as follow:
∀ , , ′ ∈ 0,1 Equation 1
Zero indicates negligible deviation that is more similarity and one indicates more deviation that is less similarity.
• To compute the distance for symbolic features, probability of values of in training data set is
incorporated. Assume the takes the values , for calculation of symbolic features refer Equation 2:
, ′ = 1 − = Equation 2
• Computation of distance between given feature and respective feature ′ in normal profile is given by the Equation 3 :
, ′ = | |, 1 Equation 3
Sigma in denominator is used to keep the value in the range [0,1]. Even if the numerator exceeds the sigma value in some case i.e the value exceeds 1 then the min function is used to make the distance 1. So distance value never exceeds one.
B. Event Anomaly Score
This is used to make the decision that event is normal or not. In the Equation 4, summation of calculated local feature distance is taken. Event distance from normal profile calculated is shown by the following Equation 4 :
, ′ = ∑ , ′ Equation 4
Here k is defined as the count of features in a feature set. Event’s normality is decided by calculating threshold value and it is calculated in the Equation 5.
= ∑ , ′ ∗ Equation 5
Number of events which are normal,is denoted by N. Threshold is used to calculate normal or abnormal events. To achieve better trade off between detection and false alarm rate, theta (θ) is used as an adjustment factor to adjust normality threshold.
5 IMPLEMENTATION ON KDD CUP ’99DATA SET 1. Training/Labeled Data set : Last attribute in KDD data
set classifies event as normal or specific attack. 2. Testing/Unlabeled Data set : Event/packet is classified
as unknown.
3. Labels in the last column of KDD training data set classify a given packet as normal or attack. In the table, four main types of attacks are mentioned in the labels which include DoS, R2L, U2R and probe. There are many sub-attacks mentioned under each attack[4]. 4. There are specific columns associated with each type
of attack or with normal. For example column numbers 1, 6, 12, 15, 16, 17, 18, 19, 31, 32, 37 are the relevant features for determining if the packet is normal. The same applies for the types of attacks.
5. Three columns among the 41 are alpha-numeric columns. First of all the table is converted into a completely numeric table by replacing all the alphanumeric entities by their probabilities. The probability of each alphanumeric entry is found out by first counting its frequency in that particular column and dividing it by the total number of rows in that column.
Mean is defined as follow:
= ... Equation 6
Standard Deviation is as follow:
= ∑ − Equation 7
7. Next, the whole data was divided in five files: DoS, Normal, Probe, U2R and R2L. Each file included only the columns relevant to that file.
8. Next, we needed to normalise and standardise all the entries. For that some formulas were applied on all the columns. In the alphanumeric columns which included probabilities, Formula 2 was applied. In the remaining columns Formula 3 was applied. As a result of this aggregation we could bring all the values in all the files within a particular range.
9. Further, the anomaly score given by Formula 4 was calculated i.e sum of all the entries in every row was calculated and it resulted in the formation of a new column in each file which included the sums of all the rows present.
10. Now was the turn of calculating the thresholds. For that Formula 5 was applied on the newly formed row in each file and from that we could get a single alpha value from each file, each for DoS, Normal, Probe, U2R and R2L.
11. Now was the time for testing. A separate file for testing was taken. First of all, all the alphanumeric values were replaced by their respective probabilities. The mean and standard deviations were calculated. 12. The test data was then divided into five files each for
DoS, Normal, Probe, R2L and U2R depending on the relevant columns of each.
13. The Formulas 2 and 3 were again applied on the probabilities and the numeric values and the results were correspondingly replaced.
14. The anomaly score of each row was found out by using Formula 4 i.e by finding out the summation of all the values in a row.
15. Thus again we got five new columns for the five categories in the testing data. Now is the time of declaring the category of each row in the testing data. 16. As the segregation into files in the unlabeled testing
data was done only on the basis of the relevant columns of each attack, hence the number of entries in all the files and in the newly found rows is the same. 17. A list is made which includes the five values from the
five newly formed rows. The Euclidean distance of each value from their respective thresholds is then found. The Euclidean formula for distance gives the distance between any two points in space using the Pythagorean concepts. The formula is given by:
− = | − | Equation 8
18. Thus after performing this operation we get a set of 5 Euclidean distances. The value which is the smallest signifies that it is closest to that category of attack. Like in the above example, if the value for R2L is the smallest then that packet is classified as R2L attack. 19. This process is applied on all the packets and thus all
the packets are classified into the type of attack or normal accordingly.
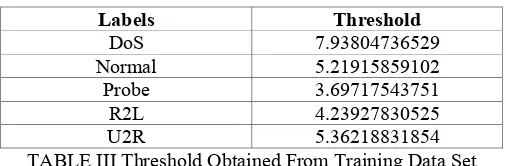
20. This is the context using which we decided whether the incoming traffic is useful or harmful to the network. 21. Table II shows the threshold values found out from the
training data set.
Labels Threshold
DoS 7.93804736529
Normal 5.21915859102
Probe 3.69717543751
R2L 4.23927830525
U2R 5.36218831854
TABLE III Threshold Obtained From Training Data Set
6 RESULT ANALYSIS BY GRAPH
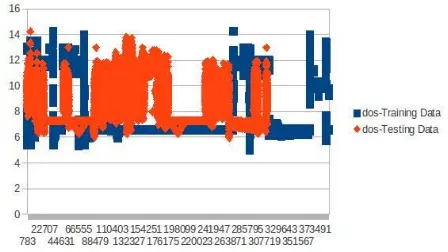
The various graphs drawn show the distribution of the values of the various attacks. Figure 4 shows the distribution of values of the DoS training data.
Similarly Figure 5 shows the distribution of values of the training data for R2L and Normal in two colors. There is a little overlapping in some of the values of R2L and Normal. Figure 6 shows the same for U2R and Probe in different colors. It can be observed from the graph that instances of U2R attacks are very less as compared to Probe.
Now, the testing data points are plotted along the training data curve for each attack and for normal to show the points which lie close to the training curve graphically. The closest points in the testing data are classified as that respective attack and the remaining are discarded.
Fig. 4. DoS in Training Data Set
Figure 7 shows the plotted training curve and the testing dots along it for U2R. As the data for training in U2R is very less as compared to the testing data, hence in the graph plotted the orange part is very less.
Fig. 6. U2R and Probe in Training Data Set
Figure 8 shows the graph for the training and testing data for R2L. Here also the training data is very less compared to
the total testing data. Similarly figures 9, 10 and 11 show the training and testing graphs for DoS, Probe and Normal respectively.
Fig.10. Probe Training Data and Testing Data comparison
Fig.11. Normal Training Data and Testing Data comparison
Fig. 9. DoS Training Data and Testing Data comparison
Fig. 8. R2L Training Data and Testing Data comparison
Fig. 7. U2R Training Data and Testing Data comparison
7 RESULT ANALYSIS BY CALCULATION
Table III gives the threshold values of DoS, Normal, Probe, R2L and U2R. With the help of these threshold values, the nature of each data packet was decided by finding out the Euclidean distances. After determining the nature of these pckets, the data was counted and cross verified with the actual figures available on the website [6]. The efficiency of the IDS was evaluated on the basis of the following factors:
• The second important factor which is actually the most important and the deciding factor is the false alarm rate. It is false positive in our case. It is found out by dividing the number of normals which are categorized as attack by the total number of normals present. Many values of theta have been taken in the Formula 5 while calculating alpha. The threshold values of Table II are with theta taken as one. To increase the efficiency and decrease the false alarm rate, the theta has been varied.
• For theta = 2.968, the number of normal packets is Normal = 60470, Total = 311079 Actual number of normal packets = 60591 So by definition,
Detection Rate = (311079-60470)/311079 = 250609/311079 = 80.56 %
False Alarm Rate = (60591-60470)/311079 = 0.038 %
• For theta = 2.9679, Normal = 60474 So ,
Detection Rate = (311079-60474)/311079 = 80.55% False Alarm Rate = (60591-60474)/311079 = 0.0376%
• For theta = 2.9678, Normal = 60590 So,
Detection Rate = (311079-60590)/311079 = 80.52% False Alarm Rate = (60591-60590)/311079 = 0.000321%
It is clear from the above calculations that the detection rate and false alarm rate for context based IDS are far better than global IDS. The Table III shows the comparison in between global and context based IDSs for different theta values:
Profile θ Detection Rate False Positive Global Profile 2 71.82% 9.94% Global Profile 3 73.19% 2.79% Context-Based
Profile 2.968 80.56% 0.038% Context-Based
Profile 2.9679 80.55% 0.0376% Context-Based
Profile 2.9678 80.52% 0.000321% TABLE III. Rate Comparison Btween Global Profile and
Context-Based Profile
8 CONCLUSION
With the increase in security issues regarding networks and computers systems, intrusion detection tools are becoming more and more necessary. Complete supervision of both network and host activities and logs can be performed by adhering to a combination of security tools like firewall and
the various available IDSs. These tools together can then help to determine various issues and vulnerabilities in the network and the host system. Further, they’ll also be able to group the entering packets as normal or not with the help of various further computations. Irrespective of a system using anomaly-based or signature-based detection, the systems can be classified in the following 2 categories: host-based and network-based. Each type among the above is competent in its own way with its own advantages and disadvantages, and hence are suitable for various target environments.
From the literature survey and the subsequent implementation of the Intrusion Detection System in the project, it is clear that the context-based profiling yields better results than global profiling for anomaly-based detection and as well as for determining attack class of malicious events. The reason for this is, global profiles represent many varied characteristics, which are quite different from each other. This results in a not so correct diagnosis and high false alarm rates. On the other hand, context based profiling separates the different characteristics and builds contexts. The analysis is then done of each context separately and hence leads to more accurate results and lower false alarms.
BIBLIOGRAPHY:
[1] Host-based Intrusion Detection System (HIDS), available at http://www.techopedia.com/definition/12826/host-based-intrusion detection-system-hids.
[2] Shailendra Singh Sanjay Silakari and Sanjay Silakari Department of Computer Science and Engineering Rajiv Gandhi Technological University Bhopal, India , An ensemble approach for feature selection of Cyber Attack Dataset, IJCSIS, 2009.
[3] S. Revathi Ph.D. Research Scholar Government Arts College Coimbatore-18, India and Dr. A. Malathi Assistant Professor Coimbatore-18, India, Optimization of KDD Cup ’99 Dataset for In trusion Detection Using Hybrid Swarm Intelligence with Random Forest Classifier, IJARCSSE, 2013.
[4] Adetunmbi A. Olusola and Adeola S. Oladele and Daramola O. Abosede, Analysis of KDD 99 Intrusion Detection Dataset for Selection of Relevance Features, World Congress on Engineering and Computer Science, Int. Assoc. Engn, 2010, pp. 162–168. [5] V. K. Pachghare, Vaibhav K Khatavkar, Parag Kulkarni,
Performance Analysis of Supervised Approach for Pattern based IDS, IJCA, 2011.
[6] The NSL-KDD Data Set, available at http://nsl.cs.unb.ca/NSL-KDD/. [7] Benferhat Salem and Tabia Karim, Context-based profiling for
anomaly intrusion detection with diagnosis,IEEE, 2008.