Assessing the Performances of Protein Function Prediction Algorithms from
the Perspectives of Identification Accuracy and False Discovery Rate
Chunyan Yu1,3,+, Xiaoxu Li1,3,+, Hong Yang1,3, Yinghong Li1,3,+, Weiwei Xue1, Yuzong Chen4, Lin Tao2,* and
Feng Zhu1,3,*
1 Innovative Drug Research and Bioinformatics Group, School of Pharmaceutical Sciences, Chongqing University, Chongqing 401331, China
2 School of Medicine, Hangzhou Normal University, Hangzhou 310012, China
3 Innovative Drug Research and Bioinformatics Group, College of Pharmaceutical Sciences, Zhejiang University, Hangzhou 310058, China
4 Bioinformatics and Drug Design Group, Department of Pharmacy, and Center for Computational Science and Engineering, National University of Singapore, Singapore 117543, Singapore
+These authors contributed equally
* Correspondence:
Prof. Feng Zhu ([email protected]; [email protected]) and Prof. Lin Tao ([email protected])
ABSTRACT
The knowledge of protein function is essential for the study of biological processes, the understanding of disease mechanism and the exploration of novel therapeutic target. Apart from experimental methods, a number of in-silico approaches have been developed and extensively used for protein function prediction. Among these approaches, BLAST predicts functions based on protein sequence similarity, and machine learning predicts functional families from protein sequences irrespective of their similarity, which complements BLAST and other methods in predicting diverse classes of proteins including distantly related proteins and homologous proteins of different functions. However, their identification accuracies and the false discovery rate have not yet been assessed so far, which greatly limits the usage of these prediction algorithms. Herein, a comprehensive comparison of the performances among four popular functional prediction algorithms (BLAST, SVM, PNN and KNN) was conducted. In particular, the performance of these algorithms were systematically assessed by four metrics (sensitivity, specificity, accuracy and Matthews correlation coefficient) based on the independent test datasets generated from 93 protein families defined by UniProtKB Keywords. Moreover, the false discovery rates of these algorithms were evaluated by scanning the genomes of four representative model species (homo sapiens, arabidopsis thaliana, saccharomyces cerevisiae and mycobacterium tuberculosis). As a result, the substantially higher sensitivity and stability of BLAST and SVM were observed compared with that of PNN and KNN. But the machine learning algorithms (PNN, KNN and SVM) were found capable of significantly reducing the false discovery rate (SVM < PNN ≈ KNN). In summary, this study comprehensively assessed the performance of four popular algorithms applied to protein function prediction, which could facilitate the selection of the most appropriate method in the related biomedical research.
KEYWORDS
1. INTRODUCTION
The knowledge of protein function is essential for the study of biological processes [1], the understanding of disease mechanism [2] and the exploration of novel therapeutic target [3-7], and a variety of databases are currently available for providing functional annotations from the perspectives of protein sequence [8], protein-protein interaction [9,10], biological network [11-15] and many specific protein functional classes [16-22]. However, there is a huge gap between the total number of protein sequences discovered and that of proteins characterized with known function [23]. To fill this gap, thousands of high-throughput genome projects are now ongoing [24] and more than 13 million protein sequences are discovered, but only 1% of which has been validated by the experimental annotation [25]. Apart from those experimental approaches, many in-silico methods have been developed and extensively applied to predict the protein function [26]. These include sequence similarity [27,28], sequence clustering [29], evolutionary analysis [30], structural comparison [31], gene fusion [32], protein-protein interaction [33,34], protein functional classification via sequence-derived [35-38] and domain [39-43] features, OMICs profiling [44-47], and integrated methods which combine multiple algorithms and/or data sources for enhanced function prediction [48-51].
Among these in-silico methods [52], the basic local alignment search tool (BLAST) [53] revealing protein functions based on excess sequence similarity [54] demonstrated great capacity and attracted substantial interests from the researchers of this field [55,56]. Apart from BLAST, the methods based on the machine learning algorithm (a specific type of artificial intelligence) were frequently used in recent years to predict protein function [57-62], and various types of software together with several web-based tools integrating these methods were developed to predict the protein function from sequences irrespective of sequence or structural similarity [36,63]. These software and tools showed powerful performance to complement other
in-silico methods or as part of the integrated method in predicting the function of diverse protein classes, including those distantly related proteins and the homologous proteins of different functions [64,65].
In this study, the performances of four popular functional prediction algorithms (BLAST, SVM, KNN and PNN) were comprehensively evaluated from two perspectives. In particular, the identification accuracies (measured by sensitivity, specificity, accuracy and Matthews correlation coefficient) of various algorithms were systematically evaluated based on the independent test data for 93 functional families. Secondly, the false discovery rates of these algorithms were compared by scanning the genomes of four representative model organisms (human, arabidopsis thaliana, saccharomyces cerevisiae, mycobacterium tuberculosis). In summary, the finding of this work provided detail information on the performances of those algorithms popular for protein function prediction, which may facilitate the selection of the most appropriate method in the related biomedical research.
2. MATERIALS AND METHODS
To develop a useful sequence-based statistical predictor for a biological system as reported in a series of recent publications [74-83], the Chou’s 5-step rule should be observed [84]: (1) How to construct or select a valid dataset to train and test the predictor? (2) How to formulate the biological sequence samples with an effective mathematical expression that can truly reflect their intrinsic correlation with the target to be predicted? (3) How to introduce a powerful algorithm to operate function prediction? (4) How to evaluate and validate the anticipated accuracy of the predictor; (5) How to establish a user-friendly web-server for the predictor that is accessible to the public? The corresponding methods and steps adopted in this study were provided and described below.
2.1 Collecting the Protein Sequences of Different Functional Families
Table 1 provided the complete list of 93 protein functional families collected from UniProt database [43] and the performances of the popular protein function prediction methods (BLAST, SVM, KNN and PNN) were measured by independent test dataset (the way to generate independent dataset was demonstrated in the following section 2.2). These 93 families included 12 molecular binding families (e.g. sodium-binding, potassium-binding, SH3-binding, RNA-binding), 15 ligand families (e.g. plastoquinone ligand, vitamin C ligand, and ubiquinone ligand), 58 functional families defined by Gene Ontology (40 molecular functions and 18 biological processes) and 8 broad families defined by the UniProt database [43]. All families were contained in the keyword categories provided by UniProt database, and the majority (82.7%) of these 93 families were able to be mapped to their corresponding GO terms (Table 1). Protein entries haven’t been manually annotated and reviewed by UniProtKB curators in a keyword category were not considered for analysis in this study. As a result, 107 ~ 49,517 protein-entries from 93 functional families across various species were collected.
2.2 Construction of the Training and Testing Datasets
family, the datasets of training, testing and independent test were prepared by following a strict procedure after the data collection described in section 2.1. Firstly, protein members of the same name but different species origins were grouped together. Secondly, protein members in each group were iteratively selected and put into the datasets of training, testing, and independent test as positive samples. Protein members in each functional family were then mapped into Pfam [16] protein families for generating negative samples. The Pfam family with at least one member of the functional family was defined as the “positive family”, while the rest of the Pfam families were named as “negative family”. Finally, three representative proteins from each “negative family” were randomly selected and then iteratively put into the datasets of training, testing, and independent test as negative samples. It is necessary to emphasize that there were no overlap among the datasets of training, testing, and independent test. A similar procedure for dataset construction is described in the previous publications [60,61].
To assess the false discovery rate among algorithms, the genomes of four model organisms representing four species kingdoms (homo sapiens from Animalia, arabidopsis thaliana from Plantae, saccharomyces cerevisiae from Fungi and mycobacterium tuberculosis from Bacteria) were collected from UniProt. The protein entries without any manual annotation and review by the UniProtKB curators were not taken into consideration. In total, 20,183, 15,169, 6,721 and 2,166 protein sequences in fasta format were collected for human, arabidopsis thaliana, saccharomyces cerevisiae and mycobacterium tuberculosis, respectively.
2.3 Feature Vectors Used for Representing the Protein Sequence
Every protein sequence can be represented by a feature vector assembled from encoded representations of nine tabulated residue properties: (1) amino acid composition, (2) hydrophobicity, (3) normalized Van der Waals volume, (4) polarity, (5) polarizability, (6) charge, (7) surface tension, (8) secondary structure and (9) solvent accessibility for each residue in protein sequence [36,91-93]. Then, 3 descriptors (composition,
transition and distribution) were used to describe each of these properties [36]. The composition was the number of amino acids of a particular property divided by the total number of amino acids. The transition
referred to the percent frequency with which amino acids of a particular property was followed by amino acids of a different property. The distribution indicated the chain length within which the first, 25, 50, 75 and 100% of the amino acids of a particular property was located respectively. The detailed procedure for generating feature vectors from protein sequence has been described in our previous publications [36,65]. These features have already been successfully applied to facilitate the prediction of enzyme functional [94] and structural classes [93].
2.4 Construction of Protein Function Prediction Model Based on Machine Learning
the independent test dataset was used to evaluate the performance of the newly constructed model and to detect possible over-fitting. Duplicated proteins in each training, testing, independent evaluation dataset or among them were removed before the model construction.
2.5 Construction of Protein Functional Prediction Model Based on Sequence Similarity
Sequence similarity was assessed by the NCBI Protein-Protein BLAST (version 2.6.0+) [53,54]. Firstly, the combined training and testing dataset was adopted to form the BLAST database, and the sequences in the independent test dataset were used as queries. The BLAST E-value and percentage sequence identity were usually applied to represent the level of similarity between sequences [95]. The functional variation between proteins was reported to be rare when their sequence identity was more than 40% [96,97]. Thus, a E-value of 0.001 and a sequence identity of 40% were adopted as the cutoffs in this study to assess the functional conservation of BLAST hits.
2.6 Assessing the Identification Accuracies of the Studied Methods
The performance of protein function prediction algorithms were systematically assessed by four popular metrics: sensitivity (SE), specificity (SP), accuracy (ACC) and Matthews correlation coefficient (MCC) based on the independent test datasets generated from the studied 93 families (Supplementary Table S1). All these 4 metrics were widely used in assessing the performance of protein function predictors [98-103]. In particular, the SE was defined by the proportion of real positive cases that were correctly predicted as positive [104,105] (shown in Equation 1):
= TP
TP + FN (Eq. 1)
The SP indicated the proportion of real negative cases that were correctly predicted as negative [104,105] (shown in Equation 2):
= TN
TN + FP (Eq. 2)
The ACC referred to the proportion of true results (both true positives and true negatives) among the total number of cases examined (shown in Equation 3):
= TP + TN
TP + FN + TN + FP (Eq. 3)
The MCC was an important metric reflecting the stability of a protein function predictor, which described the correlation between a predictive value and an actual value [104,105]. It has been considered as one of the most comprehensive parameters in any category of predictors due to its full consideration of all four results (TP, TN, FP and FN). In particular, the MCC could be calculated by Equation 4:
= (TP ∗ TN − FP ∗ FN) ∗ (TP ∗ TN − FP ∗ FN)
where TP, TN, FP and FN indicated the number of true positives, true negatives, false positives and false negatives, respectively [104,105]. It is very important to emphasize that this set of metrics is valid only for the single-label systems (in which each protein only belongs to one functional class). For the multi-label systems (in which a protein may belong to several functional classes, frequently existed in system biology [106-110] and system medicine [75,111] and biomedicine [103]), a completely different set of metrics as defined in [112] is needed.
2.7 Evaluating the False Discovery Rates of the Studied Methods
As reported, genome scanning was a comprehensive method to evaluate the capacity of protein functional prediction tools in identifying and classifying protein family [113,114]. In this paper, an evaluation on the false discovery rate of the studied protein function predictors was performed by scanning the genomes of 4 model organisms representing 4 species kingdoms (homo sapiens from Animalia, arabidopsis thaliana
from Plantae, saccharomyces cerevisiae from Fungi and mycobacterium tuberculosis from Bacteria). In reality, the number of proteins outside a specific family should significantly surpass that within the family. Thus, a slight decline in the value of SP could induce tremendous false positive prediction results, which reminded us to use SP as an indicator when evaluating the model’s false discovery rates.
3. RESULTS AND DISCUSSION
3.1 Assessment of the Identification Accuracies Measured by Four Popular Metrics
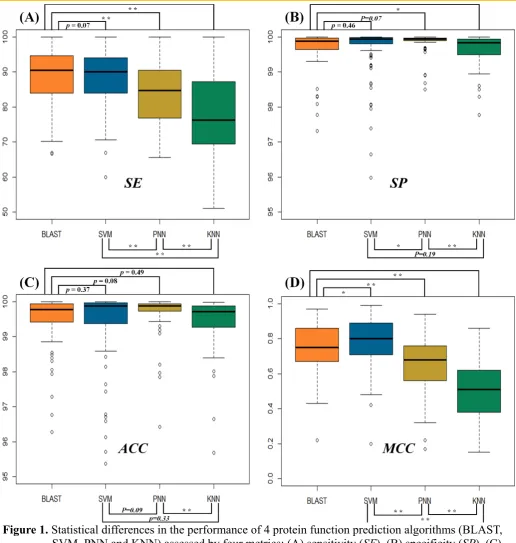
The statistical differences in SE (Figure 1A), SP (Figure 1B), ACC (Figure 1C) and MCC (Figure 1D) among four popular functional prediction algorithms were illustrated. As illustrated in Figure 1A, the SE
of BLAST measured by the independent test dataset of 93 families was roughly equivalent to that of SVM, but statistically higher than that of both PNN and KNN. In particular, the SE of 93 functional families was 50.00 ~ 99.99% for SVM, 43.98 ~ 99.99% for BLAST, 65.52 ~ 99.99% for PNN and 51.06 ~ 99.99% for KNN, and SEs’ median values of BLAST, SVM, PNN and KNN equaled to 90.52%, 90.08%, 84.62% and 76.26%, respectively. As shown in Figure 1B, the majority of the SPs of all algorithms surpassed 99.50% with an ascending trend in SPs’ standard deviation (PNN < SVM < BLAST < KNN). In particular, the SP
of 93 functional families was 95.98 ~ 99.99% for SVM, 97.32 ~ 99.99% for BLAST, 98.50 ~ 99.99% for PNN and 97.78 ~ 99.99% for KNN, and SPs’ median values of BLAST, SVM, PNN and KNN equaled to 99.88%, 99.93%, 99.93% and 99.83%, respectively. These results revealed a relatively low level of false discovery rates for all popular functional prediction algorithms.
Moreover, the ACCs’ median values of BLAST, SVM, PNN and KNN equaled to 99.78%, 99.88%, 99.87% and 99.71%, respectively.
The MCC was frequently applied to reflect the stability of protein function predictor, and was considered as one of the most comprehensive parameters because of its full consideration of TP, TN, FP and FN. As illustrated in Figure 1D, the MCC of both BLAST and SVM was better than that of PNN and KNN with the majority of the MCCs higher than 0.7. In particular, the MCCs of 93 functional families were between 0.20 and 0.99 for SVM, between 0.22 and 0.97 for BLAST, between 0.17 and 0.94 for PNN, & between 0.15 and 0.86 for KNN. The median values of MCCs for BLAST, SVM, PNN and KNN equaled to 0.75, 0.80, 0.68 and 0.51, respectively. In sum, there was a consistently low level of false discovery rate among all algorithms as assessed by the metric SP. However, when positive discovery rate (SE) and the stability of prediction (MCC) were considered, both BLAST and SVM stood out as more powerful algorithms for protein function prediction.
3.2 Evaluating the Statistical Differences in SE and MCC among Four Metrics
For those machine learning algorithms (SVM, PNN and KNN), there was significant statistical difference in their SEs and MCCs. As shown in Figure 1A, the statistical difference in SEs between SVM and PNN equaled to 0.007, while that between SVM and KNN was 8.8 × 10 . Moreover, there was a significant statistical difference between PNN and KNN (p-value=0.001). In particular, the number of families with the SEs of > 90%, ≤ 90% & > 80% and ≤ 80% for SVM equaled to 51, 31 and 11, respectively; the number of families with the SEs of > 90%, ≤ 90% & > 80% and ≤ 80% for PNN equaled to 17, 25 and 19, respectively; and the number of functional families with SEs of > 90%, ≤ 90% & > 80% and
≤ 80% for KNN equaled to 17, 14 and 45, respectively. Similar to SE, the statistical difference in MCC
between SVM and PNN equaled to 3.0 × 10 , and that between SVM and KNN equaled to 2.2 × 10 . Moreover, there was clear statistical difference between PNN and KNN (p-value=1.1 × 10 ). In particular, the number of families with MCCs of > 0.85, ≤ 0.85 & > 0.7 and ≤ 0.7 for SVM equaled to 36, 35 and 22, respectively; the number of functional families with MCCs of > 0.85, ≤ 0.85 & > 0.7
and ≤ 0.7 for PNN was to 8, 17 and 37, respectively; and the number of protein families with MCCs of
PNN and KNN. Meanwhile, MCC of SVM was higher than that of BLAST in 53 families, but was lower than that of BLAST in 40 families. The MCCs’ median values (0.75 for BLAST, 0.80 for SVM) and mean values (0.75 for BLAST, 0.79 for SVM) indicated a slight improvement in prediction stabilities by SVM.
The amphibian defense peptide family (KW-0878) was the family with the highest SE (99.99%) for SVM, BLAST and KNN, which was known to be rich source of antimicrobial peptides with broad spectrum of antimicrobial activities against pathogenic microorganisms [115-117]. The superior SE of this family may come from its nature as an evolutionarily well-conserved component of the host innate defense system in a wide range of organisms from bacteria to mammals [118].
3.3 In-depth Assessment of the False Discovery Rate by Genome Scanning
The genome scanning has been frequently used to evaluate the false discovery rate of function prediction tools [113,114]. To have a comprehensive understanding of methods’ false discovery rate, the genomes of 4 model organisms representing 4 species kingdoms (homo sapiens from Animalia, arabidopsis thaliana
from Plantae, saccharomyces cerevisiae from Fungi and mycobacterium tuberculosis from Bacteria) were collected. As demonstrated in Table 2 and Supplementary Table S2, the genome scanning revealed that the number of proteins in any of those studied 93 families predicted by SVM, PNN and KNN did not exceed 10% of the total number of proteins in the whole genome, and this was the same situation for the majority (82%) of the studied 93 families by BLAST. The higher number of proteins predicted for certain functional family may indicate a higher false discovery rate [113,114]. For human genome, the number of proteins identified by SVM was equivalent to or was slightly higher than that of both PNN and KNN, but was significantly lower than that of BLAST (Figure 2a). In addition, the proteins identified by PNN were lower than that of KNN in 11 families and higher in 20 families.
Moreover, 15 protein families only existed in plants, microbes or viruses (Supplementary Table S3, not existing in the human genome) were collected for assessing the false discovery rate of each algorithm. For example, the covalent protein-RNA linkage family (KW-0191) contained proteins attaching covalently to the RNA molecules in virus [119] and the storage protein (KW-0758) included the proteins as a source of nutrients for the development or growth of organism in plants. For these families (Supplementary Table S3), SVM did not identify any proteins from the human genome, while 0.06% and 0.25% of the proteins in human genome were falsely assigned by BLAST to the family of covalent protein-RNA linkage protein
and storage protein, respectively. As illustrated in Figure 3, several other families (such as plant defense, virulence) also demonstrated a significantly higher false discovery rate by BLAST than that of SVM.
For other three genomes, their situation was similar to the human genome. Take the arabidopsis thaliana
rate (Figure 2b, Figure 2c and Figure 2d) could be ordered by BLAST > SVM > PNN and KNN. These results revealed that BLAST was more prone to generate false discovery rate than the other three machine learning methods (SVM > PNN ≈ KNN).
As demonstrated in a series of recent publications [106-110,120], a user-friendly and publicly accessible web-server represents the future direction for developing practically more useful prediction methods and computational tools. A variety of web-servers have increasing impacts on medical science [121], driving medicinal chemistry into an unprecedented revolution [122], the efforts shall be made in future to provide a web-server for the prediction and performance assessment presented in this study.
4. CONCLUSION
REFERENCES
1. Baldi, P.; Brunak, S.; Chauvin, Y.; Andersen, C.A.; Nielsen, H. Assessing the accuracy of prediction algorithms for classification: An overview. Bioinformatics 2000, 16, 412-424.
2. Jackson, S.P.; Bartek, J. The DNA-damage response in human biology and disease. Nature 2009, 461, 1071-1078.
3. Weinberg, S.E.; Chandel, N.S. Targeting mitochondria metabolism for cancer therapy. Nat. Chem. Biol. 2015,
11, 9-15.
4. Grant, M.A. Integrating computational protein function prediction into drug discovery initiatives. Drug Dev. Res. 2011, 72, 4-16.
5. Li, B.; Tang, J.; Yang, Q.; Li, S.; Cui, X.; Li, Y.; Chen, Y.; Xue, W.; Li, X.; Zhu, F. Noreva: Normalization and evaluation of ms-based metabolomics data. Nucleic Acids Res. 2017, 45, 162-170.
6. Li, B.; Tang, J.; Yang, Q.; Cui, X.; Li, S.; Chen, S.; Cao, Q.; Xue, W.; Chen, N.; Zhu, F. Performance evaluation and online realization of data-driven normalization methods used in lc/ms based untargeted metabolomics analysis. Sci. Rep. 2016, 6, 38881.
7. Xu, J.; Wang, P.; Yang, H.; Zhou, J.; Li, Y.; Li, X.; Xue, W.; Yu, C.; Tian, Y.; Zhu, F. Comparison of fda approved kinase targets to clinical trial ones: Insights from their system profiles and drug-target interaction networks. BioMed Res. Int. 2016, 2016, 2509385.
8. Huerta-Cepas, J.; Szklarczyk, D.; Forslund, K.; Cook, H.; Heller, D.; Walter, M.C.; Rattei, T.; Mende, D.R.; Sunagawa, S.; Kuhn, M., et al. Eggnog 4.5: A hierarchical orthology framework with improved functional annotations for eukaryotic, prokaryotic and viral sequences. Nucleic Acids Res. 2016, 44, 286-293.
9. Szklarczyk, D.; Jensen, L.J. Protein-protein interaction databases. Methods in Molecular Biology 2015, 1278, 39-56.
10. Jeanquartier, F.; Jean-Quartier, C.; Holzinger, A. Integrated web visualizations for protein-protein interaction databases. BMC Bioinform. 2015, 16, 195.
11. Szklarczyk, D.; Santos, A.; von Mering, C.; Jensen, L.J.; Bork, P.; Kuhn, M. Stitch 5: Augmenting protein-chemical interaction networks with tissue and affinity data. Nucleic Acids Res. 2016, 44, 380-384. 12. Franceschini, A.; Szklarczyk, D.; Frankild, S.; Kuhn, M.; Simonovic, M.; Roth, A.; Lin, J.; Minguez, P.; Bork,
P.; von Mering, C., et al. String v9.1: Protein-protein interaction networks, with increased coverage and integration. Nucleic Acids Res. 2013, 41, 808-815.
13. Szklarczyk, D.; Franceschini, A.; Wyder, S.; Forslund, K.; Heller, D.; Huerta-Cepas, J.; Simonovic, M.; Roth, A.; Santos, A.; Tsafou, K.P., et al. String v10: Protein-protein interaction networks, integrated over the tree of life. Nucleic Acids Res. 2015, 43, 447-452.
14. Szklarczyk, D.; Franceschini, A.; Kuhn, M.; Simonovic, M.; Roth, A.; Minguez, P.; Doerks, T.; Stark, M.; Muller, J.; Bork, P., et al. The string database in 2011: Functional interaction networks of proteins, globally integrated and scored. Nucleic Acids Res. 2011, 39, 561-568.
15. Szklarczyk, D.; Morris, J.H.; Cook, H.; Kuhn, M.; Wyder, S.; Simonovic, M.; Santos, A.; Doncheva, N.T.; Roth, A.; Bork, P., et al. The string database in 2017: Quality-controlled protein-protein association networks, made broadly accessible. Nucleic Acids Res. 2017, 45, 362-368.
16. Finn, R.D.; Coggill, P.; Eberhardt, R.Y.; Eddy, S.R.; Mistry, J.; Mitchell, A.L.; Potter, S.C.; Punta, M.; Qureshi, M.; Sangrador-Vegas, A., et al. The pfam protein families database: Towards a more sustainable future.
17. Li, Y.H.; Yu, C.Y.; Li, X.X.; Zhang, P.; Tang, J.; Yang, Q.; Fu, T.; Zhang, X.; Cui, X.; Tu, G., et al. Therapeutic target database update 2018: Enriched resource for facilitating bench-to-clinic research of targeted therapeutics.
Nucleic Acids Res. 2017, doi:10.1093/nar/gkx1076.
18. Yang, H.; Qin, C.; Li, Y.H.; Tao, L.; Zhou, J.; Yu, C.Y.; Xu, F.; Chen, Z.; Zhu, F.; Chen, Y.Z. Therapeutic target database update 2016: Enriched resource for bench to clinical drug target and targeted pathway information.
Nucleic Acids Res. 2016, 44, 1069-1074.
19. Zhu, F.; Shi, Z.; Qin, C.; Tao, L.; Liu, X.; Xu, F.; Zhang, L.; Song, Y.; Liu, X.; Zhang, J., et al. Therapeutic target database update 2012: A resource for facilitating target-oriented drug discovery. Nucleic Acids Res. 2012,
40, 1128-1136.
20. Zhu, F.; Han, B.; Kumar, P.; Liu, X.; Ma, X.; Wei, X.; Huang, L.; Guo, Y.; Han, L.; Zheng, C., et al. Update of ttd: Therapeutic target database. Nucleic Acids Res. 2010, 38, 787-791.
21. Li, Y.H.; Wang, P.P.; Li, X.X.; Yu, C.Y.; Yang, H.; Zhou, J.; Xue, W.W.; Tan, J.; Zhu, F. The human kinome targeted by fda approved multi-target drugs and combination products: A comparative study from the drug-target interaction network perspective. PLoS One 2016, 11, e0165737.
22. Zhu, F.; Ma, X.H.; Qin, C.; Tao, L.; Liu, X.; Shi, Z.; Zhang, C.L.; Tan, C.Y.; Chen, Y.Z.; Jiang, Y.Y. Drug discovery prospect from untapped species: Indications from approved natural product drugs. PLoS One 2012,
7, e39782.
23. Erdin, S.; Lisewski, A.M.; Lichtarge, O. Protein function prediction: Towards integration of similarity metrics.
Curr. Opin. Struct. Biol. 2011, 21, 180-188.
24. Sayers, E.W.; Barrett, T.; Benson, D.A.; Bolton, E.; Bryant, S.H.; Canese, K.; Chetvernin, V.; Church, D.M.; Dicuccio, M.; Federhen, S., et al. Database resources of the national center for biotechnology information.
Nucleic Acids Res. 2012, 40, 13-25.
25. Barrell, D.; Dimmer, E.; Huntley, R.P.; Binns, D.; O'Donovan, C.; Apweiler, R. The goa database in 2009--an integrated gene ontology annotation resource. Nucleic Acids Res. 2009, 37, 396-403.
26. The UniProt Consortium. Activities at the universal protein resource (uniprot). Nucleic Acids Res. 2014, 42, 191-198.
27. Bork, P.; Koonin, E.V. Predicting functions from protein sequences--where are the bottlenecks? Nat. Genet.
1998, 18, 313-318.
28. Chitale, M.; Hawkins, T.; Park, C.; Kihara, D. Esg: Extended similarity group method for automated protein function prediction. Bioinformatics 2009, 25, 1739-1745.
29. Enright, A.J.; Van Dongen, S.; Ouzounis, C.A. An efficient algorithm for large-scale detection of protein families. Nucleic Acids Res. 2002, 30, 1575-1584.
30. Sahraeian, S.M.; Luo, K.R.; Brenner, S.E. Sifter search: A web server for accurate phylogeny-based protein function prediction. Nucleic Acids Res. 2015, 43, 141-147.
31. Teichmann, S.A.; Murzin, A.G.; Chothia, C. Determination of protein function, evolution and interactions by structural genomics. Curr. Opin. Struct. Biol. 2001, 11, 354-363.
32. Enright, A.J.; Iliopoulos, I.; Kyrpides, N.C.; Ouzounis, C.A. Protein interaction maps for complete genomes based on gene fusion events. Nature 1999, 402, 86-90.
33. Aravind, L. Guilt by association: Contextual information in genome analysis. Genome Res. 2000, 10, 1074-1077.
Methods 2015, 12, 79-84.
35. Jensen, L.J.; Gupta, R.; Staerfeldt, H.H.; Brunak, S. Prediction of human protein function according to gene ontology categories. Bioinformatics 2003, 19, 635-642.
36. Cai, C.Z.; Han, L.Y.; Ji, Z.L.; Chen, X.; Chen, Y.Z. SVM-prot: Web-based support vector machine software for functional classification of a protein from its primary sequence. Nucleic Acids Res. 2003, 31, 3692-3697. 37. Lobley, A.E.; Nugent, T.; Orengo, C.A.; Jones, D.T. Ffpred: An integrated feature-based function prediction
server for vertebrate proteomes. Nucleic Acids Res. 2008, 36, 297-302.
38. Zhu, F.; Qin, C.; Tao, L.; Liu, X.; Shi, Z.; Ma, X.; Jia, J.; Tan, Y.; Cui, C.; Lin, J., et al. Clustered patterns of species origins of nature-derived drugs and clues for future bioprospecting. Proc. Natl. Acad. Sci. USA. 2011,
108, 12943-12948.
39. Das, S.; Sillitoe, I.; Lee, D.; Lees, J.G.; Dawson, N.L.; Ward, J.; Orengo, C.A. Cath funfhmmer web server: Protein functional annotations using functional family assignments. Nucleic Acids Res. 2015, 43, 148-153. 40. Wang, P.; Zhang, X.; Fu, T.; Li, S.; Li, B.; Xue, W.; Yao, X.; Chen, Y.; Zhu, F. Differentiating physicochemical
properties between addictive and nonaddictive adhd drugs revealed by molecular dynamics simulation studies.
ACS Chem. Neurosci. 2017, 8, 1416-1428.
41. Xue, W.; Wang, P.; Li, B.; Li, Y.; Xu, X.; Yang, F.; Yao, X.; Chen, Y.Z.; Xu, F.; Zhu, F. Identification of the inhibitory mechanism of fda approved selective serotonin reuptake inhibitors: An insight from molecular dynamics simulation study. Phys. Chem. Chem. Phys. 2016, 18, 3260-3271.
42. Zheng, G.; Xue, W.; Wang, P.; Yang, F.; Li, B.; Li, X.; Li, Y.; Yao, X.; Zhu, F. Exploring the inhibitory
mechanism of approved selective norepinephrine reuptake inhibitors and reboxetine enantiomers by molecular dynamics study. Sci. Rep. 2016, 6, 26883.
43. Wang, P.; Yang, F.; Yang, H.; Xu, X.; Liu, D.; Xue, W.; Zhu, F. Identification of dual active agents targeting 5-ht1a and sert by combinatorial virtual screening methods. Biomed. Mater. Eng. 2015, 26 Suppl 1, 2233-2239. 44. Li, D.; Ju, Y.; Zou, Q. Protein folds prediction with hierarchical structured svm. Curr. Proteomics 2016, 13,
79-85.
45. Wei, L.; Tang, J.; Zou, Q. Skipcpp-pred: An improved and promising sequence-based predictor for predicting cell-penetrating peptides. BMC Genomics 2017, 18 Suppl 7, 742.
46. Wan, S.; Duan, Y.; Zou, Q. Hpslpred: An ensemble multi-label classifier for human protein subcellular location prediction with imbalanced source. Proteomics 2017, 17, doi:10.1002/pmic.201700262.
47. Wei, L.; Xing, P.; Su, R.; Shi, G.; Ma, Z.S.; Zou, Q. Cppred-rf: A sequence-based predictor for identifying cell-penetrating peptides and their uptake efficiency. J. Proteome Res. 2017, 16, 2044-2053.
48. Friedberg, I.; Harder, T.; Godzik, A. Jafa: A protein function annotation meta-server. Nucleic Acids Res. 2006,
34, 379-381.
49. Wass, M.N.; Barton, G.; Sternberg, M.J. Combfunc: Predicting protein function using heterogeneous data sources. Nucleic Acids Res. 2012, 40, 466-470.
50. Jones, P.; Binns, D.; Chang, H.Y.; Fraser, M.; Li, W.; McAnulla, C.; McWilliam, H.; Maslen, J.; Mitchell, A.; Nuka, G., et al. Interproscan 5: Genome-scale protein function classification. Bioinformatics 2014, 30, 1236-1240.
51. Piovesan, D.; Giollo, M.; Leonardi, E.; Ferrari, C.; Tosatto, S.C. Inga: Protein function prediction combining interaction networks, domain assignments and sequence similarity. Nucleic Acids Res. 2015, 43, 134-140. 52. Bandyopadhyay, S.; Ray, S.; Mukhopadhyay, A.; Maulik, U. A review of in silico approaches for analysis and
53. Boratyn, G.M.; Camacho, C.; Cooper, P.S.; Coulouris, G.; Fong, A.; Ma, N.; Madden, T.L.; Matten, W.T.; McGinnis, S.D.; Merezhuk, Y., et al. Blast: A more efficient report with usability improvements. Nucleic Acids Res. 2013, 41, 29-33.
54. Pearson, W.R. Blast and fasta similarity searching for multiple sequence alignment. Methods in Molecular Biology 2014, 1079, 75-101.
55. Radivojac, P.; Clark, W.T.; Oron, T.R.; Schnoes, A.M.; Wittkop, T.; Sokolov, A.; Graim, K.; Funk, C.; Verspoor, K.; Ben-Hur, A., et al. A large-scale evaluation of computational protein function prediction. Nat. Methods
2013, 10, 221-227.
56. Jiang, Y.; Oron, T.R.; Clark, W.T.; Bankapur, A.R.; D'Andrea, D.; Lepore, R.; Funk, C.S.; Kahanda, I.; Verspoor, K.M.; Ben-Hur, A., et al. An expanded evaluation of protein function prediction methods shows an improvement in accuracy. Genome Biol. 2016, 17, 184.
57. Liang, Y.; Zhang, S. Predict protein structural class by incorporating two different modes of evolutionary information into chou's general pseudo amino acid composition. J. Mol. Graph. Model. 2017, 78, 110-117. 58. Pradhan, D.; Padhy, S.; Sahoo, B. Enzyme classification using multiclass support vector machine and feature
subset selection. Comput. Biol. Chem. 2017, 70, 211-219.
59. Meher, P.K.; Sahu, T.K.; Banchariya, A.; Rao, A.R. Dirprot: A computational approach for discriminating insecticide resistant proteins from non-resistant proteins. BMC Bioinform. 2017, 18, 190.
60. Zhu, F.; Han, L.; Zheng, C.; Xie, B.; Tammi, M.T.; Yang, S.; Wei, Y.; Chen, Y. What are next generation innovative therapeutic targets? Clues from genetic, structural, physicochemical, and systems profiles of successful targets. J. Pharmacol. Exp. Ther. 2009, 330, 304-315.
61. Zhu, F.; Han, L.Y.; Chen, X.; Lin, H.H.; Ong, S.; Xie, B.; Zhang, H.L.; Chen, Y.Z. Homology-free prediction of functional class of proteins and peptides by support vector machines. Curr. Protein Pept. Sci. 2008, 9, 70-95.
62. Zhu, F.; Zheng, C.J.; Han, L.Y.; Xie, B.; Jia, J.; Liu, X.; Tammi, M.T.; Yang, S.Y.; Wei, Y.Q.; Chen, Y.Z. Trends in the exploration of anticancer targets and strategies in enhancing the efficacy of drug targeting. Curr. Mol. Pharmacol. 2008, 1, 213-232.
63. Li, Y.H.; Xu, J.Y.; Tao, L.; Li, X.F.; Li, S.; Zeng, X.; Chen, S.Y.; Zhang, P.; Qin, C.; Zhang, C., et al.
SVM-prot 2016: A web-server for machine learning prediction of protein functional families from sequence irrespective of similarity. PLoS One 2016, 11, e0155290.
64. Cai, C.Z.; Han, L.Y.; Ji, Z.L.; Chen, Y.Z. Enzyme family classification by support vector machines. Proteins
2004, 55, 66-76.
65. Han, L.Y.; Cai, C.Z.; Ji, Z.L.; Cao, Z.W.; Cui, J.; Chen, Y.Z. Predicting functional family of novel enzymes irrespective of sequence similarity: A statistical learning approach. Nucleic Acids Res. 2004, 32, 6437-6444. 66. Shen, H.B.; Yang, J.; Chou, K.C. Fuzzy knn for predicting membrane protein types from pseudo-amino acid
composition. J. Theor. Biol. 2006, 240, 9-13.
67. Nath, N.; Mitchell, J.B. Is ec class predictable from reaction mechanism? BMC Bioinform. 2012, 13, 60. 68. Naveed, M.; Khan, A. Gpcr-mpredictor: Multi-level prediction of g protein-coupled receptors using genetic
ensemble. Amino Acids 2012, 42, 1809-1823.
69. Hayat, M.; Khan, A. Predicting membrane protein types by fusing composite protein sequence features into pseudo amino acid composition. J. Theor. Biol. 2011, 271, 10-17.
71. Li, H.; Yap, C.W.; Ung, C.Y.; Xue, Y.; Li, Z.R.; Han, L.Y.; Lin, H.H.; Chen, Y.Z. Machine learning approaches for predicting compounds that interact with therapeutic and admet related proteins. J. Pharm. Sci. 2007, 96, 2838-2860.
72. Fujimoto, M.S.; Suvorov, A.; Jensen, N.O.; Clement, M.J.; Bybee, S.M. Detecting false positive sequence homology: A machine learning approach. BMC Bioinform. 2016, 17, 101.
73. Pearson, W.R. Protein function prediction: Problems and pitfalls. Curr. Protoc. Bioinformatics 2015, 51, 4.12.11-18.
74. Chen, W.; Feng, P.; Yang, H.; Ding, H.; Lin, H.; Chou, K.C. Irna-ai: Identifying the adenosine to inosine editing sites in rna sequences. Oncotarget 2017, 8, 4208-4217.
75. Cheng, X.; Zhao, S.G.; Xiao, X.; Chou, K.C. Iatc-misf: A multi-label classifier for predicting the classes of anatomical therapeutic chemicals. Bioinformatics 2017, 33, 341-346.
76. Feng, P.; Ding, H.; Yang, H.; Chen, W.; Lin, H.; Chou, K.C. Irna-psecoll: Identifying the occurrence sites of different rna modifications by incorporating collective effects of nucleotides into pseknc. Mol. Ther. Nucleic Acids 2017, 7, 155-163.
77. Liu, B.; Wang, S.; Long, R.; Chou, K.C. Irspot-el: Identify recombination spots with an ensemble learning approach. Bioinformatics 2017, 33, 35-41.
78. Liu, B.; Yang, F.; Chou, K.C. 2l-pirna: A two-layer ensemble classifier for identifying piwi-interacting rnas and their function. Mol. Ther. Nucleic Acids 2017, 7, 267-277.
79. Liu, L.M.; Xu, Y.; Chou, K.C. Ipgk-pseaac: Identify lysine phosphoglycerylation sites in proteins by incorporating four different tiers of amino acid pairwise coupling information into the general pseaac. Med. Chem. 2017, 13, 552-559.
80. Qiu, W.R.; Jiang, S.Y.; Xu, Z.C.; Xiao, X.; Chou, K.C. Irnam5c-psednc: Identifying rna 5-methylcytosine sites by incorporating physical-chemical properties into pseudo dinucleotide composition. Oncotarget 2017, 8, 41178-41188.
81. Qiu, W.R.; Sun, B.Q.; Xiao, X.; Xu, D.; Chou, K.C. Iphos-pseevo: Identifying human phosphorylated proteins by incorporating evolutionary information into general pseaac via grey system theory. Mol. Inform. 2017, 36, doi:10.1002/minf.201600010.
82. Su, Q.; Lu, W.; Du, D.; Chen, F.; Niu, B.; Chou, K.C. Prediction of the aquatic toxicity of aromatic compounds to tetrahymena pyriformis through support vector regression. Oncotarget 2017, 8, 49359-49369.
83. Xu, Y.; Wang, Z.; Li, C.; Chou, K.C. Ipreny-pseaac: Identify c-terminal cysteine prenylation sites in proteins by incorporating two tiers of sequence couplings into pseaac. Med. Chem. 2017, 13, 544-551.
84. Chou, K.C. Some remarks on protein attribute prediction and pseudo amino acid composition. J. Theor. Biol.
2011, 273, 236-247.
85. Chowdhury, S.Y.; Shatabda, S.; Dehzangi, A. Idnaprot-es: Identification of DNA-binding proteins using evolutionary and structural features. Sci. Rep. 2017, 7, 14938.
86. Filos, D.; Chouvarda, I.; Tachmatzidis, D.; Vassilikos, V.; Maglaveras, N. Beat-to-beat p-wave morphology as a predictor of paroxysmal atrial fibrillation. Comput. Methods Programs Biomed. 2017, 151, 111-121.
87. Rahimi, M.; Bakhtiarizadeh, M.R.; Mohammadi-Sangcheshmeh, A. Oogenesis_pred: A sequence-based method for predicting oogenesis proteins by six different modes of chou's pseudo amino acid composition. J. Theor. Biol. 2017, 414, 128-136.
89. Wang, Y.; Li, X.; Tao, B. Improving classification of mature microrna by solving class imbalance problem. Sci. Rep. 2016, 6, 25941.
90. Meher, P.K.; Sahu, T.K.; Rao, A.R. Prediction of donor splice sites using random forest with a new sequence encoding approach. BioData Min. 2016, 9, 4.
91. Bock, J.R.; Gough, D.A. Predicting protein--protein interactions from primary structure. Bioinformatics 2001,
17, 455-460.
92. Karchin, R.; Karplus, K.; Haussler, D. Classifying g-protein coupled receptors with support vector machines.
Bioinformatics 2002, 18, 147-159.
93. Dobson, P.D.; Doig, A.J. Distinguishing enzyme structures from non-enzymes without alignments. J. Mol. Biol.
2003, 330, 771-783.
94. des Jardins, M.; Karp, P.D.; Krummenacker, M.; Lee, T.J.; Ouzounis, C.A. Prediction of enzyme classification from protein sequence without the use of sequence similarity. Proc. Int. Conf. Intell. Syst. Mol. Biol. 1997, 5, 92-99.
95. Du, R.; Mercante, D.; Fang, Z. An artificial functional family filter in homolog searching in next-generation sequencing metagenomics. PLoS One 2013, 8, e58669.
96. Tian, W.; Skolnick, J. How well is enzyme function conserved as a function of pairwise sequence identity? J. Mol. Biol. 2003, 333, 863-882.
97. Wommack, K.E.; Bhavsar, J.; Ravel, J. Metagenomics: Read length matters. Appl. Environ. Microbiol. 2008,
74, 1453-1463.
98. Ju, Z.; He, J.J. Prediction of lysine propionylation sites using biased svm and incorporating four different sequence features into chou's pseaac. J. Mol. Graph. Model. 2017, 76, 356-363.
99. Jia, J.; Liu, Z.; Xiao, X.; Liu, B.; Chou, K.C. Ippi-esml: An ensemble classifier for identifying the interactions of proteins by incorporating their physicochemical properties and wavelet transforms into pseaac. J. Theor. Biol. 2015, 377, 47-56.
100. Jia, J.; Liu, Z.; Xiao, X.; Liu, B.; Chou, K.C. Icar-psecp: Identify carbonylation sites in proteins by monte carlo sampling and incorporating sequence coupled effects into general pseaac. Oncotarget 2016, 7, 34558-34570.
101. Liu, B.; Long, R.; Chou, K.C. Idhs-el: Identifying dnase i hypersensitive sites by fusing three different modes of pseudo nucleotide composition into an ensemble learning framework. Bioinformatics 2016, 32, 2411-2418. 102. Liu, Z.; Xiao, X.; Yu, D.J.; Jia, J.; Qiu, W.R.; Chou, K.C. Prnam-pc: Predicting n(6)-methyladenosine sites in
rna sequences via physical-chemical properties. Anal. Biochem. 2016, 497, 60-67.
103. Qiu, W.R.; Sun, B.Q.; Xiao, X.; Xu, Z.C.; Chou, K.C. Iptm-mlys: Identifying multiple lysine ptm sites and their different types. Bioinformatics 2016, 32, 3116-3123.
104. Xu, Y.; Shao, X.J.; Wu, L.Y.; Deng, N.Y.; Chou, K.C. Isno-aapair: Incorporating amino acid pairwise coupling into pseaac for predicting cysteine s-nitrosylation sites in proteins. PeerJ 2013, 1, e171.
105. Chen, W.; Feng, P.M.; Lin, H.; Chou, K.C. Irspot-psednc: Identify recombination spots with pseudo dinucleotide composition. Nucleic Acids Res. 2013, 41, e68.
106. Cheng, X.; Xiao, X.; Chou, K.C. Ploc-mplant: Predict subcellular localization of multi-location plant proteins by incorporating the optimal go information into general pseaac. Mol. Biosyst. 2017, 13, 1722-1727.
108. Cheng, X.; Xiao, X.; Chou, K.C. Ploc-mvirus: Predict subcellular localization of multi-location virus proteins via incorporating the optimal go information into general pseaac. Gene 2017, 628, 315-321.
109. Cheng, X.; Zhao, S.G.; Lin, W.Z.; Xiao, X.; Chou, K.C. Ploc-manimal: Predict subcellular localization of animal proteins with both single and multiple sites. Bioinformatics 2017, 33, 3524-3531.
110. Cheng, X.; Xiao, X.; Chou, K.C., Ploc-mgneg: Predict subcellular localization of gram-negative bacterial proteins by deep gene ontology learning via general pseaac. Genomics 2017, pii:S0888-7543(17)30102-7. 111. Cheng, X.; Zhao, S.G.; Xiao, X.; Chou, K.C. Iatc-mhyb: A hybrid multi-label classifier for predicting the
classification of anatomical therapeutic chemicals. Oncotarget 2017, 8, 58494-58503.
112. Chou, K.C. Some remarks on predicting multi-label attributes in molecular biosystems. Mol. Biosyst. 2013, 9, 1092-1100.
113. Brown, J.B.; Akutsu, T. Identification of novel DNA repair proteins via primary sequence, secondary structure, and homology. BMC Bioinform. 2009, 10, 25.
114. Crappe, J.; Van Criekinge, W.; Trooskens, G.; Hayakawa, E.; Luyten, W.; Baggerman, G.; Menschaert, G. Combining in silico prediction and ribosome profiling in a genome-wide search for novel putatively coding sorfs. BMC Genomics 2013, 14, 648.
115. Boman, H.G. Peptide antibiotics and their role in innate immunity. Annu. Rev. Immunol. 1995, 13, 61-92. 116. Hancock, R.E.; Diamond, G. The role of cationic antimicrobial peptides in innate host defences. Trends
Microbiol. 2000, 8, 402-410.
117. Radek, K.; Gallo, R. Antimicrobial peptides: Natural effectors of the innate immune system. Semin. Immunopathol. 2007, 29, 27-43.
118. Iwamuro, S.; Kobayashi, T. An efficient protocol for DNA amplification of multiple amphibian skin antimicrobial peptide cdnas. Methods in Molecular Biology 2010, 615, 159-176.
119. Virgen-Slane, R.; Rozovics, J.M.; Fitzgerald, K.D.; Ngo, T.; Chou, W.; van der Heden van Noort, G.J.; Filippov, D.V.; Gershon, P.D.; Semler, B.L. An rna virus hijacks an incognito function of a DNA repair enzyme. Proc. Natl. Acad. Sci. USA. 2012, 109, 14634-14639.
120. Qiu, W.R.; Sun, B.Q.; Xiao, X.; Xu, Z.C.; Jia, J.H.; Chou, K.C. Ikcr-pseens: Identify lysine crotonylation sites in histone proteins with pseudo components and ensemble classifier. Genomics 2017,
pii:S0888-7543(17)30138-6.
121. Chou, K.C. Impacts of bioinformatics to medicinal chemistry. Med. Chem. 2015, 11, 218-234.
122. Chou, K.C. An unprecedented revolution in medicinal chemistry driven by the progress of biological science.
Table 1. The performance of four protein function prediction algorithms assessed by four popular metrics: sensitivity (SE), specificity (SP), accuracy (ACC) and Matthews correlation coefficient (MCC).
Uniprot Keyword
Protein Functional
Family GO Category
BLAST SVM PNN KNN
SE % SP % AC % MCC SE % SP % AC % MCC SE % SP % AC % MCC SE % SP % AC % MCC
KW-0020 Allergen - 76.32 99.95 99.80 0.68 85.19 99.88 99.84 0.51 86.42 99.92 99.89 0.60 74.11 99.95 99.87 0.59
KW-0049 Antioxidant GO:0016209 94.68 99.97 99.94 0.89 89.00 99.97 99.94 0.80 86.00 99.94 99.90 0.68 69.05 99.92 99.82 0.51
KW-0117 Actin capping GO:0051693 94.55 99.99 99.98 0.86 95.10 99.98 99.97 0.89 91.18 99.90 99.87 0.65 73.33 99.93 99.90 0.40
KW-0147 Chitin-binding GO:0008061 86.96 99.98 99.96 0.78 92.42 99.90 99.86 0.78 75.36 99.91 99.77 0.62 93.63 98.60 98.57 0.28
KW-0157 Chromophore GO:0018298 96.70 98.51 98.48 0.49 93.83 99.93 99.87 0.88 86.91 99.87 99.73 0.77 89.38 99.49 99.37 0.60
KW-0195 Cyclin GO:0061575 89.34 99.93 99.89 0.72 97.96 99.98 99.98 0.87 89.80 99.94 99.93 0.60 74.74 99.84 99.78 0.39
KW-0251 Elongation factor GO:0003746 99.51 99.73 99.73 0.92 97.48 99.97 99.91 0.96 84.14 99.87 99.49 0.79 95.84 99.56 99.47 0.80
KW-0339 Growth factor GO:0008083 94.05 99.91 99.86 0.85 88.89 99.92 99.85 0.79 86.01 99.91 99.82 0.74 76.74 99.87 99.70 0.63
KW-0343 GTPase activation GO:0005096 76.06 99.96 99.77 0.71 92.92 99.94 99.92 0.77 86.73 99.93 99.89 0.68 61.84 99.56 99.36 0.26
KW-0344 Guanine-nucleotide releasing factor GO:0005085 74.09 99.72 99.58 0.43 83.33 99.95 99.91 0.64 89.74 99.85 99.83 0.50 93.79 99.18 99.15 0.29
KW-0396 Initiation factor GO:0003743 96.88 99.92 99.83 0.94 91.36 99.86 99.70 0.85 74.21 99.93 99.43 0.70 77.63 99.65 99.22 0.62
KW-0497 Mitogen GO:0051781 83.87 99.98 99.94 0.76 92.74 99.93 99.86 0.86 83.60 99.92 99.75 0.76 85.19 99.77 99.62 0.67
KW-0505 Motor protein GO:0098840 93.38 99.97 99.91 0.89 89.47 99.97 99.94 0.81 80.70 99.95 99.89 0.67 64.32 99.46 99.27 0.25
KW-0514 Muscle protein - 94.22 99.96 99.93 0.89 95.38 99.96 99.95 0.86 89.23 99.91 99.87 0.69 79.77 99.89 99.81 0.61
KW-0515 Mutator protein GO:1990633 97.65 99.93 99.93 0.75 83.82 100.0 99.97 0.82 77.94 99.91 99.87 0.49 70.00 99.95 99.90 0.51
KW-0568 Pathogenesis related protein GO:0009607 92.86 99.99 99.98 0.82 96.33 99.98 99.94 0.94 94.87 99.93 99.88 0.89 91.26 99.91 99.81 0.83
KW-0734 Signal transduction inhibitor GO:0009968 81.25 99.96 99.93 0.64 84.62 99.91 99.89 0.42 84.62 99.98 99.96 0.68 87.04 99.94 99.92 0.57
KW-0786 Thiamine pyrophosphate binding - 97.08 99.95 99.92 0.93 96.53 99.94 99.91 0.90 87.70 99.85 99.75 0.73 74.64 99.44 99.22 0.40
KW-0830 Ubiquinone binding - 98.37 99.61 99.54 0.91 94.07 99.93 99.76 0.91 82.58 99.67 99.19 0.72 91.50 99.32 99.10 0.72
KW-0847 Vitamin C binding GO:0031418 94.21 99.96 99.95 0.85 91.89 100.0 99.99 0.92 97.30 99.89 99.89 0.46 81.63 99.94 99.91 0.50
(www.preprints.org) | NOT PEER-REVIEWED | Posted: 24 November 2017
doi:10.20944/preprints201711.0160.v1
Peer-reviewed version available at
Int. J. Mol. Sci.
2018
,
19
, 183;
Table 2. The false discovery rate accessed by the percentage of proteins identified from human and thaliana genomes by different algorithms.
UniProt
Keyword Protein Functional Family
Homo sapiens Arabidopsis thaliana
Uniprot (%) SVM (%) BLAST (%) PNN (%) KNN (%) Uniprot (%) SVM (%) BLAST (%) PNN (%) KNN (%)
KW-0117 Actin capping 0.09 0.12 0.72 0.10 0.10 0.05 0.07 0.11 0.05 0.05
KW-0020 Allergen 0.02 0.18 3.68 0.11 0.04 0.01 0.17 6.22 0.07 0.09
KW-0049 Antioxidant 0.07 0.09 0.50 0.08 0.07 0.09 0.16 1.11 0.12 0.13
KW-0147 Chitin-binding 0.02 0.16 0.36 0.02 0.10 0.08 0.24 3.57 0.08 0.18
KW-0157 Chromophore 0.07 0.15 2.10 0.07 0.10 0.28 0.38 0.88 0.23 0.30
KW-0195 Cyclin 0.16 0.24 0.40 0.18 0.19 0.33 0.36 0.61 0.34 0.34
KW-0251 Elongation factor 0.08 0.11 0.45 0.08 0.09 0.15 0.19 0.48 0.14 0.16
KW-0339 Growth factor 0.65 0.93 2.50 0.71 0.73 0.12 0.18 0.24 0.13 0.14
KW-0343 GTPase activation 0.97 1.19 5.47 0.93 1.02 0.28 0.24 1.36 0.21 0.23
KW-0344 Guanine-nucleotide releasing factor 0.73 0.86 5.37 0.73 0.75 0.18 0.20 2.12 0.17 0.19
KW-0396 Initiation factor 0.24 0.39 1.70 0.26 0.25 0.26 0.38 1.71 0.24 0.28
KW-0497 Mitogen 0.20 0.65 4.37 0.30 0.35 0.00 0.07 0.52 0.01 0.02
KW-0505 Motor protein 0.66 0.75 4.07 0.67 0.67 0.59 0.45 2.14 0.34 0.42
KW-0514 Muscle protein 0.31 0.42 4.35 0.37 0.39 0.00 0.17 1.26 0.11 0.13
KW-0515 Mutator protein 0.01 0.02 0.05 0.01 0.01 0.01 0.01 0.05 0.01 0.01
KW-0568 Pathogenesis-related protein 0.00 0.08 0.09 0.04 0.05 0.13 0.20 0.91 0.15 0.16
KW-0734 Signal transduction inhibitor 0.22 0.23 1.22 0.21 0.21 0.01 0.01 0.74 0.01 0.01
KW-0786 Thiamine pyrophosphate binding 0.06 0.07 0.13 0.06 0.06 0.12 0.15 0.28 0.13 0.14
KW-0830 Ubiquinone binding 0.08 0.71 0.12 0.19 0.60 0.13 0.25 0.42 0.17 0.18
KW-0847 Vitamin C binding 0.10 0.12 0.18 0.10 0.09 0.07 0.11 0.53 0.07 0.08
(www.preprints.org) | NOT PEER-REVIEWED | Posted: 24 November 2017
doi:10.20944/preprints201711.0160.v1
Peer-reviewed version available at
Int. J. Mol. Sci.
2018
,
19
, 183;