http://dx.doi.org/10.4236/msa.2015.61013
How to cite this paper: Ravandi,S.A.H., Tork, R.B., Dabirian, F., Gharehaghaji, A.A. and Sajjadi, A. (2015) Characteristics of Yarn and Fabric Made out of Nanofibers. Materials Sciences and Applications, 6, 103-110.
http://dx.doi.org/10.4236/msa.2015.61013
Characteristics of Yarn and Fabric Made out
of Nanofibers
S. A. Hosseini Ravandi1*, R. Bayat Tork1, F. Dabirian2, A. A. Gharehaghaji3, A. Sajjadi1
1Department of Textile Engineering, Isfahan University of Technology, Isfahan, Iran
2Department of Mechanical Engineering, Engineering Faculty, Razi University, Kermanshah, Iran 3Department of Textile Engineering, Amirkabir University of Technology, Tehran, Iran
Email: *[email protected]
Received 28 December 2014; accepted 15 January 2015; published 21 January 2015
Copyright © 2015 by authors and Scientific Research Publishing Inc.
This work is licensed under the Creative Commons Attribution International License (CC BY).
http://creativecommons.org/licenses/by/4.0/
Abstract
Nowadays, while human requirements are extending, producing nanofibers and nanofiber based products are progressing rapidly. Nanofibers have received considerable study in recent years us- ing various polymers and methods. PAN (Polyacrylonitryle) nanofibers have shown a great poten-tial in producing nanofibers and nanofibre yarn as precursor polymers for making high perform-ance carbon fiber. There is a lack of information about yarn and woven fabrics made out of nano-fibers. Current research is aiming to manufacture yarn using well-known electrospinning tech-nique and converting it to woven fabric. A continuous yarn was produced by changing production parameters and using simultaneous twisting and collecting. Values of twist and rate of fiber col-lecting made it possible to prepare yarn from nanofibres. Consequently, the yarns were used for producing plain weave fabric manually. Some characteristics of the yarn, such as diameter and its distribution along the yarn, specific density, thin and thick places were assessed using image processing technique. Also, characteristics of fabric appearances were investigated.
Keywords
Fibrous Materials, Fabrication, Image Processing, Power Spectrum, Electrospinning, Nanofiber Yarn
1. Introduction
There are more than three manufacturing approaches to fabricate nanofibrous structures; i.e. electrospinning, phase separation, and self-assembly. Structures created by each of these approaches are quite different and thus have their own unique advantages. The phase separation technique allows the control of pore architectures, while structures produced by electrospinning provide more control on morphology and high aspect ratio, vari-able pore-size distribution, and high porosity [3].
Due to their characteristics, nanofibers have been studied in different area, i.e., medical science, filtration, drug delivery, tissue engineering, and wound healing [4].
Nanofibers are collected in the form of a web. Some studies are conducted to produce yarn from nanofibers and many researches have reported different methods for preparing nanofiber yarns [5]-[11]. In most of these methods, produced yarn didn’t have suitable length.
Current study has used an innovative method to prepare a continual yarn strand in order to produce woven fabrics woven fabric. The characteristics of nanofiber yarn and woven fabric are studied as well.
By using introduced method and applying suitable polymers, especially biopolymers it could be possible to produce continuously strand of nanofibers with tailored physical, chemical, biological and mechanical properties which are attractive for design of ecologically friendly products in a range of applications from personal care to healthcare such as hospital apparel, suture, drug delivery systems, and scaffolds for tissue engineering and tissue regeneration.
The aim of this study is analyzing different properties of nanofiber yarn and produced fabric. Yarn linear den-sity, coefficient of variance of yarn diameter (CV%), thin and thick places of yarn were calculated. Also, coeffi-cient of agreement of surface irregularity, cover factor, weft and warp spacing of prepared fabric were calculated using image processing.
2. Experimental
2.1. MaterialsPolyacrylonitril (PAN) powder and Dimethylformamide (DMF) as solvent were mixed to make a polymer solu-tion with 14% concentrasolu-tion. Mean molecular weight (Mw) of PAN was 100,000 g/mol. The scanner which was used for image processing of sample fabric was Canon-Canoscan 8400 f with 2000 dpi.
2.2. Yarn Preparation
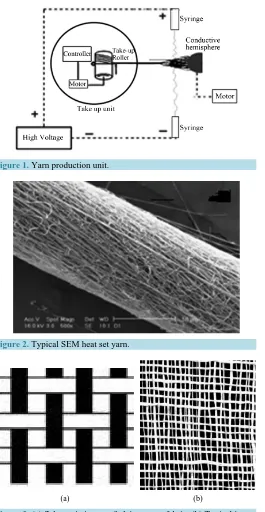
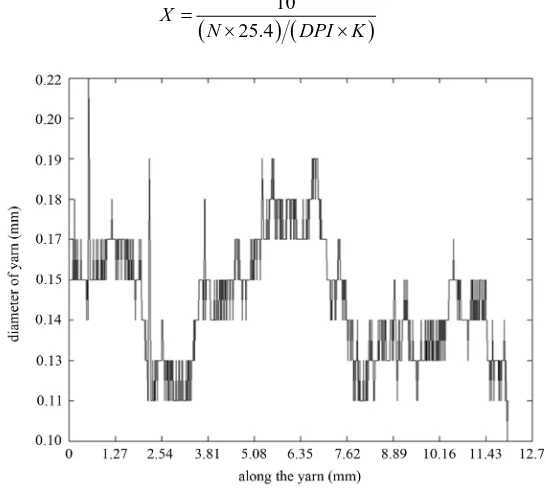
The schematic setup for preparing nanofiber yarn is presented in Figure 1 [12] [13]. In this method, a high voltage DC supplier creates an electrostatic field between two nozzles with opposite charge. Also, it consists of a high voltage-power supply, two syringe needles, a conductive hemisphere, a feeder unit and a take up unit. The hemisphere diameter was 8 cm. The syringe needles were located 2 cm from the hemisphere and 21 cm from take up unit. Electrospinning was done between two syringe needles, then electrospun nanofibers collected on hemisphere surface and twisted by rotating the hemispherical collector. Take up unit can twist the yarn without forming a balloon while taking up the yarn. The take up unit was controlled by a three phase motor for twisting the yarn and was controlled by an inverter. A stepper motor controlled the speed of take up and was controlled by a microcontroller. To provide the required input current for the stepper motor, a buffer was used to connect the output port of microcontroller to the stepper motor. Users can control the rotation speed of the stepper motor with a switch connected to the input port of the microcontroller. After production of the yarn, they were heat treated and stretched two times. The value of twist per meter was 2900. For this purpose, each yarn was drawn by fastening end of yarn with fixed jaw and drawing it in hot water (100˚C). This procedure causes improvement in the strength of yarns [14] [15]. Figure 2 shows typical SEM of heat setted nanofiber yarn.
2.3. Fabric Production
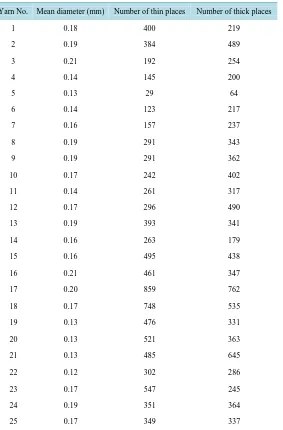
Nanofiber yarns don’t have enough length to get a large yarn package to enable it to be used in construction of fabric using a weaving loom. So, this work has devised a manual procedure to produce plain woven fabrics. A wooden framework and 4 weaving reeds were used for this purpose. These reeds had a guiding rule for yarns to stabilize them and keep space between yarns (weft and warp density). By crossing the yarns between reed teeth, the fabric density was kept steady.
The densities of yarns were 15 ends/cm and 15 picks/cm for warp and weft yarns, respectively. Figure 3(a)
Figure 1.Yarn production unit.
Figure 2.Typical SEM heat set yarn.
[image:3.595.187.452.81.593.2](a) (b)
Figure 3. (a) Schematic image of plain woven fabric; (b) Typical image of plain woven fabric.
3. Results and Discussions
3.1. Yarn Specific DensityFor evaluation of yarn specific density, various solutions were used. More prevalent solutions are: Benzene, Ni-trobenzene, Olive Oil, CCl4 and Acetic Acid. For each solution, the yarn specific density values were assessed to
3.2. Yarn Diameter Determination
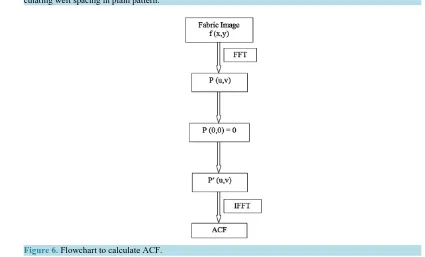
To determine yarn diameter, we scanned 25 SEM samples of different yarns in 2000 dpi and 256 grayscale. Length of each sample was 30 cm. Figure 4 shows a part of diameter variation along the one sample yarn.
Yarn count was determined 21 Tex using the Equation (1):
5
Tex= × ×A ρ 10 (1)
where; A is cross section of the yarn (cm2) and ρ = 1.015 g/cm3.
Nominal diameter and CV% of yarn were obtained 0.1656 mm and 19.82%, respectively. The actual yarn count was 19 Tex.
3.3. Thin and Thick Places
For calculating the thin and thick places we applied a simple procedure using the mean and STD (Standard De-viation) of yarns diameter as the Equation (2) [17]:
a= ±b c (2) where; a is thick place (thin place), b is mean diameter of yarn and c is STD of yarn diameter.
When a column (or row) of yarn image is taken, each part which has diameter more (less) than the amount of
b+c (or b−c), that part is a thick (thin) place. Table 1 shows the thick (thin) places along the 25 sample yarns.
3.4. Fabric Characteristics
To evaluate the fabric geometry and fabric appearance, the fabrics were scanned in 400 dpi and 256 grayscale.
3.4.1. Warp and Weft Spacing
To appraisal of spacing, we selected some columns and rows of fabric images. Then using of Fourier Transforms and image processing, the spacing was calculated. Figure 5 shows two typical Fourier Transforms of line den-sity of images in the warp and weft direction.
Warp and weft spacing were obtained 41.35, and 53.25 pixels, respectively. Warp and weft density (X) ob-tained 13 ends/cm and 16.4 picks/cm, respectively, using the Equation (3):
(
25.4) (
10)
X
N DPI K
=
[image:4.595.176.449.457.703.2]× × (3)
Table 1.Evaluation of yarn diameter, thin and thick places.
Number of thick places Number of thin places
Mean diameter (mm) Yarn No. 219 400 0.18 1 489 384 0.19 2 254 192 0.21 3 200 145 0.14 4 64 29 0.13 5 217 123 0.14 6 237 157 0.16 7 343 291 0.19 8 362 291 0.19 9 402 242 0.17 10 317 261 0.14 11 490 296 0.17 12 341 393 0.19 13 179 263 0.16 14 438 495 0.16 15 347 461 0.21 16 762 859 0.20 17 535 748 0.17 18 331 476 0.13 19 363 521 0.13 20 645 485 0.13 21 286 302 0.12 22 245 547 0.17 23 364 351 0.19 24 337 349 0.17 25
where; K=0,1, 2,,511, 512N= and DPI =400.
The difference between real fabric density and calculations could be attributed to the fact that the yarns had a very flexible structure and this caused the yarns to overlap together.
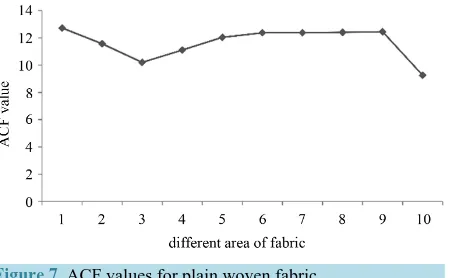
3.4.2. Coefficient of Agreement of Surface Irregularity
Autocorrelation function (ACF), is a method for realizing correspondence between surface are a relative to each other. This method is able to be used for studying in image features like color, intensity, reflection. ACF and power spectrum (PS) are reversal of each other.
For calculating of ACF in image, at first step we calculate PS, using FFT and then using inverse FFT (IFFT), ACF will be found [18]. Figure 6 shows the flowchart to calculate ACF. In this study ACF has been used for evaluating the fabric surface irregularity. Scanned image of fabric was divided into 10 areas with similar surface area.
At first, ACF of all images were taken. Then by taking a central row of each image as a base line, FFT was calculated. Maximum AFC value in each area was taken as a comparison parameter between areas. Figure 7
(a) (b)
Figure 5. (a) Typical Fourier Transform diagram of one selected row which were used for calculating warp spacing in plain pattern; (b) Typical Fourier Transform diagram of one selected row which were used for cal-culating weft spacing in plain pattern.
Figure 6. Flowchart to calculate ACF.
The results of the statistical tests indicate that there is no significant difference between the surfaces area of fabrics at different parts at the 95%, so the fabric surface can be consider as a regular surface.
3.5. Cover Factor
Cover factor is the ratio of the area covered by yarns and the total area of the fabric surface. In this study, cover factor was calculated using the image processing. After scanning the fabrics, the cover factor obtained 0.4467. Also, cover factor was 0.42 according to the Equation (4) [19]:
1 1 2 2 1 2 1 2
[image:6.595.90.515.342.599.2]Figure 7. ACF values for plain woven fabric.
where n1, n2 are densities of warp and weft yarns, respectively and d1, d2 are diameters of warp and weft yarns,
respectively.
4. Conclusions
The aim of this study was to introduce a methodology to produce continuously strand of nanofibers and fabric. Nanofibre yarn properties such as specific density, linear density, thin and thick places were obtained using im-age processing method.
Nominal linear density and specific density of yarn were close to the actual values. Fabric geometry as well as fabric appearance, i.e., warp and weft density, coefficient of agreement of surface irregularity (CASI) and cover factor were determined. The index of CASI showed that surface areas of fabric had a regular appearance.
By using introduced method and applying suitable polymers, especially biopolymers it could be possible to produce continuously strand of nanofibers with tailored physical, chemical, biological and mechanical proper-ties.
References
[1] Baker, B.M., Handorf, A.M., Ionescu, L.C., Li, W.J. and Mauck, R.L. (2009) New Directions in Nanofibrous Scaffolds for Soft Tissue Engineering and Regeneration. Expert Review of Medical Devices, 6, 515-532.
http://dx.doi.org/10.1586/erd.09.39
[2] Ramakrishna, S., Fujihara, K., Teo, W.E., Lim, T.C. and Ma, Z. (2005) An Introduction to Electrospinning and Nano-fibers. World Scientific Publishing, Singapore.
[3] Burger, C., Hsiao, B.S. and Chu, B. (2006) Nanofibrous Materials and Their Applications. Annual Review of Materials Research, 36, 333-368. http://dx.doi.org/10.1146/annurev.matsci.36.011205.123537
[4] Hussain, M.M. and Ramkumar, S.S. (2006) Functionalized Nanofibers for Advanced Applications. Indian Journal of Fibre & Textile Research, 31, 41-51.
[5] Abbasipour, M. and Khajavi, R. (2013) Nanofiber Bundles and Yarns Production by Electrospinning: A Review. Ad-vances in Polymer Technology, 32.
[6] Ali, U., Zhou, Y., Wang, X. and Lin, T. (2012) Direct Electrospinning of Highly Twisted, Continuous Nanofiber Yarns. Journal of the Textile Institute, 103, 80-88. http://dx.doi.org/10.1080/00405000.2011.552254
[7] Dabirian, F., Hosseini Ravandi, S.A., Sanatgar, R.H. and Hinestroza, J.P. (2011) Manufacturing of Twisted Continuous PAN Nanofiber Yarn by Electrospinning Process. Fibers and Polymers, 12, 610-615.
http://dx.doi.org/10.1007/s12221-011-0610-6
[8] Yousefzadeh, M., Latifi, M., Teo, W.E., Amani-Tehran, M. and Ramakrishna, S. (2011) Producing Continuous Twist- ed Yarn from Well-Aligned Nanofibers by a Water Vortex. Polymer Engineering & Science, 51, 323-329.
http://dx.doi.org/10.1002/pen.21800
[9] Gharehgahaji, A.A., Rajabimehr, A. and Zadhoush, A. (2010) Fabrication of Composite Nanofiber Yarn Produced From Pa and Wool Nanoparticles. 7th International Conference—TEXSCI 2010, Liberec, 6-8 September 2010.
[10] MusaviJad, M.S., Hosseini Ravandi, S.A., Tavanai, H. and Hashemi Sanatgar, R. (2011) Wicking Phenomenon in Polyacrylonitrile Nanofiber Yarn. Fibers and Polymers, 12, 801-807. http://dx.doi.org/10.1007/s12221-011-0801-1
Nan-ofiber Yarn. Industria Textila, 62, 59-63.
[12] Javazmi, L., Epaarachchi, J. and Hosseini Ravandi, S.A. (2013) Investigation of Mechanical and Physical Properties of PET Nanofiber Hollow Yarn. Journal of Multifunctional Composites, 1, 123-126.
[13] Zhao, S., Wu, X., Wang, L. and Huang, Y. (2004)Electrospinning of Ethyl-Cyanoethyl Cellulose/Tetrahydrofuran So-lutions. Journal of Applied Polymer Science, 91, 242-246. http://dx.doi.org/10.1002/app.13196
[14] Theron, S.A., Zussman, E. and Yarin, A.L. (2004) Experimental Investigation of the Governing Parameters in the Elec- trospinning of Polymer Solutions. Polymer, 45, 2017-2030. http://dx.doi.org/10.1016/j.polymer.2004.01.024
[15] Sadrjahani, M. and Hosseini Ravandi, S.A. (2013) Microstructure of Heat-Treated PAN Nanofibers. Fibers and Poly-mers, 14, 1276-1282. http://dx.doi.org/10.1007/s12221-013-1276-z
[16] Morton, W.E. and Hearle, J.W.S. (2008) Physical Properties of Textile Fibres. Woodhead Publishing in Textiles, Cam- bridge.
[17] BayatTork, R. (2008) An Investigation on Appearance of Nanofiber Fabric by Image Processing. M.Sc. Thesis, De-partment of Textile Engineering, Isfahan University of Technology, Isfahan.
[18] Hosseini Ravandi, S.A. and Toriumi, K. (1995) Fourier Transform Analysis of Plain Weave Fabric Appearance. Textile Research Journal, 65, 676-683. http://dx.doi.org/10.1177/004051759506501108