© 2016, IRJET | Impact Factor value: 4.45 | ISO 9001:2008 Certified Journal | Page 1395
S.AMUDHA, B.SC., M.SC., M.PHIL.,
Assistant Professor, VLB Janakiammal College of Arts and Science,
Tamilnadu, India
[email protected]
---*****---
ABSTRACT
This paper discuss on data mining process is to extracting valuable information from huge amounts of data. It is the process of discovering appealing knowledge from large amounts of data stored either in databases, data warehouses, or other information repositories. A necessary technique in data analysis and data mining applications is Clustering. Clustering is a process of grouping objects and data into groups of clusters to ensure that data objects from the same cluster are identical to each other. There are different types of clustering algorithms such as hierarchical, partitioning, grid, density based, model based, and constraint based algorithms.. In this paper, an overview of different types of partition clustering algorithm in data mining is done.
Keywords:
Data mining, Clustering, Partitioning, Density, Grid Based, Model Based, Homogenous Data, Hierarchical
1.
INTRODUCTION
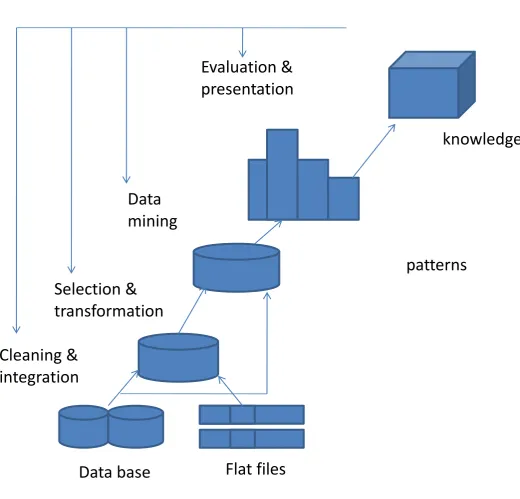
Data mining is refers to “extracting or mining" knowledge from large amounts of data. There are many other terms carrying a similar or slightly different meaning to data mining, such as knowledge mining from databases, knowledge extraction, data/pattern analysis, data archaeology, and data dredging. Many people treat data mining as a synonym for another popularly used term, Knowledge Discovery in Databases", or KDD. Alternatively, others view data mining as simply an essential step in the process of knowledge discovery in databases. Knowledge discovery as a process is depicted in Figure 1., and consists of an iterative sequence of the following steps:
Data cleaning: To remove noise or irrelevant data. Data integration: multiple data sources are combined.
Data Selection: Data relevant to the analysis task are retrieved from the database.
Data Transformation: Data are transformed or consolidated into forms appropriate for mining by performing summary or aggregation operations.
Data Mining: An essential process where intelligent methods are applied in order to extract data patterns. Pattern Evaluation: To identify the patterns representing knowledge based on measures.
© 2016, IRJET | Impact Factor value: 4.45 | ISO 9001:2008 Certified Journal | Page 1396
Figure 1: Knowledge Discovery in Database (KDD
Data Mining consists of four classes of tasks [2].
1) Clustering:Clustering is the automatic learning technique in which division of the data elements into groups of similar objects takes place.
2) Classification:It is the supervised learning technique which is used to map the data into predefined classes. 3) Regression:It is the statistical technique which is used to develop a mathematical formula (like mathematical equations) that fits the dataset.
4) Association Rule Mining:It is the data mining technique which is used to identify relationships from a set of items in a database [1].
patterns
Cleaning &
integration
Selection &
transformation
Data
mining
Evaluation &
presentation
knowledge
© 2016, IRJET | Impact Factor value: 4.45 | ISO 9001:2008 Certified Journal | Page 1397
A large dataset divides data into groups of similar objects. Each group, called cluster, consists of objects that are similar between themselves and dissimilar to objects of other groups.
Data clustering has its roots in a number of areas; including data mining, machine learning, biology, and statistics. Traditional clustering algorithms can be classified into two main categories: hierarchical and partitioned [2].
2.1
Principles of Clustering
The formed clusters need to follow and satisfy the following principles of clustering.
1) Homogeneity:elements of the same cluster are maximally close to each other.
2) Separation:data elements in separate clusters are maximally far apart from each other.
A superior clustering method will create high quality clusters with high intra-cluster similarity and low inter-cluster similarity. The quality of a result produced by clustering depends on both the similarity measure used by method and its implementation. The quality of a cluster produced by clustering method is also measured by its ability to discover some or all of the hidden patterns [1].
3.
CLUSTERING METHODS
Clustering methods can be classified into the following categories − Partitioning Method
Hierarchical Method Density-based Method Grid-Based Method Model-Based Method Constraint-based Method
3.1
Partitioning Method
Suppose to given a database of ‘n’ objects and the partitioning method constructs ‘k’ partition of data. Each partition will represent a cluster and k ≤ n. It means that it will classify the data into k groups, which satisfy the following requirements −
Each group contains at least one object. Each object must belong to exactly one group. For a given number of partitions (say k).
The partitioning method will create an initial partitioning and it uses the iterative relocation technique to improve the partitioning by moving objects from one group to other [10]. In partitioning clustering method clustering creates the clusters in one step instead of creating several steps. Only one set of clusters is formed at the end of clustering, although several sets of clusters may be created internally. As we know that only one set of clusters will be formed then user must have to specify the input( the desired number of clusters). The most well-known and commonly used partitioning methods are k-means, k- medoids.
© 2016, IRJET | Impact Factor value: 4.45 | ISO 9001:2008 Certified Journal | Page 1398
where,
‘||xi - vj||’ is the Euclidean distance between xi and vj. ‘ci’ is the number of data points in ith cluster. ‘c’ is the number of cluster centers[11].
The K-Means algorithm calculates the Arithmetic Mean of each cluster formed in the dataset. The Arithmetic Mean of a cluster is the mean of all the individual records in the cluster. In each of the first K initial clusters, there is only one record. The Arithmetic Mean of a cluster with one record is the set of values that make up that record [8].
A. Procedure for K-means Algorithm
Step 1: Choose K random data sets as a initial group of clusters.
Step 2: For point p in the dataset assign to the cluster which has nearest center Step 3: Recalculate the positions of the centers
Step 4: If the positions of the centers didn't change go to the next step, Else go to Step 2. Step 5: End
Algorithm k-mean.
Input: C: the number of cluster.
D: a data set containing m objects. Output: A set of C cluster.
Method:
1. Choose m objects randomly from dataset as the initial cluster centers;
2. Based on the mean value of the object which is similar to cluster re assign object to that cluster.
3. Calculate the mean value of the objects for each cluster and make updating until no updating made or required.
ii). FCM - Fuzzy CMEANS algorithm: The algorithm is based on the K-means concept to partition dataset into Clusters. The algorithm is as follows:
Calculate the cluster centroids and the objective value and initialize fuzzy matrix. Computer the membership values stored in the matrix. The paper presents list of all algorithms and their efficiency based on the input parameter to mine the Big Data as described below:
If the value of objective is between consecutive iterations is less than the stopping condition then stop. This process is continuous until a partition matrix and clusters are formed [7].
Algorithmic steps for Fuzzy c-means clustering
Let X = {x1, x2, x3 ..., xn} be the set of data points and V = {v1, v2, v3 ..., vc} be the set of centers. 1) Randomly select ‘c’ cluster centers.
2) Calculate the fuzzy membership 'µij' using:
3) Compute the fuzzy centers 'vj' using: 4) Repeat step 2) and 3) until the minimum 'J' value is achieved or ||U(k+1) - U(k)|| < β. where,
‘k’ is the iteration step.
© 2016, IRJET | Impact Factor value: 4.45 | ISO 9001:2008 Certified Journal | Page 1399
Fig2: Result of Fuzzy c-means clustering
iii). k-medoid method: A reference point or mean value of the cluster, we choose actual objects to represent the clusters, i.e one object per cluster. Each leftover object is clustered with the chosen object to which it is most similar. Then performed the partitioning method based on the principal of minimizing the sum of dissimilarities between each object and its corresponding reference point or mean value.
Algorithm: k-medoid
Inputs: C:the number of clusters,
D:a data set containing m objects. Output:A set of C clusters.
Method:
1. choose m objects randomly in D as the initial representative objects ;
2. Then each leftover object is assigned to the cluster which have nearest representative object, 3. Then randomly select a nonrepresentative object.
4. Compute total cost for changing the representative object with non-representative object.
5. If Total cost is less than zero then change representative object with non-representative object to make a new set of m representative objects.
iv).
CLARANS
(Clustering Large Application Based upon Randomized Search) is partitioning method used for large database. Combination of Sampling technique and PAM is used in CLARANS. In CLARANS we draw random sample of neighbours in each step of search dynamically. CLARANS doesn‟t guaranteed search to localized area. The minimum distance between Neighbours nodes increase efficiency of the algorithm. Computation complexity of this algorithm is O (n²) [1].3.2
Hierarchical Methods
This method creates a hierarchical decomposition of the given set of data objects. It can classify hierarchical methods on the basis of how the hierarchical decomposition is formed. There are two approaches here −
Agglomerative Approach Divisive Approach
Agglomerative Approach
This approach is also known as the bottom-up approach. In this, method starts with each object forming a separate group. It keeps on merging the objects or groups that are close to one another. It keep on doing so until all of the groups are merged into one or until the termination condition holds.
Divisive Approach
© 2016, IRJET | Impact Factor value: 4.45 | ISO 9001:2008 Certified Journal | Page 1400
Improve Quality of Hierarchical Clustering, Here are the two approaches that are used to improve the quality of hierarchical clustering
Perform careful analysis of object linkages at each hierarchical partitioning.
Integrate hierarchical agglomeration by first using a hierarchical agglomerative algorithm to group objects into micro-clusters, and then performing macro-clustering on the micro-clusters[10].
In general there are two types of hierarchical method:
i).Agglomerative Method:It is a bottom-up approach , each object have their own cluster and these clusters are merged to form a large clusters i.e a single cluster until some termination conditions are satisfied.
Algorithm:
Input: J:Set of objects
M:Adjacency matrix showing distance between objects Output :DG // Dendrogram
Method: 1. J=0; 2. p=n; 3. P={{t1},…,{tn}};
4. DG={<j, p ,P>};//initially dendrogram contains each object in its own cluster. 5. Repeat 6. Old k=k; 7. j = j+1; 8. M=vertex adjacency matrix for graph with threshold distance of d; 9. <p ,P>= New Cluster(M,J); 10. If old p =P then 11. DG=DG U <j ,p ,P>;//new set of clusters added to dendrogram. 12. Until k=1.
ii).Divisive Method: It is top-down method in which clusters are subdivided into smaller and smaller parts until all part or object creates their own cluster or until they satisfies certain or specific termination condition like a desired number of clusters to be obtained or the diameter of each cluster reach the threshold.
iii). BRICH Method: balanced iterative reducing and clustering using hierarchies BRICH is designed for clustering a large amount of numerical data . The basic idea is that a tree is formed that captures needed information. Clustering is perform on the tree itself, the nodes in the tree contain s the information which is used for the calculation of distance values. BRICH contains two new concept called Clusteringfeature(CF) and clustering tree(CE). Both of the CF and CE summarize the cluster representations, and provide helps in achieving good speed and scalability for large databases.
The CF is three –dimensional vector which contain or summarize information of objects of a clusters which are sufficient to calculate the measurements which help in clustering decisions. Whereas CF-Tree is height balanced tree which store the CF for making hierarchical clustering. It contains Two parameter one is branching factor(BF)which describes the maximum number of child per non leaf node, and other one is threshold(T) which describes the diameter of sub cluster which are stored on the trees leaf node. BRICH tries to produce the best possible cluster among the entire cluster from the given resources.
Algorithm: N=set of elements; T=threshold for CF tree construction; Output : C //set of clusters
Method: 1. for each element that belongs to N Find correct leaf node for element insertion; 2. if threshold condition is not violated than add element to cluster and update CF ;
3. else make room to insert element then insert element as single cluster or update CF; 4. else break leaf node and redistribute CF.
iv). ROCK method: robust clustering using links This method use the concept of links and perform more global approach by taking the neighborhood of individual pair of points in consideration for making clusters . If two points are same in nature and they have same neighborhood then these two points will belong to same cluster and can be merged together. ROCK method is divided into three parts are as follows:
1. First get a random sample of the data.
2. Obtain the goodness measure by performing link agglomerative approach on data to get the point which can be merged at each step.
3. Assigned the remaining data on disk by using these points which forms the clusters.
© 2016, IRJET | Impact Factor value: 4.45 | ISO 9001:2008 Certified Journal | Page 1401 vi). Clustering Using Representatives Algorithm:
CURE algorithm that utilizes multiple representative points for each cluster. CURE is a kind of class-conscious bunch algorithmic rule that requires dataset to be partitioned. A mixture of sampling and partitioning is applied as a strategy to deal with vast information.
A random sample from the dataset is partitioned to be part of the clusters. CURE first partitions the random sample and then partially clusters the data points according to the partition. After removing all outliers, the pre clustered data in each partition is then clustered again to produce the final clusters. The clustering algorithm can recognize arbitrarily shaped clusters. The algorithm is robust to the detect the outliers, and the algorithm uses space that is linear in the input size n and has a worst-case time complexity of O(n2 log n)[9].
The most used variations of the hierarchical clustering based on different distance measures are:
1. Average linkage clustering
The dissimilarity between clusters is calculated using average values. The average distance is calculated from the distance between each point in a cluster and all other points in another cluster. The two clusters with the lowest average distance are joined together to form the new cluster.
2. Centroid linkage clustering
This variation uses the group centroid as the average. The centroid is defined as the center of a cloud of points.
3. Complete linkage clustering (Maximum or Furthest-Neighbor Method)The dissimilarity between 2 groups is equal to the greatest dissimilarity between a member of cluster i and a member of cluster j. This method tends to produce very tight clusters of similar cases.
4. Single linkage clustering (Minimum or Nearest-Neighbor Method): The dissimilarity between 2 clusters is the minimum dissimilarity between members of the two clusters. This method produces long chains which form loose, straggly clusters.
5. Ward's Method: Cluster membership is assigned by calculating the total sum of squared deviations from the mean of a cluster. The criterion for fusion is that it should produce the smallest possible increase in the error sum of squares [5].
3.3
Density-Based Method
This method is based on the notion of density. The basic idea is to continue growing the given cluster as long as the density in the neighborhood exceeds some threshold, i.e., for each data point within a given cluster, the radius of a given cluster has to contain at least a minimum number of points[10].
Density Based method can be classified into three parts that are as follows:
i). DBSCAN: density based clustering method based on connected regions
It is density based clustering method for handling spatial data with noise in application or database. It uses the high density region for making the cluster, and the other regions which have low density are kept outside the cluster by marking as outlier. There is no need to define the number of clusters in advanced. By using the “Minpt” parameter it is able to find out the cluster which is totally different. “Density reachability” and “Density connectability” are the two concepts which are used during making the cluster which in turn have asymmetric and symmetric relation. “Minpt” and “ e “are the two parameters ,if point k contains more “Minp”t than the e-neighborhood then a new cluster with core object will be created, then the DBSCAN will gather the density reachable object from these core objects. When there are no new points that can be further added into the cluster than the DBSCAN process is turned off.
ii). OPTICS: ordering point to identify the clustering structure
© 2016, IRJET | Impact Factor value: 4.45 | ISO 9001:2008 Certified Journal | Page 1402
Reachability distance are needed define to ordering of objects in to the database. It is similar to DBSCAN but overcome one of the major weakness i.e density meaningful cluster in data of varying density.
iii). DENCLUE: (Clustering based on density distribution functions) DENCLUE use the density distribution function for making the clusters. It use the influence function which wedges the data point along with its neighborhood points. The points are arranged in the hill climbing manner where the points having the same local maximum are placed together into the cluster. But this hill climbing can create some error or problem as it may never coincide exactly to the maximum, just come close. DENCLUE have strong mathematical foundation and good properties which perform the arbitrarily shaped cluster in high dimensional data set with large amount of noise. Grid cell are used to maintain the data points information in tree like structure for faster performance [4].
3.4
Grid-Based Method
This method, the objects together form a grid and object space is quantized into finite number of cells that form a grid structure. The main pro is fast processing time and Its dependent only on the number of cells in each dimension in the quantized space [10].
There are two types of Grid based method as follows:
i. STINGS: statistical information grid
STINGS break the whole spatial area into rectangular cells. These rectangular cell promote tree like structure which give in return to other different level of resolution. Every cell is break into other cells at a high level to make the next lower level. This algorithm assumes that a query can be answered from the stored statistical information which is reciprocated in the tree. The upper part of the tree consists the entire space and the lower area or level have one leaf for each smallest cells. In this algorithm only vertical and horizontal boundaries are built. Scanning is done one time and all the parameters like, mean, variance, distribution are determined for each cell which makes it more efficient. Due to its grid like structure it perform incremental and parallel processing. Quality of clustering only depends on the granularity of the lowest level of the grid if lowest level is brutish then quality will decrease.
ii. WAVECLUSTER: clustering using wavelet Transformation
In this approach every grid cell encapsulate the information of points that is mapped into the cell. This pruned knowledge /information is then applied into the multiresolution wavelet transform for the cluster analysis. This multiresolution property helps in recognizing the varying level of accuracy. The relative distance between the points at different resolution is reciprocated into more distinguishable form for preservation by transforming the data through the wavelet transform. It uses the filters to find the frequency of signal or regions and automatically remove the outliers [4].
3.5
Model-Based Methods
In this method, a model is hypothesized for each cluster to find the best fit of data for a given model and locates the clusters by clustering the density function. It reflects spatial distribution of the data points and also provides a way to automatically determine the number of clusters based on standard statistics, taking outlier or noise into account to yields robust clustering methods [10]. It contains two method which are as follows:
i). EXPECTATION-MAXIMIZATION: EM is the most preferred iterative refinement method that is used to figure out the parameter estimates. Each cluster is defined by parametric probability distribution. Objects are assigned to cluster according to their mean value with some weight associated with objects. EM start with initial assumption of the parameter vector which is randomly choose on the basis of clusters mean value and then the expectation step and maximization step are applied for the distribution of the given data. EM is simple and easy to implement.
© 2016, IRJET | Impact Factor value: 4.45 | ISO 9001:2008 Certified Journal | Page 1403
In this method, the clustering is performed by the merging of user or application-oriented constraints. A constraint refers to the user expectation or the properties of desired clustering results. Constraints provide us with an interactive way of communication with the clustering process. Constraints can be specified by the user or the application requirement [10].
4
CONCLUSION
A large amount of data is obtainable on the internet so it is complicated for the users to find out the pertinent data from this enormous data that is using a method clustering to solve these types of problems. This paper discussed various types of clustering algorithm in data mining. This exertion is motivated us to extend the future techniques to related problems.
REFERENCES
[1]. Apurva Juyal, Dr. O. P. Gupta,” A Review on Clustering Techniques in Data Mining”, International Journal of Advanced Research in Computer Science and Software Engineering, Volume 4, Issue 7, July 2014 ISSN: 2277 128X © 2014, IJARCSSE. [2].Cheng-Fa Tsai, Han-Chang Wu, and Chun-Wei Tsai, ”A New Data Clustering Approach for Data Mining in Large Databases” . [3].Dr. Sankar Rajagopal,” CUSTOMER DATA CLUSTERING USING DATA MINING TECHNIQUE”, International Journal of
Database Management Systems ( IJDMS ) Vol.3, No.4, November 2011 DOI: 10.5121/ijdms.2011.3401 1.
[4].Kavita Nagar, ” Data Mining Clustering Methods: A Review “,International Journal of Advanced Research in Computer Science and Software Engineering, Volume 5, Issue 4, 2015 ISSN: 2277 128X.
[5].Mythili S1, Madhiya E2,” An Analysis on Clustering Algorithms in Data Mining”, International Journal of Computer Science
and Mobile Computing A Monthly Journal of Computer Science and Information Technology ISSN 2320–088X IJCSMC, Vol.
3, Issue. 1, January 2014, pg.334 – 340.
[6].Namrata S Gupta, 2Bijendra S.Agrawal, 3Rajkumar M. Chauhan,” Survey on Clustering Techniques of Data Mining”, American International Journal of Research in Science, Technology, Engineering & Mathematics, ISSN (Print): 2328-3491, ISSN (Online): 2328-3580, ISSN (CD-ROM): 2328-3629.
[7].T. Sajana, C. M. Sheela Rani and K. V. Narayana,” A Survey on Clustering Techniques for Big Data Mining”, Indian Journal of Science and Technology, Vol 9(3), DOI: 10.17485/ijst/2016/v9i3/75971, January 2016.
[8].Y Leela Sandhya Rani1, P Naga Deepthi2, Ch Rama Devi3,” Clustering Algorithm for Temporal Data Mining: An Overview” International Journal of Emerging Technology and Advanced Engineering Website: www.ijetae.com ,ISSN 2250-2459, ISO 9001:2008 Certified Journal, Volume 3, Issue 7, July 2013.
[9].Z. Abdullah, A. R. Hamdan,” Hierarchical Clustering Algorithms in Data Mining”,World Academy of Science, Engineering and Technology International Journal of Computer, Electrical, Automation, Control and Information Engineering Vol:9, No:10, 2015.
[10].https://www.tutorialspoint.com/data_mining/dm_cluster_analysis.htm.
[11]. https://sites.google.com/site/dataclusteringalgorithms/fuzzy-c-means-clustering-algorithm.