© 2017, IRJET | Impact Factor value: 5.181 | ISO 9001:2008 Certified Journal | Page 1223
Interpretive Structural Modeling based analysis for Critical Failure
Factors in ERP Implementation
Kavith K Das
1, Manjith Kumar B
21
Kavith K Das, M.Tech Student, Dept. of Production Engineering, GEC Trissur, Kerala, India
2
Dr. Manjith Kumar B, Associate Professor, Dept. of Production Engineering, GEC Trissur, Kerala, India
---***---Abstract -
Enterprise Resource Planning (ERP) systemhas received significant attention in the industries in the last two decades. However, not all ERP implementations have resulted in expected manner. There are some factors called Critical Failure Factors (CFFs) which influence the failure of ERP implementation. These factors not only affect the process of ERP implementation but may also influence each other. It is, therefore, important to understand their mutual relationships. Some factors adversely impact the process and results of ERP implementation. The aim of this paper is to find interrelationships among these factors based on the experience of implementation in a Footwear Manufacturing Company. The Interpretive Structural Modeling (ISM) methodology has been used to evolve mutual relationships among these critical failure factors. Required data for ISM methodology was collected from the ERP experts in the company. ISM methodology includes formation of Structural Self Interaction Matrix (SSIM), Reachability Matrix and Level partitioning to create the final model. MICMAC analysis was done to find the driving power and dependence of each factor. The result of this study shows that wrong ERP product selection, Ineffective implementation team and inappropriate business model are the strongest CFFs.
Key Words: Critical Failure Factors, ERP Implementation,
Interpretive Structural Modeling, ISM, MICMAC Analysis
1. INTRODUCTION
Enterprise resource planning (ERP) is business process management software that allows an organization to use a system of integrated applications to manage the business and automate many back office functions related to technology, services and human resources. However, not all ERP implementations have resulted in expected results. Factors which persuade the success and failure of the ERP may be called as Critical Success Factors (CSFs) or Critical Failure Factors (CFFs). These factors not only affect the process of ERP implementation but may also influence each other. The impact depends upon the degree of dependence between the factors. Hence for effective ERP Implementation, it is important to understand the mutual relationships between these factors.
Interpretive Structural Modeling (ISM) is a well-established methodology for identifying relationships
among specific items, which define a problem or an issue (Sage2). It uses the practical experience and knowledge of an expert in the area to break the complicated system into subsystems and construct multilevel model while solving problem.
2. LITERATURE REVIEW
ERP implementation in an organization is an important tool for process and performance improvement.ERP has been implemented throughout the world in different sectors and industries. With the implementation of ERP the organizations are able to experience better efficiency in their operations, enhanced production, faster deliveries to the customers, greater visibility across the supply chain, reduced safety stock levels and reduced inventory levels etc. These improvements are possible only if the organization is able to successfully implement the ERP system and all the employees are ready to use the ERP system. This is not a simple task as it requires a massive change in the way people were doing their day to day tasks. In past CFFs of ERP implementation has therefore provoked a lot of interest of many researchers from all over the world, in terms of understanding the critical factors, which led to the failure of the implementation. This literature review lists out the critical factors in ERP implementations as studied by the various authors.
Sawah et al.3 developed and empirically tested a model that investigates ERP implementation success as a function of interrelated CSFs extracted from literature with help of Egyptian case study which studied the factors: top management support, organizational fit for ERP package, companywide commitment, effective project management, user’s involvement and education, external support, organizational culture, and trust in the ERP community.
Akkermans and Helden4 conducted a study of ERP implementation in an aviation industry which highlighted interdepartmental collaboration and communication within the project team as one of the core processes for the success of the ERP implementation.
© 2017, IRJET | Impact Factor value: 5.181 | ISO 9001:2008 Certified Journal | Page 1224
perspective. Tactical success factors like ERP vendorsupport, enterprise-wide communication, user training and strategic success factors like business process reengineering, top management support, project management are positively related with the successful ERP implementation.
Nah and Delgado8 suggested seven categories of the CSFs across the four phases of ERP lifecycle. Project management, system analysis, ERP team composition, selection and technical implementation, skills and compensation, top management support, business plan and vision change management and communication are important factors.
3. RESEARCH OBJECTIVE
The main objectives of this paper are: To identify CFFs in ERP implementation.
To find out the interactions among the identified variables using Interpretive Structural Modeling. To propose structural model of CFFs in ERP
Implementation.
To analyze and categorize failure factors affecting ERP implementation in terms of Driving Power and Dependence.
To analyze and discuss the managerial suggestions of the research.
4. RESEARCH METHODOLOGY
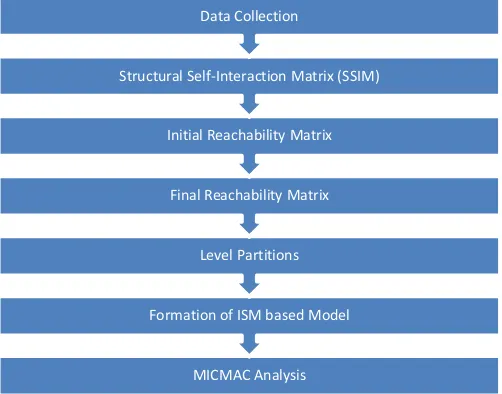
For this research work, a case study methodology was adopted. A footwear manufacturing company was selected as the target organization. The company had implemented ERP before and failed. Hence, the need for finding factors influencing the failure in implementation aroused. Determining the relationship among the CFFs in ERP implementation is a complex task, as it may have many linkages with one or the other factors. In such situations, ISM model is useful in constructing direct and indirect relationships among the said variables. The methodology followed in this paper is shown in figure 1.
4.1. Identification of CFFs
[image:2.595.309.560.101.298.2]An exhaustive literature review has been carried out, and expert opinions from the company as well as faculty member in the ERP domain were considered to identify variables that can be used for building the CFFs of ERP implementation model. Thus, thirteen critical failure factors have been identified, which are listed below:
Figure 1: Research Methodology
1. Wrong ERP product selection (F1) 2. Excessive customization (F2) 3. Poor quality of testing (F3) 4. Poor project management (F4) 5. Poor top management support (F5) 6. Users resistance to change (F6) 7. Lack of effective communication (F7) 8. Inadequate project team composition (F8) 9. Ineffective change management (F9) 10. Inadequate education and training (F10) 11. Inappropriate business model (F11) 12. Inaccurate data (F12)
13. Ineffective implementation team (F13)
4.2. ISM Methodology and Model Development
ISM was first proposed by Warfield in 1973 to analyze the complex socioeconomic systems. ISM helps to impose order and direction to a set of related variables and arrange them in a systematic hierarchical model known as structural model. ISM is an interactive learning process in which a set of different and directly related elements are structured into a comprehensive systematic model. The ISM methodology is based on the expert opinion and therefore the experts opine whether the variables are related to each other and the direction of the relationship. The various steps involved in the ISM methodology are discussed as follows:
a. Identification of factors: Identification of factors could be done with group problem solving technique like brain storming.
b. Contextual relationship: From the identified factors, a contextual relationship is identified among factors. A structural self-interaction matrix (SSIM) is prepared based on pair-wise comparison of factors.
MICMAC Analysis Formation of ISM based Model
Level Partitions Final Reachability Matrix Initial Reachability Matrix Structural Self-Interaction Matrix (SSIM)
© 2017, IRJET | Impact Factor value: 5.181 | ISO 9001:2008 Certified Journal | Page 1225
c. The SSIM is transformed into a binary matrix calledthe initial reachability matrix by substituting symbols used to denote direction of relationship, i.e V, A, X, O by 1 and 0.
d. Reachability matrix is then checked for transitivity. Transitivity is the basic assumption in ISM, which states that if a variable i is related j and j is related to k then i is necessarily related to k.
e. Partitioning of the reachabilty matrix into different levels on basis of reachability and antecedents sets for each variable through iterations called as level partitioning.
f. On the basis of reachabilty matrix and level partitioning, a canonical matrix is formed.
g. From the canonical matrix form of the reachability matrix, a directed graph is drawn by means of vertices or nodes and lines of edges and the transitive links are removed based on the relationships given above in the reachability matrix. The resultant digraph is converted into an ISM by replacing enabler nodes with statements.
4.3. Developing Structural Self Interaction Matrix
For analyzing the CFFs in developing SSIM, the following four symbols have been used to denote the direction of relationship between CFFs (i and j):
V: for the relation from element i to element j and not in both directions.
A: for the relation from element j to element i and not in both directions.
X: for both the directional relations from element i to element j and j to i.
O: if the relation between the elements did not appear valid.
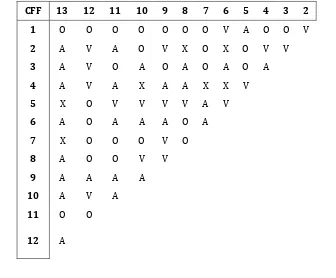
The results of the Self-Structural Interaction Matrix are given in Table 1.
4.4. Reachability Matrix
The SSIM format is transformed into initial reachability matrix format by transforming the information in each entry as per the following rules:
if the (i, j) entry in the SSIM is V, then the (i, j) entry in the reachability matrix becomes 1 and the (j, i) entry becomes 0
if the (i, j) entry in the SSIM is A, then the (i, j) entry in the reachability matrix becomes 0 and the (j, i) entry becomes 1
if the (i, j) entry in the SSIM is X, then the (i, j) entry in the reachability matrix becomes 1 and the (j, i) entry also becomes 1
if the (i, j) entry in the SSIM is O, then the (i, j) entry in the reachability matrix becomes 0 and the (j, i) entry also becomes 0.
[image:3.595.131.467.493.771.2]The initial reachability matrix formed is shown in Table 2.
Table 1: Structural Self Interaction Matrix
CFF 13 12 11 10 9 8 7 6 5 4 3 2
1 O O O O O O O V A O O V
2 A V A O V X O X O V V
3 A V O A O A O A O A
4 A V A X A A X X V 5 X O V V V V A V
6 A O A A A O A
7 X O O O V O 8 A O O V V 9 A A A A 10 A V A 11 O O
© 2017, IRJET | Impact Factor value: 5.181 | ISO 9001:2008 Certified Journal | Page 1226
Table 2: Initial Reachability MatrixCFF 1 2 3 4 5 6 7 8 9 10 11 12 13 1 1 1 0 0 0 1 0 0 0 0 0 0 0 2 0 1 1 1 0 1 0 1 1 0 0 1 0 3 0 0 1 0 0 0 0 0 0 0 0 1 0 4 0 0 1 1 1 1 1 0 0 1 0 1 0 5 1 0 0 0 1 1 0 1 1 1 1 0 1 6 0 1 1 1 0 1 0 0 0 0 0 0 0 7 0 0 0 1 1 1 1 0 1 0 0 0 1 8 0 1 1 1 0 0 0 1 1 1 0 0 0 9 0 0 0 1 0 1 0 0 1 0 0 0 0 10 0 0 1 1 0 1 0 0 1 1 0 1 0 11 0 1 0 1 0 1 0 0 1 1 1 0 0 12 0 0 0 0 0 0 0 0 1 0 0 1 0 13 0 1 1 1 1 1 1 1 1 1 0 1 1
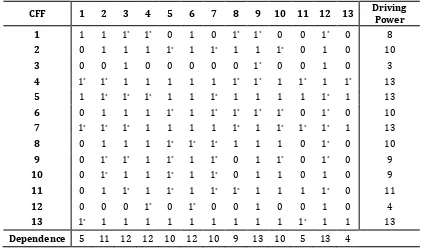
The initial reachability matrix is checked for transitivity rule as described in step d in section 4.2. If the transitivity rule is not found to be satisfied, the SSIM is reviewed and modified by specific feedback about transitivity relation from the experts. The driving power of a particular element is the total number of elements
including itself, which it may help to achieve. The dependence is the total number of elements which may help achieving it. The final reachability matrix is shown in Table 3 along with the driving power and dependence of each element.
Table 3: Final Reachability Matrix
CFF 1 2 3 4 5 6 7 8 9 10 11 12 13 Driving Power
[image:4.595.86.508.472.722.2]© 2017, IRJET | Impact Factor value: 5.181 | ISO 9001:2008 Certified Journal | Page 1227
4.5 Level Partition
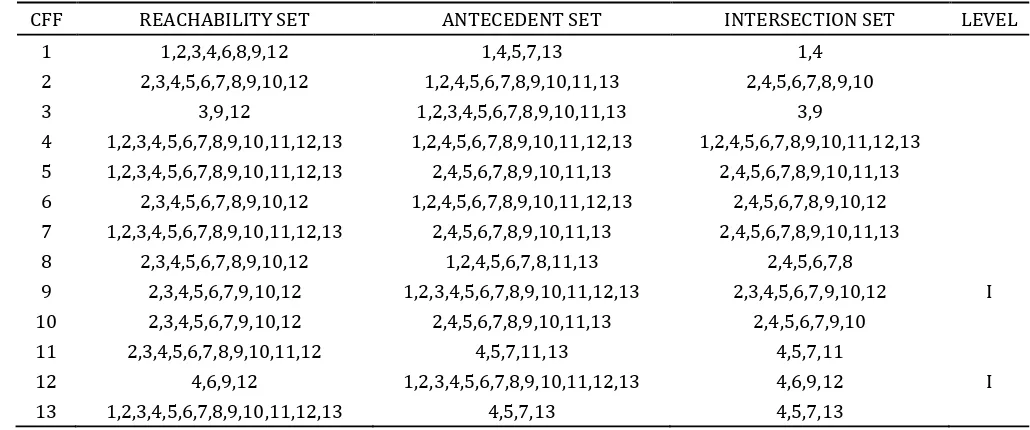
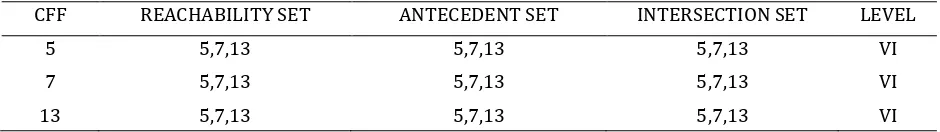
From final reachability matrix, reachability set and antecedent set for each CFF is found. The reachability set consists of the CFF itself and the other elements which it may help to achieve whereas the antecedent set consists of CFF itself and the other CFF which help in achieving it. The intersection of these sets is derived for all CFFs. The CFF for which the reachability and intersection sets are same, occupy the top level in the ISM hierarchy.
[image:5.595.36.551.254.469.2]The top level CFF in the ISM hierarchy would not help achieve any other CFF above its own level. Once the top level CFF is identified, it is separated out from the other CFFs. Then, the same process is repeated to find out the CFFs in the next level. This exercise is continued until the level of each CFF is found. These levels help in building the digraph (explained in section 4.6) and the final model. The level partitions in all iterations are shown in Tables 4, 5, 6, 7, 8 and 9.
Table 4: Level Partitioning (Iteration 1)
CFF REACHABILITY SET ANTECEDENT SET INTERSECTION SET LEVEL
1 1,2,3,4,6,8,9,12 1,4,5,7,13 1,4
2 2,3,4,5,6,7,8,9,10,12 1,2,4,5,6,7,8,9,10,11,13 2,4,5,6,7,8,9,10
3 3,9,12 1,2,3,4,5,6,7,8,9,10,11,13 3,9
4 1,2,3,4,5,6,7,8,9,10,11,12,13 1,2,4,5,6,7,8,9,10,11,12,13 1,2,4,5,6,7,8,9,10,11,12,13 5 1,2,3,4,5,6,7,8,9,10,11,12,13 2,4,5,6,7,8,9,10,11,13 2,4,5,6,7,8,9,10,11,13 6 2,3,4,5,6,7,8,9,10,12 1,2,4,5,6,7,8,9,10,11,12,13 2,4,5,6,7,8,9,10,12 7 1,2,3,4,5,6,7,8,9,10,11,12,13 2,4,5,6,7,8,9,10,11,13 2,4,5,6,7,8,9,10,11,13
8 2,3,4,5,6,7,8,9,10,12 1,2,4,5,6,7,8,11,13 2,4,5,6,7,8
9 2,3,4,5,6,7,9,10,12 1,2,3,4,5,6,7,8,9,10,11,12,13 2,3,4,5,6,7,9,10,12 I 10 2,3,4,5,6,7,9,10,12 2,4,5,6,7,8,9,10,11,13 2,4,5,6,7,9,10
11 2,3,4,5,6,7,8,9,10,11,12 4,5,7,11,13 4,5,7,11
12 4,6,9,12 1,2,3,4,5,6,7,8,9,10,11,12,13 4,6,9,12 I
[image:5.595.40.551.503.705.2]13 1,2,3,4,5,6,7,8,9,10,11,12,13 4,5,7,13 4,5,7,13
Table 5: Level Partitioning (Iteration 2)
CFF REACHABILITY SET ANTECEDENT SET INTERSECTION SET LEVEL
1 1,2,3,4,6,8 1,4,5,7,13 1,4
2 2,3,4,5,6,7,8,10 1,2,4,5,6,7,8,10,11,13 2,4,5,6,7,8,10
3 3 1,2,3,4,5,6,7,8,10,11,13 3 II
4 1,2,3,4,5,6,7,8,10,11,13 1,2,4,5,6,7,8,10,11,13 1,2,4,5,6,7,8,10,11,13 5 1,2,3,4,5,6,7,8,10,11,13 2,4,5,6,7,8,10,11,13 2,4,5,6,7,8,10,11,13
6 2,3,4,5,6,7,8,10 1,2,4,5,6,7,8,10,11,13 2,4,5,6,7,8,10
7 1,2,3,4,5,6,7,8,10,11,13 2,4,5,6,7,8,10,11,13 2,4,5,6,7,8,10,11,13
8 2,3,4,5,6,7,8,10 1,2,4,5,6,7,8,11,13 2,4,5,6,7,8
10 2,3,4,5,6,7,10 2,4,5,6,7,8,10,11,13 2,4,5,6,7,10
11 2,3,4,5,6,7,8,10,11 4,5,7,11,13 4,5,7,11
© 2017, IRJET | Impact Factor value: 5.181 | ISO 9001:2008 Certified Journal | Page 1228
Table 6: Level Partitioning (Iteration 3)CFF REACHABILITY SET ANTECEDENT SET INTERSECTION SET LEVEL
1 1,2,4,6,8 1,4,5,7,13 1,4
2 2,4,5,6,7,8,10 1,2,4,5,6,7,8,10,11,13 2,4,5,6,7,8,10 III
4 1,2,4,5,6,7,8,10,11,13 1,2,4,5,6,7,8,10,11,13 1,2,4,5,6,7,8,10,11,13 III 5 1,2,4,5,6,7,8,10,11,13 2,4,5,6,7,8,10,11,13 2,4,5,6,7,8,10,11,13
6 2,4,5,6,7,8,10 1,2,4,5,6,7,8,10,11,13 2,4,5,6,7,8,10 III
7 1,2,4,5,6,7,8,10,11,13 2,4,5,6,7,8,10,11,13 2,4,5,6,7,8,10,11,13
8 2,4,5,6,7,8,10 1,2,4,5,6,7,8,11,13 2,4,5,6,7,8
10 2,4,5,6,7,10 2,4,5,6,7,8,10,11,13 2,4,5,6,7,10 III
11 2,4,5,6,7,8,10,11 4,5,7,11,13 4,5,7,11
[image:6.595.66.536.332.441.2]13 1,2,4,5,6,7,8,10,11,13 4,5,7,13 4,5,7,13
Table 7: Level Partitioning (Iteration 4)
CFF REACHABILITY SET ANTECEDENT SET INTERSECTION SET LEVEL
1 1,8 1,5,7,13 1
5 1,5,7,8,11,13 5,7,8,11,13 5,7,8,11,13
7 1,5,7,8,11,13 5,7,8,11,13 5,7,8,11,13
8 5,7,8 1,5,7,8,11,13 5,7,8 IV
11 5,7,8,11 5,7,11,13 5,7,11
13 1,5,7,8,11,13 5,7,13 5,7,13
Table 8: Level Partitioning (Iteration 5)
CFF REACHABILITY SET ANTECEDENT SET INTERSECTION SET LEVEL
1 1 1,5,7,13 1 V
5 1,5,7,11,13 5,7,11,13 5,7,11,13
7 1,5,7,11,13 5,7,11,13 5,7,11,13
11 5,7,11 5,7,11,13 5,7,11 V
13 1,5,7,11,13 5,7,13 5,7,13
Table 9: Level Partitioning (Iteration 6)
CFF REACHABILITY SET ANTECEDENT SET INTERSECTION SET LEVEL
5 5,7,13 5,7,13 5,7,13 VI
7 5,7,13 5,7,13 5,7,13 VI
13 5,7,13 5,7,13 5,7,13 VI
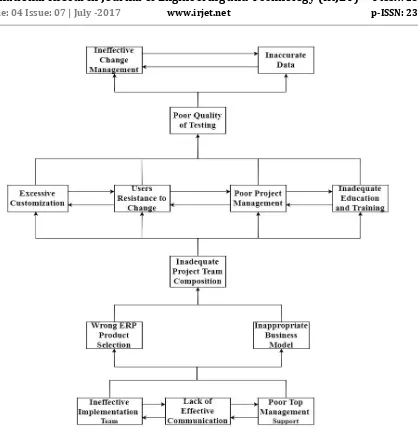
4.6 Formation of ISM Model
From the levels as identified in section 4.5, the Interpretive Structural Model is developed. If there is a relationship between the CFFs i and j, this is shown by an arrow which points from i to j. This graph is called a
[image:6.595.61.536.477.566.2] [image:6.595.63.533.600.666.2]© 2017, IRJET | Impact Factor value: 5.181 | ISO 9001:2008 Certified Journal | Page 1229
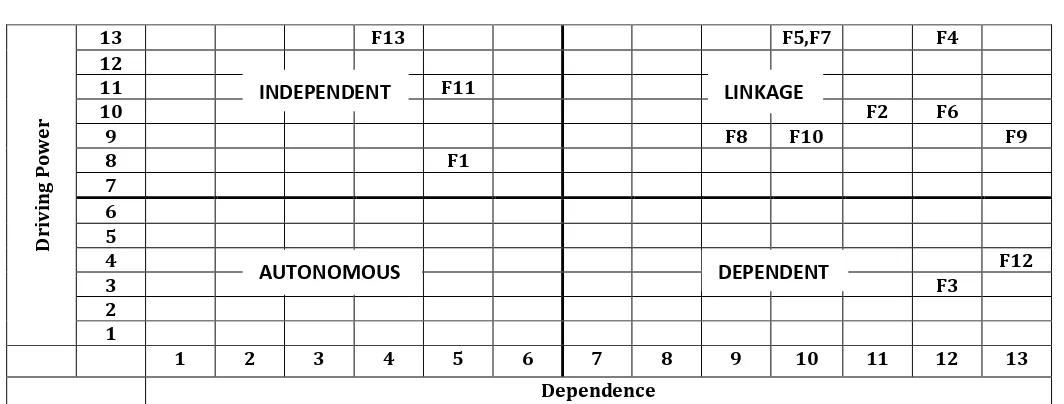
Figure 2: ISM Based model for CFFs in ERP Implementation4.7 MICMAC Analysis
A MICMAC analysis is carried out to classify the variables into various clusters based on the driving power and dependence of each variable that influence the implementation of ERP. Figure 3 shows the dependence and the driving power of factors. The factors in first cluster are called ‘Autonomous’ or ‘Excluded’ variables that have weak driving power and weak dependence. In the present study none of the factors is classified into this category. The second cluster is a group of ‘Dependent variables’ that have weak driving power and strong dependence. In our case ‘Poor quality of testing (F3) and Inaccurate data (F12)’ fall in this cluster. This indicates that it requires all other factors to come together to lead to the failure of ERP implementation. The third cluster is a group of ‘Linkage variables’ that have strong driving power and strong dependence. These factors are very influent and very dependent at the same time. They are otherwise known as relay
© 2017, IRJET | Impact Factor value: 5.181 | ISO 9001:2008 Certified Journal | Page 1230
D
rivin
g
Po
we
r
13 F13 F5,F7 F4
12
11 F11
10 F2 F6
9 F8 F10 F9
8 F1
7 6 5
4 F12
3 F3
2 1
1 2 3 4 5 6 7 8 9 10 11 12 13
[image:8.595.33.565.87.289.2]Dependence
Figure 3: MICMAC Analysis
the system depending on how much we can control them as a key factor. The analysis reveals that three factors such as ‘Wrong ERP product selection (F1), Ineffective implementation team (F13) and Inappropriate business model (F11)’ are ranked as independent variables as they have maximum driving power. This implies that these variables are key factors for the failure of ERP Implementation.
5. CONCLUSION
The relevant data from the target organization were interpreted and analyzed using ISM model and MICMAC analysis. A major finding of this research work is that “Wrong ERP product selection, Ineffective implementation team and Inappropriate business model” are the strongest CFFs, which have strong driving power as well as weak dependence and lie at the bottom of the ISM hierarchy. This can help the top management in deciding on the priority and focus on these variables, which would lead to a of successful ERP implementation.
When ISM model & MICMAC analysis results are linked, it has provided a valuable insight towards ERP implementation process. The several interesting findings of study and ISM model suggest that above mentioned prime CFFs along with ‘Lack of effective communication’ and ‘Poor top management support’ are the root cause of other CFFs and have great influence on other failure factors. On the other hand ‘Ineffective change management’ and ‘Inaccurate data’ are the factors with low driving power and high dependence. They are at the top of ISM model. According to their positions in the driving power and dependence diagram, these factors need serious attention and considerations in the process of successful implementation of ERP.
6. REFERENCES
[1] Chockalingam A, Ramayah T, “Does the organizational 1. culture act as a moderator in Indian enterprise resource planning (ERP) projects?”, Journal of Manufacturing Technology Management. 2012; 24(4):555–87.
[2] A.P. Sage, “Interpretive Structural Modeling: Methodology for Large-Scale Systems”, McGraw-Hill, New York, NY, 1977, pp. 91-164.
[3] Sawah SE, Tharwat A, Rasmy MH, “A quantitative model to predict the Egyptian ERP implementation success index”, Business Process Management Journal. 2008; 14(3):288–306.
[4] Akkermans H, Helden KV, “Vicious and virtuous cycles in ERP implementation: a case study of interrelations between critical success factors”, European Journal of Information Systems. 2002; 11:35–46.
[5] Dezdar S, “Strategic and tactical factors for successful ERP projects: insights from an Asian country”, Management Research Review. 2012; 35(11):1070– 87.
[6] Dezdar S, “Influence of tactical factors on ERP projects success”, 3rd International Conference on Advanced Management Science, IPEDR. 2011; 19:72–6.
[7] Dezdar S, Ainin S, “Examining ERP implementation success from a project environment perspective”, Business Process Management Journal. 2011; 17(6):919–39.
[8] Nah FF, Delgado S, “Critical Success Factors for enterprise resource planning implementation and upgrade”, Journal of Computer Information Systems. 2006; Special Issue:99–113.