5
XI
November 2017
A Study on the Measures for Improvement of the
Underground Drainage System
Veeravalli Srikanth1, Manchikanti Srinivas2
1, 2
Department of Civil Engineering, Gayatri Vidya Parishad College of Engineering (Autonomous), Visakhapatnam-530048, India
Abstract: The past years have seen significant changes in the way underground drainage systems are understood, planned and designed. Underground drainage system plays a very important role in development of a country, more so in a developing country like India. Hence, its significance is very high. Infrastructure of a country or a city depends on proper drainage and road network systems. Due to poor construction quality and poor maintenance of subsurface drainage system in some regions, it is very likely that the ground water may be contaminated resulting in hostile effect on the environment. The last decade has witnessed exceptional development with respect to infrastructure development all over country. This prompted to increased movement of people from villages to towns. By 2050, it is predicted that majority of world population will be living in cities. So, development of towns occurs at a very faster rate. All this will require an efficient underground drainage system so that the health and safety of citizens is ensured and the city or town looks decent and liveable. In this paper, a suburb called Madhurawada (of the Visakhapatnam city) is selected as the study area. It is proposed to improve the existing drainage system with better and adequate discharge capacities, to cater to the needs of an ever-growing population. Manual calculations are done for analysing the existing sewer network for Madhurawada area. Preliminary data like quantity of water supply, number of wards/ zones with their population details, topography and source of sewage are collected from the local municipal body - Greater Visakhapatnam Municipal Corporation (GVMC). Using the details provided by GVMC, manual calculations are done. The results obtained are compared with the existing drainage parameters and suitable changes to the existing drainage network are suggested and a new Sewage Treatment Plant (STP) is designed.
Keywords: Underground drainage system design; Spreadsheet software; Sewer network; STP design; Vehicle load calculation.
I. INTRODUCTION
The Underground Sewerage System has been designed with a propensity of modern generation towards health and sanitation and also their hatred to foul matter and pollutants. Due to the unfriendly nature of human waste, a drainage system should be “out of vision and out of sense”. Most of the drainage systems are actually concealed from the eyes (underground). It is hence vital that it must be of superior quality and should be able to work seemingly endless amount of time without leakage or deformities. It becomes awful and expensive to address such issues that emerge in ordinary underground pipelines unexpectedly, and which may happen because of poor item quality or because of faulty construction. It is strongly suggested for structures where hygiene is an important requirement. This paper discusses about the development and implementation and an efficient underground drainage system for Madhurawada region in Visakhapatnam (India). Visakhapatnam is one of the fastest developing cities in India and has been identified by the Ministry of Urban Development (Government of India), as one of the smartest cities to be developed under the Smart Cities Mission program, proposed in 2017 in the Union Cabinet and obtained approval for implementation. Visakhapatnam is a city with population tremendously increasing due to urbanization, improved medical facilities in the form of a large number of network hospitals, education hub, presence of SML (small, medium and large scale) industrial establishments and a special economic zone (SEZ). Hence, providing water and infrastructural facilities to the people is a main concern for the urban bodies, like the GVMC. Visakhapatnam is one of the most populated and largest cities in Andhra Pradesh and it has an area of 540 square kilometers. Visakhapatnam is famously served by a port which is one of the highest revenue generating ports in the country. The city is situated in the middle of the Eastern Ghats to its West and the Bay of Bengal to its East, State of Odisha verging on the North and Vizianagaram district and East Godavari district towards the South. The city's coordinates lie between 17.6868°N, 83.2185°E. GVMC provides 460 tanker (of drinking water) trips every day to those areas which do not have a proper capable pipe network in place.
II. LITERATURE REVIEW
and Hazen- Williams formula. In designing the collection system for Islampur(in India) town, GIS is used as a tool for mapping the collection system. Program logic control software program is used to swap the manual cleaning of drainage by a mechanical drain cleaner (Jiang and Zhang et al., 2014). For automatic control of sewage treatment, a mechanical semi-automatic drainage water cleaner was designed and implemented. It does not completely clean the sludge deposited in the drainage system. Based on a study conducted in Iran, minimum and maximum change of drainage parameters effect the change of volume of drain discharge. The volume of change in the discharge of drain for every 1% increase or decrease in each of drainage parameters was influenced by water level depth in the drain below the soil surface is equivalent to 3.0%. Depth of water level in the sewer below soil surface is introduced as the most effective parameter (Valipour et al., 2012). Mapping and Management of Sewerage System require a proper procedure for managing the sewerage system. Suggestions for ensuring the quality of drainage networks in Aurangabad (in India) were put forth, so as to improve the functional level of the drains acceptable to the users (Amol et al., 2016). Computer software X and Y are considered good to evaluate the velocities in pipes, drains and to produce the layout map for a zone in Tumkur(in India) city (Satish et al., 2015). Sewer system network, pumping station and wet/suction well were developed using Xand modelling and layout of sewerage network using Y. The individual results obtained from X software and manually calculated are compared for volume/volume percent ratio & diameter/diameter ratio. Manual on sewerage and sewage treatment by CPHEEO (Central Public Health and Environmental Engineering Organization) Manual (1993)provides objectives, planning and design of sewerage system, also shows design considerations, population estimate, design standards, limitations. It provides standard assumptions, tables, and design period for various systems. The sewer line, a basic unit in the design of a sewerage system, will change the overall cost of the sewerage system (Swameeet al., 2001). The present status of sewer line design uses linear and dynamic programming and provides the various formulae such as, diameter equation, depth equation, maximum velocity and discharge equation and optimization of the equations. Variousremedial measures are suggested based on minimum cover, self-cleansing velocity.
III. OBJECTIVES OF STUDY The following activities have been proposed.
Design of underground sewerage system. Design of Sewage Treatment Plant (STP). Location of Sewage Treatment Plant (STP).
A. Methodology
Underground drainage system (UGD)
Data collection
Tool adopted for design
Layout and arrangements
Location of STP
Manual calculation
Spread sheet software
B. Procedure
1) Preliminary data consists of the following
a) Geographic data
i) Population details
ii) Number ofhouseholds
iii) Boundary map of town
b) Geographical data
i) Rain fall data
ii) Water bodies information
iii) Soil conditions
c) Existing infrastructure data
i) Road networks
ii) Water supply dat
iii) Details of existing Storm Water Drain
iv) Existing underground drainage dat
v) Existing layout and zoning pattern
2) Secondary data consists of the following:
a) Potential for the development of the town
b) Problems concerning points of overflow
c) Manhole locations
C. Analysis of the Data
The analysis of the data is done for the selected area. According to the existing drainage conditions,the analysis of the remaining areasis also done. The extent to which the citizens will put to use the drainage facility effectively is studied.It is predicted that the new drainage system will be function effectively for the next35 years.
IV. STUDY AREA
Madhurawadais a major suburb of Visakhapatnam city in the Andhra Pradesh state. It is situated on the Visakhapatnam-Vizianagaram stretch of NH16 (National Highway-16)about 16km from Visakhapatnam city. Dr. Y. S. Rajasekhara Reddy ACA– VDCA cricket stadium,Visakhapatnam is also located in this suburb. This area consists of many well-developed areas like Pothinamallayya Palem, Mithilapuri VUDA colony, Revallapalem, Ganesh Nagar and Port colony. Madhurawada is one of the fastest developing areas in the city. Design of underground drainage is done for Vambay colony, Rajiv Gruhakalpa, Carpenters colony, Sivasakthinagar, APHB layout, Krishna nagar and Priyadarshini colony.
A. The parameters considered in the design are given below
Fig. 1.Population forecast of Madhurawada area
2) Rate of Water Supply: Wastewater quantity may be assumed to be 80% of the quantity (Punmia et al., 2009)of water supply. The drains must be designed for a minimum of 180 lpcd.
3) Slope/Gradient :Slope depends upon the topography of ground and levels. Slope is also another important parameter because the rate of flow depends upon the amount of slope.
Fig. 2.Ground profile of Vambey colony
0 1 2 3
2001 2011 2017 2021 2031 2041 2050
P O P U LA TI O N in la kh s YEAR 18215 26896 38586 49082 89572 163462 280892 54 53 52 49 46 45 57 56 53 53
55 55 55 55
50 48 47 48 52 30 35 40 45 50 55 60
3 5 7 9 10 11 13 15 17 20 23 25 27 28 31 34 35 39 40
[image:5.612.49.554.432.702.2]4) Peak Factor: In India, the CPHEEO (1991) has recommended following standards of peak factor based on population (Table. 1) for the design of water distribution system. The peak factor or the ratio of maximum to average flow depends upon the contributory population and the recommended values are given in Table 1. These peak factors will be applied to the estimated population for the design year considering an average wastewater flow based on allocation.
TABLE1. Peak Factor Table
S.No. Population Peak factor
1 Up to 20000 3.5
2 20000 to 50000 2.5
3 50000 to 750000 2.25
4 Above 750000 2.0
5) Velocity: The sanitary sewer is designed to achieve acceptable cleaning velocities at the average or at least at the maximum flow stream at the beginning of the design period for a given flow and slope. Velocity is slightly influenced by pipe diameter. A minimum velocity of 0.75 m/sec and maximum velocity of 3.00 m/sec is recommended.
6) Pipe Size: The pipe size should be decided on the basis of ultimate design peak flow and the allowable depth of flow. The minimum diameter of public sewer may be 150 mm. In hilly areas, where extreme slopes are prevalent, sewer size of 100 mm is also considered.
7) Depth of Cover :The cover on the pipeline is normally sufficient to protect the pipelines from external damage.
[image:6.612.205.412.150.239.2]8) Manholes:Manhole is a small covered opening in a paved area allowing access beneath, especially one leading to a sewer. Manholes are used to build connections and junction chambers.
V. VARIOUS POPULATION FORECASTING TECHNIQUES There aremanymethods for the population forecasting, suitableforthetown.9
A. Geometric Progression Method
In this method the rate increment is assumed to be the rate of growth and the average of the percentage increase is used to find out future increment in population. This expansion has to be done carefully and it requires huge experience and decision-making ability. This technique gives significantly higher values and mostly applicable for growing towns and cities having vast scope for expansion.
The formula used in this method is given below:
Pn = P1 x (1 + (i/100))n
where,
Pn= Population in the nthdecade
P1=Populationinthelatestdecade
n=Number ofdecades
i = Average percentage increment per decade
B. SampleCalculation (using the data from the current study)
Pn=2051,P1=163462,n=1, i = 73.28andPn=?
Pn = 1,63,462 x (1+73.28/100) 1
Pn= 2,84,064
VI. HYDRAULIC DESIGN
Manning’s equation is used most commonly for the design of sanitary sewers as it is efficient and popular. The values obtained from the Manning’s formula agree well with the experimental results of the current work.
The Manning’s Equation is given by,V = (1/n) x R (2/3)x S(1/2)
where,
V = Velocity in m/s n = Friction Factor
= 0.011 (for Plastic smooth pipe) = 0.013 (for Cement-concrete pipe)
R = Hydraulic Radius in metre (c/s area of flow in sq. m) S = Slope of Energy Grade Line
Wastewater = 80 % of water supply per person Sample Calculation (using the data from the current study)
Considering one primary line of sewer line of sewer,
A. Data
Population (P)=5325, Peak Factor (PF)=3.5,
Slope (S)= (56-53) /63.12 = 0.0476, Wastewater Quantity= 80%
Design Flow (Qd) and Velocity of Flow (V) =?
Qd= 5325 x3.5 x 180 x 0.8 = 0.008875m3/sec
Qfull=0.0310625m3/sec
Qfull= V x A
= (1/n) x (D/4) (2/3)
x S (1/2)
x (π/4) x D
2
V =1.661 m/sec
[image:8.612.139.478.115.324.2]VII. SEWER NETWORK LAYOUT PATTERN OF VAMBEY COLONY
Fig. 4.Sewer network pattern of Vambey colony
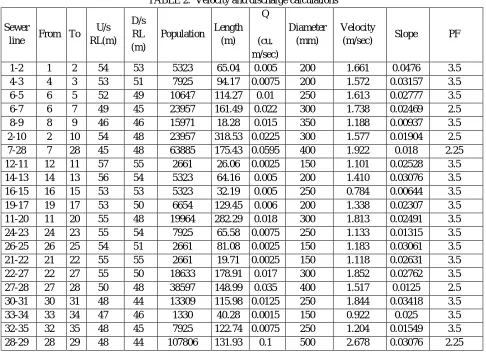
Same procedure and calculations of other lines of the network and all these lines of calculated values are shown in Table 2.
TABLE 2. Velocity and discharge calculations
Sewer
line From To
U/s RL(m)
D/s RL (m)
Population Length
(m)
Q
(cu. m/sec)
Diameter (mm)
Velocity
(m/sec) Slope PF
1-2 1 2 54 53 5323 65.04 0.005 200 1.661 0.0476 3.5
4-3 4 3 53 51 7925 94.17 0.0075 200 1.572 0.03157 3.5
6-5 6 5 52 49 10647 114.27 0.01 250 1.613 0.02777 3.5
6-7 6 7 49 45 23957 161.49 0.022 300 1.738 0.02469 2.5
8-9 8 9 46 46 15971 18.28 0.015 350 1.188 0.00937 3.5
2-10 2 10 54 48 23957 318.53 0.0225 300 1.577 0.01904 2.5
7-28 7 28 45 48 63885 175.43 0.0595 400 1.922 0.018 2.25
12-11 12 11 57 55 2661 26.06 0.0025 150 1.101 0.02528 3.5
14-13 14 13 56 54 5323 64.16 0.005 200 1.410 0.03076 3.5
16-15 16 15 53 53 5323 32.19 0.005 250 0.784 0.00644 3.5
19-17 19 17 53 50 6654 129.45 0.006 200 1.338 0.02307 3.5
11-20 11 20 55 48 19964 282.29 0.018 300 1.813 0.02491 3.5
24-23 24 23 55 54 7925 65.58 0.0075 250 1.133 0.01315 3.5
26-25 26 25 54 51 2661 81.08 0.0025 150 1.183 0.03061 3.5
21-22 21 22 55 55 2661 19.71 0.0025 150 1.118 0.02631 3.5
22-27 22 27 55 50 18633 178.91 0.017 300 1.852 0.02762 3.5
27-28 27 28 50 48 38597 148.99 0.035 400 1.517 0.0125 2.5
30-31 30 31 48 44 13309 115.98 0.0125 250 1.844 0.03418 3.5
33-34 33 34 47 46 1330 40.28 0.0015 150 0.922 0.025 3.5
32-35 32 35 48 45 7925 122.74 0.0075 250 1.204 0.01549 3.5
[image:8.612.64.550.382.735.2]38-39 38 39 55 52 13309 94.62 0.0125 250 1.731 0.02884 3.5
36-37 36 37 52 50 6654 63.48 0.0075 250 1.777 0.04918 3.5
39-40 39 40 52 45 29280 237.13 0.027 300 1.881 0.02666 2.5
29-40 29 40 44 45 121116 84.43 0.0916
6 500 2.139 0.01562 2.25
VIII. VEHICLE LOAD CALCULATION Wsd=Cs x p x Bc x Ie
where Wsd= load on conduit (t/m)
P= intensity of uniform distributed load(kg/m2)
Ie= impact factor = 1.5 for highway traffic and air-filled taxiways Bc= outside width of conduit= D+2t
Cs= load efficient, which is a function of Bc/2H and L/2H H = height of surface over the top of conduit
Width of trench,Bd=1.5 m
As per IRC (Indian Roads Congress) under critical case wheel load of 6.25 tons (and wheel area of 300mm x 150mm) is given
P = 6.25/ (0.3 x0.15) = 138.89 t/m2
Depth= 3 m
Outside width of conduit, Bc= D+2t =500+160= 660 mm =0.660m H = 3-0.66 = 2.34 m
Bc/2H= 0.66/ (2 x2.34) = 0.141 L/2H= 1/2.34 = 0.42
CS = 0.067
Impact factor Ie=1.5 Load on conduit,
Wsd = Cs x P x Bc x Ie = 0.067 x 138.89 x 0.66 x 1.5 = 9.219 t/m
IX. SEWAGE TREATMENT PLANT
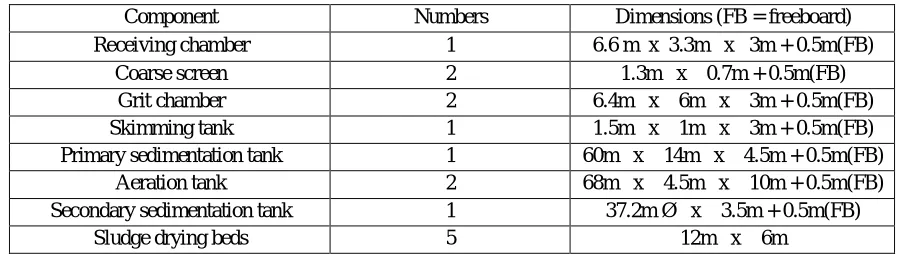
[image:9.612.80.530.590.717.2]Sewage treatment plant consist of physical, chemical, and biological procedures to remove these pollutants and impurities and produce environmentally safe treated wastewater. The plant is designed so well to meet the future development for the next 35 years. The plant designed with all the components of STP from receiving chamber, screening chamber, grit chamber, skimming tank, sedimentation tank, secondary clarifier, aeration tank and sludge drying beds. Capacity of STP to be provided is 30.4 MLD
TABLE 3.STP dimensions
Component Numbers Dimensions (FB = freeboard)
Receiving chamber 1 6.6 m x 3.3m x 3m + 0.5m(FB)
Coarse screen 2 1.3m x 0.7m + 0.5m(FB)
Grit chamber 2 6.4m x 6m x 3m + 0.5m(FB)
Skimming tank 1 1.5m x 1m x 3m + 0.5m(FB)
Primary sedimentation tank 1 60m x 14m x 4.5m + 0.5m(FB)
Aeration tank 2 68m x 4.5m x 10m + 0.5m(FB)
Secondary sedimentation tank 1 37.2m Ø x 3.5m + 0.5m(FB)
X. RESULTS
In this paper, one part of the work is design of sewerlines and another part is STP design and its location. The main purpose of this paper is to design an underground drainage system for Madhurawada, along with sewage treatment plant for treatment of collected sewage. The total length of sewerline is 18 km. The range of diameters of sewerlines is about 150 – 600mm. The capacity of sewage treatment plant is 30.4 MLD (million litres per day).
XI. CONCLUSIONS
A. From the available population data of Madhurawada from year 1971 to 2011, the population growth rate is 6.2% and
forecasted population in 2051 is nearly 2,84,064.
B. Total length of sewerline obtained is 18 km.
C. The proposed new underground sewerage system is badly required due to increasingpopulation, as the existing drainage
system is inadequate. With most of the existing drains being open drains, more often than not, sewage overflows, creating unsightly conditions and diseases. Hence, as per analysis and design, the total sewage generated by all STPs is about 30.4 MLD.
D. One STP is proposed for collection of wastewater and is to be provided near the sea for easy disposal of treated waste and
water.
X. ACKNOWLEDGMENT
The authors are very grateful to GayatriVidyaParishad College of Engineering (Autonomous) which provided us this wonderful opportunity to carry out the current work and for providing encouragement to write this paper. The authors are thankful to UNDERGROUND DRAINAGE department of GREATER VISAKHA MUNICIPAL CORPORATION (GVMC) for the encouragement and technical support extended by them.
REFERENCES
[1] CPHEEO, “Engineering Manual on Sewerage and Sewage Treatment System”, Central Public Health and Environmental Engineering Organization, 1998 DevendraPandey, PradeepKundal and Yaswant B. Katpatal, “Urban storm water management for Gondia city for sustainable development using GIS and MATLAB”, International Journal of Recent Scientific Research, Vol. 6, No. 1, pp. 2630-2635, 2015
[2] Greater Visakhapatnam Municipal Corporation https://www.gvmc.gov.in
[3] JagadeeswaraRao P, Harikrishna P, Srivastav S K,Satyanarayana P V V&Vasu Deva Rao B, “Selection of groundwater potential zones in and around Madhurawada, Visakhapatnam District - A GIS approach”,J. Ind. Geophysics. Union, Vol.13, No.4, pp.191-200, 2009.
[4] Jang, S., Roesner, L. and Park, D., “Development of Urban Storm Sewer Optimal Layout Design Model Considering Risk”, World Environmental and Water Resource Congress, Omaha, pp. 1-10, 2006.
[5] Muragesh S K and SanthoshaRao, “Automated Internet of Things for Underground Drainage and Manhole Monitoring System for Metropolitan Cities”, International Journal of Information & Computation Technology, Vol. 4, No. 12, pp. 1211-1220 2014.
[6] Otti V. I., Ejikeme, I. R., Nwafor, A.U., “The Environmental Effects of the Drainage System and Flood Control in Awka Urban City”, International Journal of Engineering and Technology, Vol. 3, No. 1, pp. 28-33, 2013.
[7] Patil J. A, Kulkarni S. S., “Design and Mapping of Underground Sewerage Network in GIS - A Case Study of Islampur Town”, International Journal of Science and Research, Vol. 3, No. 8, pp. 424-431, 2014.
[8] Rushikumar R Prajapati, Neha M Joshipura, Bhavin Patel, “Design of Underground Drainage for Anklav Town”, International Journal for Scientific Research & Development, Vol. 4, No. 4, pp. 735-739, 2016.
[9] Shruthi S Kannur, SantoshPatil, Satish S Kannur, Hydraulic “Design & Analysis of Underground Drainage System: for a Zone in Tumkur City”, International Research Journal of Engineering and Technology, Vol. 2, No. 5, pp. 326-332, 2015.
[10] ValipourMohammad,“Effect of Drainage Parameters Change on Amount of Drain Discharge in Subsurface Drainage Systems”, Journal of Agriculture and Veterinary Science, Vol. 1, No. 4, pp. 10-18, 2012.