Technology (IJRASET)
Multi-Response Optimization of Process
Parameters Based On MRSN for D2 Steel Using
WEDM Process with Plain Brass Wire and Zinc
Coated Brass Wire
Amanpreet Singh1, Hiralal Bhowmick2 1,2
Mechanical Engineering Department Thapar University, Patiala
Abstract- Wire Electrical Discharge Machining plays an important role in precision machining. The material removal rate, higher the best and surface finish, lower the best, are mostly required as output response. But it is a well known fact that both can’t be achieved simultaneously. In this study multi response signal noise (MRSN) method is used to optimize different process parameters for material removal rate surface roughness using different weightage for both. Hardened D2 steel is used as workpiece because of its high application in industries. The L18 mixed orthogonal array is used to perform experiments and ANOVA is used to find contribution and significance of different process parameters. Plain brass wire and zinc coated wire are used to perform experiments. Confirmatory experiments are performed at optimum levels and percentage error or change is calculated to draw conclusions about design of research.
Keyword-: ANOVA, MRR, SR, MRSN, optimization, coated wires, L18 OA.
I. INTRODUCTION
Wire Electrical Discharge Machining is an operation in which material is eroded by successive electric sparks generated by current supply. Copper, brass, molybdenum etc. conducting materials are used in wire form as tool electrode. Dielectric liquid generally ionized water is used in WEDM [1]. The high heat generation results in melting and vaporizing of the tool and work piece. Heat
generated at each electrical spark is around 8000 0C to 12000 0C. The WEDM is largely used in manufacturing dies and moulds. The
WEDM’s CNC system has the capability to control movement of wire and perform machining at high accuracy. The wire diameter ranges from 0.05 to 0.35 mm. The intricate shapes and smaller corner radii can be achievable with very thin wires. There is no mechanical stress induced during machining process as wire does not touch the workpiece. [2]. The WEDM is an exceptional machining process for manufacturing of tough material parts that are highly challenging to machine by traditional machining
processes. Mostly, the wires are used only once for machining and discarded after use. [3] According to Liao and Huang [4], feed
rate and pulse time on have major impact in material removal and pulse time on has major impact on surface roughness on
machining of SKD11 alloy in WEDM. The experiments were operated using Taguchi’s L18 mixed array. Ramakrishnan and Karunamoorthy [5] conducted experiments on heat treated D2 steel material with zinc coated brass wire on WEDM. Taguchi’s L16 OA was used to perform experiments having five input parameters on machining parameters and results were analyzed by MSRN
and ANOVA methods. It has been found that TON and IP have influenced more than any other parameters on MRR, SR and wire
wear ratio. Mahapatra and Patnaik [6] investigated various interactions between factors and their individual effects on maximization of MRR and surface finish and found that current, pulse on time, dielectric flow rate and their interactions have influenced more than other factors. Dhobe et al. [7] conducted experiments on WEDM on D2 single tempered and double tempered
to find effects of input parameters on surface roughness. It was observed Surface roughness rises with rise in Ton and Ip, decreases
with rise in Toff and Sv. It was found that double tempered steel after hardening has less surface roughness compared to single
tempered. Mann and Chaudhary [8] investigated the outcomes of four process variables of WEDM on the MRR and surface
roughness (Ra). RSM and ANOVA methodology was used to analyze performance parameters and found Ton, Toff, Sv have maximum
influence on MRR and Ton, Toff have significant effect on Ra and Ip in MRR, Sv in Ra are very less influencing. Ikram et al. [9]
conducted experiments for optimization of eight control factors including flush pressure and material thickness to measure their
Technology (IJRASET)
significant factors were Ton, Sv. Material thickness doesn’t have significant effect in either case. Patil and Waghmare [10] conducted
experiments on Sodick WEDM to examine the conditions for maximum material removal rate (MRR) with the response surface methodology (RSM) approach. The material selected was D2 steel and electrode used was brass wire. RSM approach was applied on three factors viz., pulse time on, peak current and wire tension each at three levels. It was observed that peak current was more significant than pulse on time and wire tension were less significant for material removal rate. Bhatia et al. [11] studied the effect of four process variables on SR in WEDM. D2 steel workpiece was selected with brass wire as electrode. Taguchi’s L9 OA was
applied to form experimentation design. The process variables were IP, TON, TOFF and wire tension (WT), each at three levels. S/N
ratio and ANOVA techniques were used to analyze the data for surface roughness. The results showed that pulse off time has greater contribution in attaining less surface roughness. Optimum parameters were selected from S/N ratio values for lesser surface roughness. Predicted value was calculated for selected parameters and confirmation experiments showed error of 3.93%.
II. MATERIALANDMETHOD
The hardened AISI D2 alloy steel plate of 130mm × 133mm × 10mm size has been used as work piece for experiments. It is a high carbon high chromium alloy tool steel. D2 steel has high wear resistance. It has hardness in the range of 56-62 HR. It acquires mild corrosion resisting properties because of high content of chromium. Its chemical composition properties are as C; 1.52%, Si; 0.37, Mn; 0.40%, P; 0.04%, S; 0.062, Cr; 12%, Mo; 0.56% and V; 0.18%. It has various applications as manufacturing of stamping or forming dies, shear blades and tools. Steel Blank is undergone the vacuum heat treatment process for enhancement of material
properties such as hardness. At this process with 6 bar nitrogen gas quenching a cooling speed from austenitising temperature 9800C
to 5200C of 280C/min in the surface was achieved to obtain a hardness of 62 HRC or 748HV1.
[image:3.612.200.454.410.601.2]Two types of wires are used for experimentation viz. plain brass wire (0.25 mm diameter, Cu 65%, Zn 35%) and zinc coated brass wire (0.25 mm diameter, Cu 65%, Zn 35% and Zinc coating 5 µm). The Brass wire has high tensile strength as well as high electrical conductivity. Copper wires have high conductivity than brass but lesser tensile strength restricts their use in industries due to chances of breakage on high tension. Stratified wire or coated wires can also be used for better machining. According to literature review, very less work has been done by using stratified wires in WEDM process.
Figure 1: WEDM [Photo courtesy: Aman Metal Products, Ludhiana]
The experiments were conducted on Electra Sprintcut 734 WEDM (figure 1). It is a rough cut operation in which both MRR and SR have equal importance. The input parameters are chosen by proper pilot study experimentation on D2 steel by varying individual factor at a time. Taguchi’s L18 mixed OA is used for design the experiments layout. Minimum levels for parameters selected are
three to find true influence of response parameters. One parameter i.e. peak current (IP) is varied to six levels to examine its effect
Technology (IJRASET)
roughness for each sample Material Removal Rate is calculated according Eq. (1). The kerf width is calculated using Nikon Profile Projector. Cutting speed is obtained from the display screen of WEDM.
= × ×
(1) Where;
MRR= Material Removal Rate (mm3/min)
[image:4.612.104.513.219.304.2]=Cutting Speed (mm/min) =Thickness of workpiece (mm) =Kerf Width (mm)
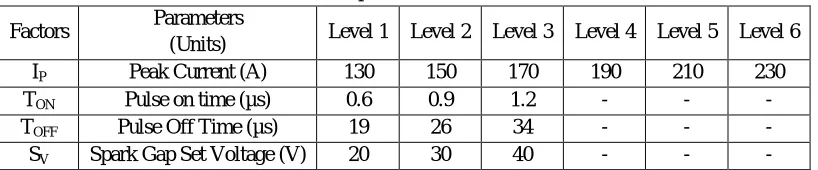
Table 1: Process parameters with level values
Factors Parameters
(Units) Level 1 Level 2 Level 3 Level 4 Level 5 Level 6
IP Peak Current (A) 130 150 170 190 210 230
TON Pulse on time (µs) 0.6 0.9 1.2 - - -
TOFF Pulse Off Time (µs) 19 26 34 - - -
SV Spark Gap Set Voltage (V) 20 30 40 - - -
The main aim of the present study is to examine the surface topography and performing the multiple response optimization with multi response signal noise (MRSN) method. Multi-objective optimization is method to find out optimum levels of parameters which give desired results for two or more than two machining performance parameters. These levels affect the results of more than one response. In this section, multi-objective optimization is done on two machining performances. As material removal rate and surface roughness are the most desired outputs of any manufacturing process, both have taken for the optimization. To make the optimization economical, equal importance is given to both machining parameters. Multi objective optimization is done using multi response signal noise ratio (MRSN). MRSN is a method designed by Taguchi to optimize multi response characteristics. Since, most of the output response characteristics have different measurement unit and different group in S/N ratio calculations, so it is not possible to perform analysis. MRSN method includes following steps to perform multi objective characterization [Gaitonde et al., 2006].
Step 1- Calculate the loss function (Lij). For smaller the better, Eq. (2)
=1
(2) For larger is better, Eq. (3)
= ∑ (3)
where, n is the no. of repeated experiments. (Lij) is loss function of the ith performance characteristic in the jth experiment. Yijkis the experimental value of the ith performance characterizes in the jth experiment at the kth test.
Step 2- Calculate normalized quality loss i.e. Nij as described in Eq. (4)
= ∗
(4)
Where; ∗= ∑
Step 3- Eq. (5) describes the total loss function (TLj). Weights are applied according to the priority of each normalized loss function.
This method defines the importance of every response characteristic.
Technology (IJRASET)
(5)
Where, Wi is the weighting factor, p is the total number of quality characteristics.
Step 4- The overall S/N ratio is calculated in this step to perform multi-objective optimization. This overall S/N ratio is known as multiple response S/N ratio (MRSN). The calculation method multiple response S/N ratio (MRSN) is described in Eq. (6):
=−10 log ( )
(6)
III.RESULTSANDDISCUSSIONS
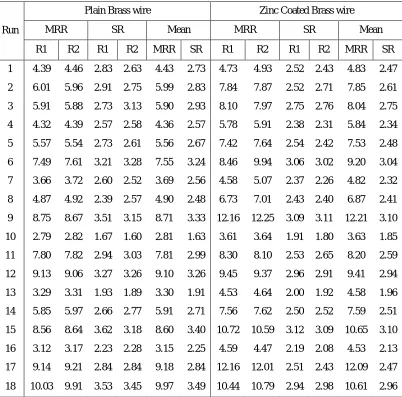
Table 2 shows the mean values for material removal rate (mm3/min) and surface roughness (µm) obtained when workpiece is
[image:5.612.107.509.257.654.2]machined with both wires.
Table 2: Result values for MRR & SR (Plain brass and Zinc coated wires)
Run
Plain Brass wire Zinc Coated Brass wire
MRR SR Mean MRR SR Mean
R1 R2 R1 R2 MRR SR R1 R2 R1 R2 MRR SR
1 4.39 4.46 2.83 2.63 4.43 2.73 4.73 4.93 2.52 2.43 4.83 2.47
2 6.01 5.96 2.91 2.75 5.99 2.83 7.84 7.87 2.52 2.71 7.85 2.61
3 5.91 5.88 2.73 3.13 5.90 2.93 8.10 7.97 2.75 2.76 8.04 2.75
4 4.32 4.39 2.57 2.58 4.36 2.57 5.78 5.91 2.38 2.31 5.84 2.34
5 5.57 5.54 2.73 2.61 5.56 2.67 7.42 7.64 2.54 2.42 7.53 2.48
6 7.49 7.61 3.21 3.28 7.55 3.24 8.46 9.94 3.06 3.02 9.20 3.04
7 3.66 3.72 2.60 2.52 3.69 2.56 4.58 5.07 2.37 2.26 4.82 2.32
8 4.87 4.92 2.39 2.57 4.90 2.48 6.73 7.01 2.43 2.40 6.87 2.41
9 8.75 8.67 3.51 3.15 8.71 3.33 12.16 12.25 3.09 3.11 12.21 3.10
10 2.79 2.82 1.67 1.60 2.81 1.63 3.61 3.64 1.91 1.80 3.63 1.85
11 7.80 7.82 2.94 3.03 7.81 2.99 8.30 8.10 2.53 2.65 8.20 2.59
12 9.13 9.06 3.27 3.26 9.10 3.26 9.45 9.37 2.96 2.91 9.41 2.94
13 3.29 3.31 1.93 1.89 3.30 1.91 4.53 4.64 2.00 1.92 4.58 1.96
14 5.85 5.97 2.66 2.77 5.91 2.71 7.56 7.62 2.50 2.52 7.59 2.51
15 8.56 8.64 3.62 3.18 8.60 3.40 10.72 10.59 3.12 3.09 10.65 3.10
16 3.12 3.17 2.23 2.28 3.15 2.25 4.59 4.47 2.19 2.08 4.53 2.13
17 9.14 9.21 2.84 2.84 9.18 2.84 12.16 12.01 2.51 2.43 12.09 2.47
18 10.03 9.91 3.53 3.45 9.97 3.49 10.44 10.79 2.94 2.98 10.61 2.96
Technology (IJRASET)
Table 3: MRSN values Plain Brass wire
Run
Plain Brass Wire Zinc Coated Brass Wire
Lij Nij= / ∗ Lij Nij= / ∗
MRR SR MRR SR MRR SR MRR SR
1 0.051 7.436 1.224 0.935 0.043 6.115 1.735 0.917
2 0.028 8.001 0.669 1.006 0.016 6.821 0.655 1.023
3 0.029 8.625 0.689 1.084 0.015 7.563 0.626 1.134
4 0.053 6.605 1.263 0.830 0.029 5.488 1.185 0.823
5 0.032 7.133 0.776 0.897 0.018 6.142 0.713 0.921
6 0.018 10.515 0.420 1.322 0.012 9.227 0.487 1.383
7 0.073 6.542 1.759 0.823 0.043 5.362 1.750 0.804
8 0.042 6.134 1.000 0.771 0.021 5.820 0.858 0.873
9 0.013 11.106 0.316 1.396 0.007 9.595 0.271 1.439
10 0.127 2.658 3.045 0.334 0.076 3.435 3.071 0.515
11 0.016 8.912 0.393 1.121 0.015 6.712 0.601 1.006
12 0.012 10.644 0.290 1.338 0.011 8.615 0.456 1.292
13 0.092 3.639 2.200 0.458 0.048 3.833 1.925 0.575
14 0.029 8.324 0.686 1.047 0.017 6.288 0.702 0.943
15 0.014 11.590 0.324 1.457 0.009 9.626 0.356 1.443
16 0.101 5.075 2.422 0.638 0.049 4.550 1.973 0.682
17 0.012 8.037 0.285 1.011 0.007 6.103 0.277 0.915
18 0.010 12.182 0.241 1.532 0.009 8.762 0.359 1.314
L∗ (MRR) =0.042, L∗ (SR) =7.953 (Plain Brass wire)
L∗
(MRR) =0.025, L∗
[image:6.612.66.548.476.739.2](SR) =6.670 (Zinc coated brass wire)
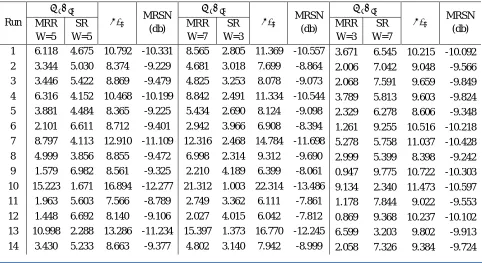
Table 4: MRSN values brass wire
Run MRSN
(db) MRSN (db) MRSN (db) MRR W=5 SR W=5 MRR W=7 SR W=3 MRR W=3 SR W=7
1 6.118 4.675 10.792 -10.331 8.565 2.805 11.369 -10.557 3.671 6.545 10.215 -10.092
2 3.344 5.030 8.374 -9.229 4.681 3.018 7.699 -8.864 2.006 7.042 9.048 -9.566
3 3.446 5.422 8.869 -9.479 4.825 3.253 8.078 -9.073 2.068 7.591 9.659 -9.849
4 6.316 4.152 10.468 -10.199 8.842 2.491 11.334 -10.544 3.789 5.813 9.603 -9.824
5 3.881 4.484 8.365 -9.225 5.434 2.690 8.124 -9.098 2.329 6.278 8.606 -9.348
6 2.101 6.611 8.712 -9.401 2.942 3.966 6.908 -8.394 1.261 9.255 10.516 -10.218
7 8.797 4.113 12.910 -11.109 12.316 2.468 14.784 -11.698 5.278 5.758 11.037 -10.428
8 4.999 3.856 8.855 -9.472 6.998 2.314 9.312 -9.690 2.999 5.399 8.398 -9.242
9 1.579 6.982 8.561 -9.325 2.210 4.189 6.399 -8.061 0.947 9.775 10.722 -10.303
10 15.223 1.671 16.894 -12.277 21.312 1.003 22.314 -13.486 9.134 2.340 11.473 -10.597
11 1.963 5.603 7.566 -8.789 2.749 3.362 6.111 -7.861 1.178 7.844 9.022 -9.553
12 1.448 6.692 8.140 -9.106 2.027 4.015 6.042 -7.812 0.869 9.368 10.237 -10.102
13 10.998 2.288 13.286 -11.234 15.397 1.373 16.770 -12.245 6.599 3.203 9.802 -9.913
Technology (IJRASET)
15 1.619 7.287 8.906 -9.497 2.267 4.372 6.639 -8.221 0.972 10.201 11.173 -10.482
16 12.110 3.190 15.301 -11.847 16.955 1.914 18.869 -12.757 7.266 4.466 11.733 -10.694
17 1.423 5.053 6.476 -8.113 1.992 3.032 5.024 -7.010 0.854 7.074 7.928 -8.991
18 1.205 7.658 8.863 -9.476 1.687 4.595 6.282 -7.981 0.723 10.722 11.445 -10.586
The factor with p-value less than .05 is counted significant due to 95% confidence level taken during analysis. ANOVA calculations
show the percentage contribution of factors variation in case for MRSN plain brass wire (Weightage MRR, W=5, SR, W=5) as Ton
(76.77%), Toff (12.81%) are significant and Ip (2.63%), Sv (0.59%)are the non significant factors, (Weightage MRR, W=7, SR,
W=3) as Ton (78.68%), Toff (14.76%) are significant and Ip (2.13%), Sv (2.06%)are the non significant factors and (Weightage MRR,
W=3, SR, W=7) as Ton (67.97%) is significant and Toff (2.33%) , Ip (5.66%), Sv (5.01%)are the non significant factors. According to
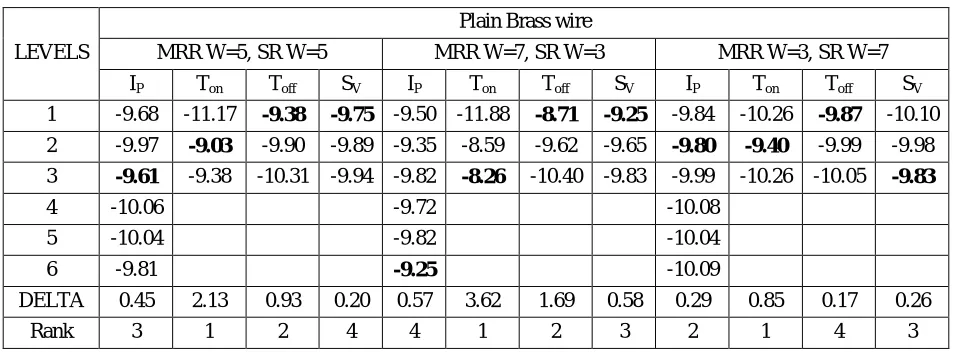
[image:7.612.68.547.289.468.2]delta statistics described in Table 5 ranks are assigned to the factors as per their significance value. The delta value is obtained by subtracting smaller value from the larger value for each factor and ranks are assigned accordingly. Highest delta value got the highest rank. The optimum parameters are selected by selecting levels (marked bold in table 5) having high value of S/N ratio for each parameter from response tables.
Table 5: Delta Statistics table of Response values for MRSN Ratio
LEVELS
Plain Brass wire
MRR W=5, SR W=5 MRR W=7, SR W=3 MRR W=3, SR W=7
IP Ton Toff SV IP Ton Toff SV IP Ton Toff SV
1 -9.68 -11.17 -9.38 -9.75 -9.50 -11.88 -8.71 -9.25 -9.84 -10.26 -9.87 -10.10
2 -9.97 -9.03 -9.90 -9.89 -9.35 -8.59 -9.62 -9.65 -9.80 -9.40 -9.99 -9.98
3 -9.61 -9.38 -10.31 -9.94 -9.82 -8.26 -10.40 -9.83 -9.99 -10.26 -10.05 -9.83
4 -10.06 -9.72 -10.08
5 -10.04 -9.82 -10.04
6 -9.81 -9.25 -10.09
DELTA 0.45 2.13 0.93 0.20 0.57 3.62 1.69 0.58 0.29 0.85 0.17 0.26
Rank 3 1 2 4 4 1 2 3 2 1 4 3
Prediction for MRSN with optimal parameters
The high value for MRSN can be predicted from following equation using optimum levels of parameters. The MRSN values at optimal levels are taken from Table 5. Eq. 7, 8 & 9 describe the calculation for MRSN with plain brass wire at optimal levels for significant factors.
Weightage MRR W=5, SR W=5
α = + − μ (7)
α =−8.54 db
Weightage MRR W=7, SR W=3
α = + − μ (8)
α =−7.4 db
Weightage MRR W=3, SR W=7
α = (9)
Technology (IJRASET)
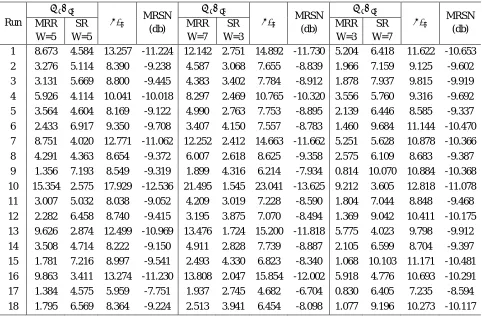
Table 6: MRSN values Zinc coated brass wire
Run MRSN
(db) MRSN (db) MRSN (db) MRR W=5 SR W=5 MRR W=7 SR W=3 MRR W=3 SR W=7
1 8.673 4.584 13.257 -11.224 12.142 2.751 14.892 -11.730 5.204 6.418 11.622 -10.653
2 3.276 5.114 8.390 -9.238 4.587 3.068 7.655 -8.839 1.966 7.159 9.125 -9.602
3 3.131 5.669 8.800 -9.445 4.383 3.402 7.784 -8.912 1.878 7.937 9.815 -9.919
4 5.926 4.114 10.041 -10.018 8.297 2.469 10.765 -10.320 3.556 5.760 9.316 -9.692
5 3.564 4.604 8.169 -9.122 4.990 2.763 7.753 -8.895 2.139 6.446 8.585 -9.337
6 2.433 6.917 9.350 -9.708 3.407 4.150 7.557 -8.783 1.460 9.684 11.144 -10.470
7 8.751 4.020 12.771 -11.062 12.252 2.412 14.663 -11.662 5.251 5.628 10.878 -10.366
8 4.291 4.363 8.654 -9.372 6.007 2.618 8.625 -9.358 2.575 6.109 8.683 -9.387
9 1.356 7.193 8.549 -9.319 1.899 4.316 6.214 -7.934 0.814 10.070 10.884 -10.368
10 15.354 2.575 17.929 -12.536 21.495 1.545 23.041 -13.625 9.212 3.605 12.818 -11.078
11 3.007 5.032 8.038 -9.052 4.209 3.019 7.228 -8.590 1.804 7.044 8.848 -9.468
12 2.282 6.458 8.740 -9.415 3.195 3.875 7.070 -8.494 1.369 9.042 10.411 -10.175
13 9.626 2.874 12.499 -10.969 13.476 1.724 15.200 -11.818 5.775 4.023 9.798 -9.912
14 3.508 4.714 8.222 -9.150 4.911 2.828 7.739 -8.887 2.105 6.599 8.704 -9.397
15 1.781 7.216 8.997 -9.541 2.493 4.330 6.823 -8.340 1.068 10.103 11.171 -10.481
16 9.863 3.411 13.274 -11.230 13.808 2.047 15.854 -12.002 5.918 4.776 10.693 -10.291
17 1.384 4.575 5.959 -7.751 1.937 2.745 4.682 -6.704 0.830 6.405 7.235 -8.594
18 1.795 6.569 8.364 -9.224 2.513 3.941 6.454 -8.098 1.077 9.196 10.273 -10.117
ANOVA calculation for zinc coated brass wire shows the contribution of factors for variation for MRSN (Weightage MRR, W=5,
SR, W=5) as Ton (76.02%) is the only significant factor and other non significant factors are Toff (7.93%), Ip (7.09%) and Sv (0.13%),
(Weightage MRR, W=7, SR, W=3) as Ton (81.03%) and Toff (9.37%) are significant factor and other non significant factors are, Ip
(5.22%) and Sv (0.05%) and (Weightage MRR, W=3, SR, W=7) as Ton (65.14%) is the only significant factor and other non
significant factors are Toff (2.53%), Ip (9.67%) and Sv (2.25%).
[image:8.612.66.548.88.404.2]According to delta statistics described in Table 7 ranks are assigned to the factors as per their significance value. The delta value is obtained by subtracting smaller value from the larger value for each factor and ranks are assigned accordingly. Highest delta value got the highest rank. The optimum parameters are selected by selecting levels (marked bold in table 7) having high value of S/N ratio for each parameter from response tables.
Table 7: Response values for MRSN Ratio Zinc Coated Brass Wire
LEVELS MRR W=5, SR W=5 MRR W=7, SR W=3 MRR W=3, SR W=7
IP Ton Toff SV IP Ton Toff SV IP Ton Toff SV
1 -9.68 -11.17 -9.38 -9.75 -9.83 -11.86 -8.94 -9.63 -9.67 -10.33 -9.88 -10.08
2 -9.61 -9.03 -9.90 -9.89 -9.33 -8.55 -9.63 -9.56 -10.06 -9.30 -9.92 -9.94
3 -9.97 -9.38 -10.31 -9.94 -9.65 -8.43 -10.26 -9.65 -10.04 -10.25 -10.09 -9.87
4 -10.06 -10.24 -10.24
5 -10.04 -9.68 -9.93
6 -9.81 -8.93 -9.83
DELTA 0.45 2.13 0.93 0.20 1.30 3.43 1.32 0.08 0.57 1.03 0.214 0.210
Technology (IJRASET)
A. Prediction for MRSN with optimal parametersThe high value for MRSN can be predicted from following equation using optimum levels of parameters. The MRSN values at optimal levels are taken from Table 7. Eq. 10, 11 & 12 describe the calculation for MRSN with zinc coated brass wire at optimal levels of significant factors.
Weightage MRR W=5, SR W=5
α = (10)
α =−8.95 db
Weightage MRR W=7, SR W=3
α = + − μ (11)
α =−7.76 db
Weightage MRR W=3, SR W=7
α = (12)
α =−9.30 db
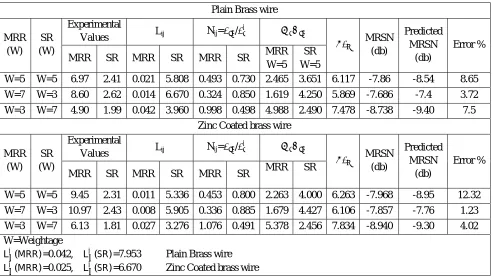
[image:9.612.62.555.324.604.2]Table 8 shows the data obtained by using Eq. (2) – Eq. (6) to find MRSN value for confirmatory experiments. Table 8 also shows the values for predicted values for MRSN and values obtained by experiments performed at optimum levels of parameters to achieve maximum MRR and less surface roughness.
Table 8 Calculation of MRSN value for confirmatory experiment and error obtained
Plain Brass wire
MRR (W)
SR (W)
Experimental
Values Lij Nij= /
∗ MRSN (db) Predicted MRSN (db) Error %
MRR SR MRR SR MRR SR MRR
W=5 SR W=5
W=5 W=5 6.97 2.41 0.021 5.808 0.493 0.730 2.465 3.651 6.117 -7.86 -8.54 8.65
W=7 W=3 8.60 2.62 0.014 6.670 0.324 0.850 1.619 4.250 5.869 -7.686 -7.4 3.72
W=3 W=7 4.90 1.99 0.042 3.960 0.998 0.498 4.988 2.490 7.478 -8.738 -9.40 7.5
Zinc Coated brass wire
MRR (W)
SR (W)
Experimental
Values Lij Nij= /
∗ MRSN (db) Predicted MRSN (db) Error %
MRR SR MRR SR MRR SR MRR SR
W=5 W=5 9.45 2.31 0.011 5.336 0.453 0.800 2.263 4.000 6.263 -7.968 -8.95 12.32
W=7 W=3 10.97 2.43 0.008 5.905 0.336 0.885 1.679 4.427 6.106 -7.857 -7.76 1.23
W=3 W=7 6.13 1.81 0.027 3.276 1.076 0.491 5.378 2.456 7.834 -8.940 -9.30 4.02
W=Weightage
L∗
(MRR)=0.042, L∗
(SR)=7.953 Plain Brass wire L∗ (MRR)=0.025, L∗ (SR)=6.670 Zinc Coated brass wire
IV.CONCLUSIONS
Technology (IJRASET)
REFERENCES[1]Patel, A. M.; Achwal, V. Optimization Of Parameters For WEDM Machine For Productivity Improvement, IOSR Journal of Mechanical and Civil Engineering, 2013, 9 (5), 10-14.
[2]Abinesh, P.; Varatharajan, K.; Kumar, G. S. Optimization of Process Parameters Influencing MRR, Surface Roughness and Electrode Wear During Machining of Titanium Alloys by WEDM. International Journal of Engineering Research and General Science 2014, 2 (1), 719-729.
[3]Vates, U. K.; Singh, N. K.; Singh R. V. Modelling of Process Parameters on D2 Steel using Wire Electrical Discharge Machining with combined approach of RSM and ANN. International Journal of Scientific & Engineering Research, 2014, 5 (1), 2026-2035.
[4]Huang, J. T.; Liao, Y. S. Optimization of machining parameters of WEDM based Grey relational and statistical analyses. International Journal of Production Research, 2003, 41 (8), 1707-1720.
[5]Ramakrishnan, R.; Karunamoorthy, L. Multi response optimization of wire EDM operations using robust design of experiments. International Journal of Advance Manufacturing Technology, 2006, 29, 105-112.
[6]Mahapatra, S.S.; Patnaik, A. Parametric Optimization of WEDM process using Taguchi method. Journal of the Brazilian Society of Mechanical Science and Engineering, 2006, 27 (4), 422-429.
[7]Dhobe, M. M.; Chopde, I. K.; Gogte, C. L. Effect of heat treatment and process parameters on surface roughness in WEDM. International Journal of Mechanical Engineering and Robotics Research, 2013, 2 (2), 275-281.
[8]Maan, V.; Chaudhary, A. Optimization of WEDM of D-2 Steel using Response Surface Methodology. International Journal of Engineering Research and Application, 2013, 3 (3), 206-216.
[9]Ikram, A.; Mufti, N. A.; Saleem, M. Q.; Khan, A. R. Parametric Optimization for Surface Roughness, kerf and MRR in WEDM using Taguchi design of experiment. Journal of Mechanical Science and Technology, 2013, 23 (7), 2133-2141.
[10] Patil, P. A.; Wahgmare, C.A. Optimization of process parameters in WEDM using response Surface Methodology. Proceedings of 10th IRF International Conference, 2014, 110-115.
![Figure 1: WEDM [Photo courtesy: Aman Metal Products, Ludhiana]](https://thumb-us.123doks.com/thumbv2/123dok_us/8583001.861502/3.612.200.454.410.601/figure-wedm-photo-courtesy-aman-metal-products-ludhiana.webp)