Effect of Soil Structure Interaction on Seismic Response of Building
Nawale V. D.
1Navale A. V.
2 1PG Student
2Assistant Professor
1,2
Department of Civil Engineering
1,2
Amrutvahini College of Engineering, Sangamner-422608, Maharashtra, India
Abstract— Masonry infill wall panels may not contribute towards resisting gravity loads, but contribute significantly, in terms of enhanced stiffness and strength under earthquake (or wind) induced lateral loading. However, in practice, the infill stiffness is commonly ignored in building frame analysis, resulting in an under-estimation of stiffness and natural frequency. Also, the infill has energy dissipation characteristics that contribute to improved seismic resistance. Thus a reasonably accurate model for the soil-foundation-structure interaction system with computational validity, efficiency and accuracy is needed in the improved seismic design of structures. Most of the times, the effect of soil flexibility is not considered by structural designer with the feeling that such omission is conservative and simple, this could be true for static analysis but not for dynamic analysis. This omission is because of experimental and computational difficulties of the soil data and complicated modelling behaviour of substructure and superstructure. It is instructive to study the implications of the common practice of ignoring the infill stiffness with regard to performance under seismic loading. The present study makes an attempt to show the effect of flexibility and rigidity of foundation in earthquake analysis of structure by the considering the combined effect of soil structure interaction and infill wall stiffness of building. For superstructure G+3 simple rectangular building is considered for seismic analysis. The infill wall is replaced by equivalent diagonal member. The total work is divided into two parts. In first part, the manual analysis is done in which response spectra applied in both X (longitudinal) and Y (transverse)direction and in second part the analysis is done with ANSYS software considering soil structure interaction effect. The more emphasis is given on manual earthquake analysis by using model superposition response method as per IS 1893-2016 (part-I). The stiffness of soil is calculated by the formulae as per the FEMA 356. After studying this behaviour, it is found that base shear decreases in seismic analysis of superstructure by considering the effect of soil structure interaction in X (Longitudinal) and Y (Transverse) direction.
Key words: Soil Structure Interaction, Soil Stiffness, Infill Wall, Earthquake, Base Shear
I. INTRODUCTION
The soil response analyses is one of the most important aspects of earthquake engineering, as it will determine the ground motion that will be experienced at the top of soil without the presence of a structure or the so-called free field response. The analysis involves estimation of the seismologic characteristics of the region, and determination and modeling of the soil profile and its dynamic characteristics. Further, it accounts for the multiple reflections and refractions that will occur at the soil layer interfaces as the seismic waves propagate though the soil deposits. Although special purpose computer programs exist for this purpose, the validity of the
results depend greatly on how accurate dynamic soil properties are estimated, which in spite the improvements in the in situ testing, is still a challenging task. In the present study, no soil amplification analysis was performed; rather, they considered accelerograms were used directly to excite the structure.
The actual seismic input motion to the structural foundation is the result of kinematic interaction analysis considering only the geometry and stiffness properties of the structural foundation and soil. The second aspect of the soil structure interaction analysis involves the deformations and stresses in supporting soil, induced due to the base shears and moments generated in the vibrating structure.
II. OBJECTIVE
Present study will be carried out with following objectives: 1) To compare the total base shear with and without
considering effect of SSI.
2) To compare the effect of SSI by considering the different type of soil.
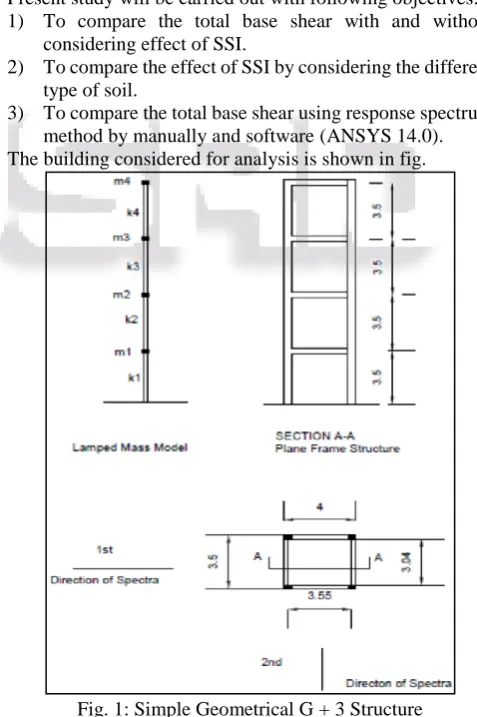
[image:1.595.303.542.324.683.2]3) To compare the total base shear using response spectrum method by manually and software (ANSYS 14.0). The building considered for analysis is shown in fig.
Fig. 1: Simple Geometrical G + 3 Structure
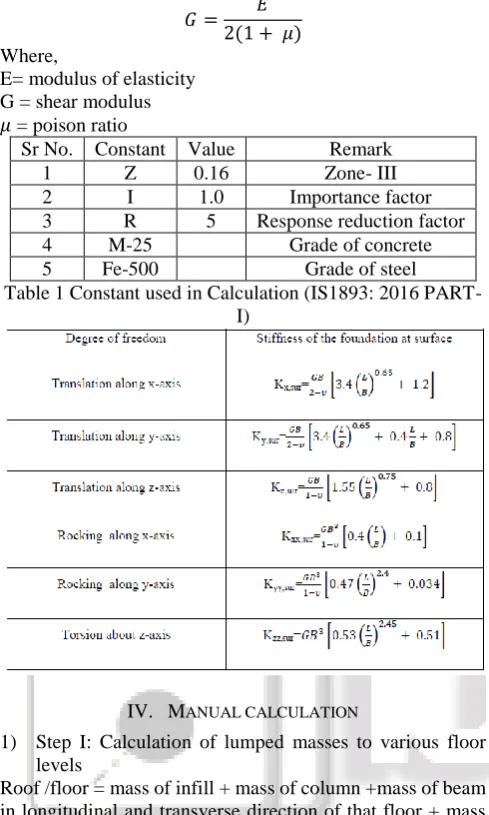
III. CALCULATION OF SOIL PARAMETER
𝐺 = 𝐸 2(1 + 𝜇)
Where,
E= modulus of elasticity G = shear modulus
𝜇 = poison ratio
Sr No. Constant Value Remark
1 Z 0.16 Zone- III
2 I 1.0 Importance factor 3 R 5 Response reduction factor
4 M-25 Grade of concrete
[image:2.595.45.290.70.478.2]5 Fe-500 Grade of steel
Table 1 Constant used in Calculation (IS1893: 2016 PART-I)
IV. MANUAL CALCULATION
1) Step I: Calculation of lumped masses to various floor levels
Roof /floor = mass of infill + mass of column +mass of beam in longitudinal and transverse direction of that floor + mass of slab + imposed load on that floor if permissible
Roof = {((0.23 x 3.1 x (3.5/2)) + (0.23 x 3.04 x 2 x(3.5/2))) x22 } + {( 0.23 x 0.4 x (4x2 + 3.5x2 )x 25} + {0.12 x 4 x 3.5 x25 } + {(0.23 x 0.45 x 3.5/2) x 4 )x 25} + 0
=203.35 kN =20.73 Ton
Floors = Third, Second and First floor
= {((0.23 x 3.1 x 2 x 3.5) + (0.23 x 3.04 x 2 x 3.5)) x 22 } + {( 0.23 x 0.4 x (4x2 + 3.5x2 )x 25} + {0.12 x 4 x 3.5 x25 } + {(0.23 x 0.45 x 3.5 x 4 )x 25} + {(3.5/2)** x 3.5 x 4 } = 354.69kN i.e. 36.15 Ton
* Imposed load on roof not consider.
** 50% of Imposed load, if imposed load is greater than3 kN/m2
2) Step - II: Frame considering the stiffness of infill The frame considered in previous section is again analysed by considering the stiffness of infill walls. This is modelled as equivalent diagonal strut.
The mass matrix [M] for lumped plane frame model is
= [
36.15 0 0 0
0 36.15 0 0
0 0 36.15 0
0 0 0 20.73
]
Column stiffness of storey
k = 12EI L3 =
12 X 22360 X 103 X 0.23 X 0.453 12 X 3.53
= 10930.32 kN /m
Stiffness of infill is determined by modelling the infill as an equivalent diagonal strut in which, width of strut
𝐸𝑓= 22360 N/m2 𝐸𝑚= 13800 N/m2
t = thickness of infill wall = 230 mm h = height of infill wall = 3.5 m l = length of infill wall = 4 m
𝐼𝑐= moment of inertia of column =0.23 𝑥0.45 3
12 = 0.001746 m4
𝐼𝑏= moment of inertia of beam = 0.23𝑥0.43
12 =
0.001226 m4
𝜃 = tan−13.5
4 = 41.18
0
𝛼ℎ=
𝜋 2[
22360 𝑥 .001746 𝑥 3.5 2 𝑥 13800 𝑥 0.23 𝑥 sin(2 𝑥 41.18)]
1 4
= 0.602
𝛼𝑙= 𝜋 [
22360 𝑥 0.001226 𝑥 4 13800 𝑥 0.23 𝑥 sin( 2 𝑥 41.18)]
1 4
= 1.357
W =1 2√0.602
2+ 1.3572
= 0.7422 m
A= area of diagonal stiffness = 0.7422 x 0.23
= 0.1707 m2
Size of diagonal strut = 0.7422 x 0.23
Diagonal length = √3.52+ 42= 5.315 m
Stiffness of infill is = AEm Id
(cos θ)2
=0.1707 x 13800 x 10
6 x (cos 41.18)2
5.315
= 251.066898 x 10⁶ N/m
For the frame with two bays there are two struts participating in each direction total lateral stiffness of each storey
k1= k2 = k3 =k4 = 4 x 10930.32 + 2 x 251.066898 x 106 = 500.163 x 10⁶ N/m
= 500163 kN/m. Stiffness matix [k]=
[
1.000326 −0.500163 0 0
−0.500163 1.000326 −0.500163 0
0 −0.500163 1.000326 −0.500163
0 0 −0.500163 0.500163
] 106kN/m
For the above stiffness and mass matrix, eigen values and Eigen vectors are work out as follows therefore quadratic equation in 𝜔 is,
[𝜔] = [
45.02 0 0 0
0 128.43 0 0
0 0 191.84 0
0 0 0 227.47
]
∴ 𝜔1= 45.02 rad/sec
𝜔2= 128.43 rad/sec
𝜔3= 191.84 rad/sec
𝜔4= 227.47 rad/sec
||
2𝐾 − 𝜔2𝑚 −𝐾2 0 0
−𝐾2 2𝐾 − 𝜔2𝑚 −𝐾3 0
0 −𝐾3 2𝐾 − 𝜔2𝑚 −𝐾4
0 0 −𝐾4 𝐾 − 𝜔2 0.575𝑚
|| { ∅1 ∅2 ∅3 ∅4
} = 0
3) Step –III Mode Shapes Mode - 1:
𝝎1= 45.02 rad/sec
(100032636.15 𝝎2)Ø11 – 500163Ø21= 0 Put Ø11=1therefore, Ø21= 1.85
Similarly Ø31= 2.43, Ø41 = 2.65 Mode - 2
𝝎2= 128.43 rad/sec
Put Ø12=1therefore, Ø22= 0.807 Similarly Ø32= -0.348, Ø42 = -1.088 Mode – 3
𝝎3= 191.84 rad/sec
Put Ø13=1therefore, Ø23= -1.51 Similarly Ø33= 0.00348, Ø43 = 0.00659 Mode - 4
𝝎4= 227.47 rad/sec
Put Ø14=1therefore, Ø24= -0.574 Similarly Ø34= -0.0138, Ø44 = 0.576 Eigen vectors (mode shapes): {Ø}={Ø1Ø2Ø3 Ø4}=
[
1 1 1 1
1.85 0.807 −1.51 −0.574 2.43 −0.348 −0.00138 −0.00138 2.65 −1.088 0.00659 0.576
]
4) Step –IV Determination of modal participation factor The modal participation factor
Pk = ∑ 𝑾𝒊 ∅𝒊𝒌
𝒏 𝒊=𝟏 ∑𝒏𝒊=𝟏𝑾𝒊 ∅𝒊𝒌𝟐
P1= 𝑾𝟏∅𝟏𝟏+ 𝑾𝟐∅𝟐𝟏+ 𝑾𝟑∅𝟑𝟏+𝑾𝟒∅𝟒𝟏
𝑾𝟏∅𝟏𝟏𝟐 +𝑾𝟐∅𝟐𝟏𝟐 +𝑾𝟑∅𝟑𝟏𝟐 +𝑾𝟒∅𝟒𝟏𝟐
= 𝟑𝟔.𝟏𝟓 × 𝟏+𝟑𝟔.𝟏𝟓 ×𝟏.𝟖𝟓+𝟑𝟔.𝟏𝟓 ×𝟐.𝟒𝟑+𝟐𝟎.𝟕𝟑 × 𝟐.𝟔𝟓
𝟑𝟔.𝟏𝟓 ×𝟏+𝟑𝟔.𝟏𝟓 ×𝟏.𝟖𝟓𝟐+ 𝟑𝟔.𝟏𝟓 × 𝟐.𝟒𝟑𝟐+ 𝟐𝟎.𝟕𝟑 × 𝟐.𝟔𝟓𝟐
P1= 0.4739 Similarly P2= 0.342 P3= -0.155 P4=0.496
Step –V Determination of modal mass mk=
(∑𝒏 𝑾𝒊 ∅𝒊𝒌)𝟐 𝒊=𝟏 𝒈 (∑𝒏𝒊=𝟏𝑾𝒊 ∅𝒊𝒌𝟐)
Where,
g= acceleration due to gravity
Øik= mode shape coeff. at ith floor in mode k m1=
(∑𝟒𝒊=𝟏𝑾𝟏 ∅𝒊𝒌)𝟐 𝒈 (∑𝟒𝒊=𝟏𝑾𝟏 ∅𝒊𝟏𝟐)
m1= 116.43 tonne m2= 32.85 tonne m3=30.34 tonne m4= 3.20 tonne
Total modal mass = 116.43 + 30.34 + 32.85 + 3.20 = 182.82 tonne
Modal contribution for each mode For mode 1 = 116.43/182.82 = 63.68% For mode 2 = 32.85/182.82 = 17.96 % For mode 3 = 30.34/182.82 = 16.59 % For mode 4 = 3.20/182.82 = 1.75 %
5) Step –VI Determination of lateral forces at each floor at each mode
The design lateral force is given by(Qik) at floor i in mode k is,
Qik=AkØikPk Wi
The design horizontal seismic coefficient Ah, for various mode are
Ah=𝑍
2 𝐼 𝑅
𝑆𝑎 𝑔
𝑆𝑎 𝑔 =
{
1 + 15𝑇 𝑇 < 0.10 𝑠 2.5 0.10 𝑠 < 𝑇 < 0.40𝑠 1
𝑇 0.40 𝑠 < 𝑇 < 4.0 𝑠 0.25 𝑇 > 4.00 𝑠
For T1= 0.139 𝑆𝑎1
𝑔 =2.5
For T2 = 0.0489 𝑆𝑎1
𝑔 =1.734
For T3 = 0.0327𝑆𝑎1
𝑔 =1.491
For T4 = 0.0276𝑆𝑎1
𝑔 =1.414
Ah1=𝑍
2 𝐼 𝑅
𝑆𝑎 𝑔 =
0.16 2
1 5 2.5
∴ Ah1= 0.04 Similarly, Ah2 = 0.0277 Ah3 = 0.0238 Ah4 = 0.0226
Qi1 =[
(𝐴ℎ1𝑃1 ∅11 𝑊1)
(𝐴ℎ2𝑃1 ∅21 𝑊1)
(𝐴ℎ3𝑃1 ∅31 𝑊1)
(𝐴ℎ4𝑃1 ∅41 𝑊1)
]
=[
(0.0400)(0.473)(1.00)(36.15 × 9.81) (0.0277)(0.473)(1.85)(36.15 × 9.81) (0.0238)(0.473)(2.43)(36.15 × 9.81) (0.0226)(0.473)(2.65)(36.15 × 9.81) ]
∴ Qi1= [ 6.71 8.59 9.70 5.76 ]
Similarly,
Qi2= [ 4.85 2.71 −1.00 −1.76 ]
Qi3= [ −2.20
2.30 0.0018 −0.0047
]
Qi4= [ 7.04 −2.80 −0.0058
2.29 ]
6) Step VII Determination of storey shear forces in each mode
Vik=∑𝑛𝑖=𝑖+1𝑄𝑖𝑘
Vi1= [
V11
V21
V31
V41
]=[
(𝑄11+ 𝑄21+ 𝑄31+ 𝑄41)
(𝑄21+ 𝑄31+ 𝑄41)
(𝑄31+ 𝑄41)
(𝑄41)
]=[ 30.05 24.05 15.46 5.76
]
Vi2=[ V12
V22
V32
V42
] = [ 4.80 −0.05 −2.76 −1.76 ]
Vi3=[ V13
V23
V33
V43
] = [ 0.097
2.29 −0.0029 −0.0047 ]
Vi4= [ V14
V24
V34
V44
] = [ 6.52 −0.52
2.28 2.29 ]
7) Step VIII Determination of storey shear forces due to all modes
V1=[( V11)2+( V12)2+( V13)2+( V14)2]0.5 V1=[( 30.05)2+( 4.80)2+( 0.097)2+( 6.52)2]0.5 = 31.12 kN
Similarly,
V2 = 24.16 kN, V3 = 15.87 kN, V4= 6.44 kN
Step IX Determination of lateral forces at each storey Final base shear at each floor
F4 at roof floor= 6.44kN
F3 at third floor = V3- V4=15.87-.44=9.43 kN F2 at second floor = V2- V3=24.16-15.87=8.29 kN F1 at first floor = V1- V2=31.12-24.16=6.96 kN
[image:4.595.56.433.62.750.2]Total Base shear = 6.44 + 9.43 + 8.29 + 6.96 = 31.12 kN V. CALCULATION WERE DONE WITH ANSYS WITHOUT CONSIDERING SSI& WITH SSI FOR DIFFERENT SOIL TYPE A. ANSYS Result in X direction
Fig 2: Building model without considering SSI after analysis in X direction
Fig. 3: Building model with considering SSI after analysis for soil group I in X direction
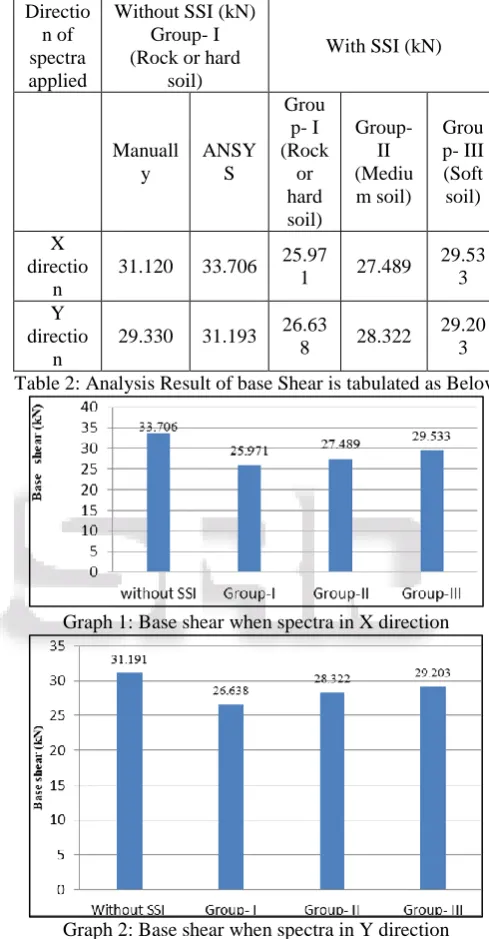
VI. RESULTS
In order to accomplish a satisfactory and safe result structural performance during seismic events of reinforced concrete multi-storied building on soil media, proper seismic design should be taken into account the effect of soil structure interaction.
Directio n of spectra applied
Without SSI (kN) Group- I (Rock or hard
soil)
With SSI (kN)
Manuall y
ANSY S
Grou p- I (Rock
or hard soil)
Group- II (Mediu m soil)
Grou p- III (Soft soil)
X directio
n
31.120 33.706 25.97
1 27.489
29.53 3 Y
directio n
29.330 31.193 26.63
8 28.322
29.20 3 Table 2: Analysis Result of base Shear is tabulated as Below
Graph 1: Base shear when spectra in X direction
Graph 2: Base shear when spectra in Y direction VII. CONCLUSIONS
In this study, the importance of subsoil dynamic properties on behaviour of mid-rise concrete moment resisting building frames under influence of soil-structure interaction is investigated. The study is conducted for the 4 storey concrete moment resisting building frame resting on soil Group I (Rock or hard soil), II (Medium soil) and III (Soft soil). 1) In analysis performed without considering SSI for the
[image:4.595.300.545.141.611.2]This is because in manual calculation lumped mass modeling is used whereas ANSYS software uses discrete modeling.
2) For Group-I (Rock or hard soil), the base shear values in longitudinal (X) direction and transverse (Y) direction are decreased by 29.78% and 17.09% respectively when SSI effect is considered as compared to values without considering SSI.
3) For spectra is in longitudinal direction (X) the base shear value considering SSI is maximum in Group-III (Soft soil) and minimum in Group-I (Rock or hard soil). The value is more in Group-III (Soft soil) by 13.71 % than Group-I (Rock or hard soil) and by 7.43 % than Group- II (Medium soil).
4) For spectra is in transverse direction (Y) the base shear value considering SSI is also maximum in Group-III (Soft soil) and minimum in Group-I (Rock or hard soil). The value is more in Group-III (Soft soil) by 9.62 % than Group-I (Rock or hard soil) and by 3.11 % than Group- II (Medium soil).
5) For the soil with SSI, the spectra along transverse (Y) direction of building is more critical than spectra along longitudinal (X) direction because base shear value in transverse (Y) direction is more than base shear value along longitudinal (X) direction for Group-I (Rock or hard soil) and Group-II (Medium soil). But in Group-III spectra along both directions are almost equal.
REFERENCES
[1] Agrawal P. and Shrikhande M. 2007, “Earthquake resistant design of structures”, prentice hall of India privet limited New Delhi, India.
[2] Alper Ucak and Panos Tsopelas, “Effect of soil–structure interaction on seismic isolated bridges” journal of structural engineering, vol. 134, no. 7, July 1, 2008. ©ASCE, ISSN.
[3] American Society Of Civil Engineers Reston, Virginia, “FEMA 356/2000” Federal Emergency Management Agency Washington, D.C. November 2000.
[4] Chopra Anil Kumar, “Dynamics of structures, theory and applications to earthquake engg”, third edition, prentice hall publication.
[5] George Lin, “Stability of frames with grade beam And soil interaction” journal of engineering mechanics, vol. 118, no. 1, January, 1992. © ASCE, ISSN 0733-9399/92/0001-0125 paper no. 286.
[6] George Mylonakis “Seismic soil-structure interaction: beneficial or detrimental?”Journal of earthquake engineering, vol. 4, no. 3 (2000) 277-301.
[7] IS 1893 (Part I): 2016 Criteria for Earthquake resistant design of structure.
[8] Izuru Takewaki, “Closed-form sensitivity of earthquake input energy to soil-structure interaction system” journal of engineering mechanics, vol. 133, no. 4, April 1, 2007. [9] Javier Avilés1 and Luis Eduardo Pérez-rocha “damage analysis of structures on elastic foundation” journal of structural engineering, vol. 133, no. 10, October 1, 2007. © ASCE, ISSN 0733-9445/2007/10-1453–1461. [10]Jonathan p. Stewart, Craig Comartin, and Jack P. Moehle
“Implementation of soil-structure interaction models in
performance based design procedures”13th world conference on earthquake engineering vancouver, b.c., Canada august 1-6, 2004 paper no. 1546.
[11]Jonathan P. Stewart, Gregory Fenves and Raymond, “Seismic soil-structure interaction in buildings. I: Analytical methods” journal of geotechnical and geoenvironmental engineering, vol. 125, no. 1, January, 1999. ASCE, ISSN 1090-0241/99/0001. Paper no. 16525.
[12]J Rajasankar, Nagesh Iyer, Yerraya Swamy Gopalakrishnan and Chellapandi, “SSI analysis of a massive concrete structure based on a novel convolution/deconvolution technique”, Sadhana vol. 32, part 3, June 2007, pp. 215–234.
[13]Julio A. García “soil structure interaction in the analysis and seismic design of reinforced concrete frame buildings”, the 14th world conference on earthquake engineering October 12-17, 2008, Beijing, china. [14]Karen Weissmani and Jean h. Prevost “Results and
analysis of soil-structure interaction experiments performed in the centrifuge”, earthquake engineering and structural dynamics, vol. 20,259-274 (1991). [15]Kohji Tokimatsua, Hiroko Suzukia, Masayoshi “effects
of inertial and kinematic interaction on seismic behaviour of pile with embedded foundation”, soil dynamics and earthquake engineering 25 (2005) 753– 762.
[16]Konduru V. Rambabu, Mehter M. Allam, “Response of an open-plane frame to multiple support horizontal seismic excitations with soil–structure interaction”, journal of sound and vibration 299 (2007) 388–396. [17]Mahir Ulker-kaustell, Raid Karoumia, Costin Pacoste,
“Simplified analysis of the dynamic soil–structure interaction of a portal frame railway bridge”, engineering structures 32 (2010) 3692–3698.
[18]Mustafa Kutanis and Muzaffe Elmas “the soil structure interaction analysis based on substructure method in time domain”,4th U.S.-Japan workshop on soil-structure interaction tsukuba, Japan march 28-30, 2007.
[19]Nobuo Fukuwa and Xuezhang “Wen efficient soil-structure interaction analysis method of a large-scale pile group” 4th U.S.-Japan workshop on soil-structure interaction tsukuba, japan march 28-30, 2007.
[20]Sekhar Chandra Duttaa, Koushik Bhattacharyaa, Rana Royb “Response of low-rise buildings under seismic ground excitation incorporating soil–structure interaction”, soil dynamics and earthquake engineering 24 (2004) 893–914.