De-noising Spacecraft Attitude and Rate Data
using DWT
B. Ravi Sankar
Scientist
MPAD/MDG, ISRO Satellite Centre, Bangalore, INDIA.
S. Alamelu Mangai
Dept. of Computer Science,
Dr. Ambedkar Institute of Management Studies, Bangalore, INDIA.
ABSTRACT
In this paper, de-noising of satellite attitude and rate data using discrete wavelet transform is presented. The mission objective of any remote sensing satellite is to produce an image. The image is taken on board the spacecraft, and then downloaded using a Radio Frequency link. The processing of the image is done at ground. The attitude quaternion and body rates are part of the down linked data. These data had to be pre-processed to remove the noise. Conventional methods employ taking the Fourier transform and removing the high frequency component through filtering. The de-noising of attitude and rate data is important to make the final data product such as image smoother.
General Terms
Spacecraft, attitude, body rates.
Keywords
Satellite image, Satellite Data Product, attitude quaternion denoising, body rates denoising, Discrete Wavelet Transform, Remote Sensing satellite.
1.
INTRODUCTION
Spacecraft attitude [1] and body rate play an important role in obtaining the final image or the so called data product. Along with payload data, spacecraft attitude and body rates also will be down linked. Before processing the payload data which is the actual image, the attitude and body rates have to be de-noised. Conventional methods use taking the FFT and removing the high frequency component which is presumed as noise. In this paper we propose a novel method for removing the noise based on Discrete Wavelet Transform (DWT). At present wavelets are used to compress the image data of a spacecraft.
The paper is organized as follows. Section 2 describes the terminology and provides the detail of the satellite used in the analysis. An introduction to wavelet transform is given in section 3. In section 4, the spacecraft data is analyzed based on discrete wavelet transform using MATLAB. Section 5 concludes this paper.
2.
TERMINOLGY
2.1 Attitude
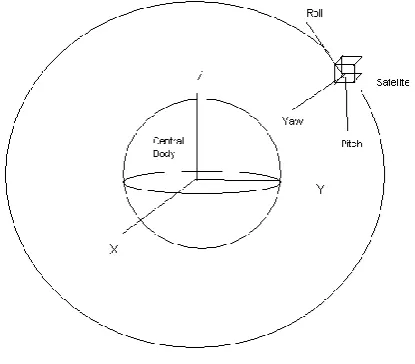
Attitude [1] is defined as the orientation of some orthogonal Cartesian axes with respect to some reference chosen axes. Attitude is always represented using quaternions in spacecrafts. Figure 1 shows the attitude geometry. In Figure 1, reference frame is represented by XYZ and spacecraft body frame is represented as YRP.
2.2 Rates
Rate [1] of axis is defined as change in angle of a chosen axis with respect to reference axis per second. Always rates are given in body frame i.e. yaw roll pitch frame, at least for the purpose of processing the payload data.
2.3 Introduction to the SMART-1
SMART-1 was a Swedish-designed | European Space Agency satellite that orbited around the Moon. It was launched on September 27, 2003 at 23:14 UTC from the Guiana Space Centre in Kourou, French Guiana. "SMART-1" stands for
Small Missions for Advanced Research in Technology-1. On September 3, 2006 (05:42 UTC), SMART-1 was deliberately crashed into the Moon's surface, ending its mission. The satellite data is available in public domain through ESA website. The data from the SMART-1 satellite is used in this analysis. The source data used for analyzing are shown in figure 2 and figure 3. The data corresponds to day number 272 of the year 2004 and the time interval is given below.
[image:1.595.317.525.527.709.2]Start Time [UTCDOY]: 2004/272 00:00:19.001 End Time [UTCDOY]: 2004/272 00:20:20.378 Time-step [DDD HH:MM:SS.SSS]: 000 00:00:00.128 Where UTCDOY stands for Universal Time Coordinate Day Of Year. DDD stands for day number. HH stands for hour number. MM stands for minute number. SS stands for second number. SSS stands for milli-second number and it is the sampling time.
Figure 2: SMART-1 Spacecraft Body Rates in Body Frame
3.
DISCRETE WAVELET TRANSFORM
[image:2.595.326.525.75.236.2]Wavelets are mathematical functions that analyze data according to scale or resolutions [2]. They aid in studying a signal in different windows or at different resolutions. For instance, if the signal is viewed in a large window, gross features can be noticed, but if viewed in a small window, only small features can be noticed. Wavelets provide some advantages over Fourier transforms. For example, they do a good job in approximating signals with sharp spikes or signals having discontinuities. Wavelets can also model speech, music, video and non-stationary stochastic signals. Wavelets can be used in applications such as image compression, turbulence, human vision, radar, earthquake prediction, etc. [3]. DWT is representation of wavelets in digital computers.
Figure 3: SMART-1 Spacecraft Attitude Quaternion in ECI Frame
4.
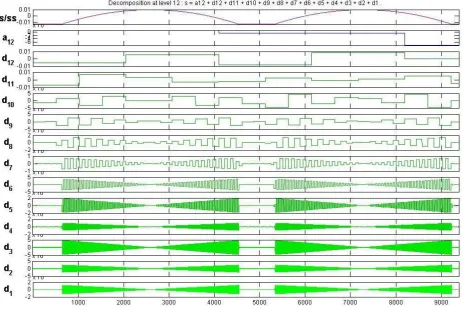
ANALYSIS USING DWT
Whatever the data down linked from satellite is a discrete time signal consisting of a vector of numbers. The signals were analyzed with various mother wavelets and finally found Haar wavelet [2] is suitable for this analysis purely based on trial and error. The original signals were decomposed at a level of 12 and threshold (using rigorous sure threshold) the coefficients, for noise removal [3]. The noise residuals were reconstructed and found the important characteristics of the noise that are tabled in table 1. Figure 4 shows the yaw rate decomposed at level 12 using Haar wavelet and a similar procedure was adopted for rest of the parameters. All the rest of the figures show the autocorrelation and FFT spectrum for all the seven noise residuals.
0 200 400 600 800 1000 1200 1400
-0.015 -0.01 -0.005 0 0.005 0.01
Time in seconds
B o d y r a te s i n d e g /s e c o n d
Body rates of SMART-1 Satellite
yaw rate roll rate pitch rate
0 200 400 600 800 1000 1200 1400
-0.8 -0.6 -0.4 -0.2 0 0.2 0.4 0.6 0.8
Time in seconds
A tt it u d e Q u a te rn io n s
Quaternions of SMART-1 Satellite
[image:2.595.69.533.437.749.2]Figure 5: Autocorrelation and FFT Spectrum of Noise residuals of Yaw rate
Figure 6: Autocorrelation and FFT Spectrum of Noise residuals of Roll rate
[image:3.595.70.524.299.672.2]Figure 7: Autocorrelation and FFT Spectrum of Noise residuals of Pitch rate
[image:3.595.69.518.609.699.2]Figure 8: Autocorrelation and FFT Spectrum of Noise residuals of quaternion-1
Figure 10: Autocorrelation and FFT Spectrum of Noise residuals of quaternion-3
Figure 11: Autocorrelation and FFT Spectrum of Noise residuals of quaternion-4
Table 1: Important parameters of all noise residuals.
Parameter Yaw rate Roll Rate Pitch Rate Q1 Q2 Q3 Q4
Mean 1.08e-007 9.276e-010 5.139e-008 2.709e-008 -9.502e-008 -9.625e-008 2.981e-008
Median -1.532e-006 1.737e-008 -5.239e-007 1.684e-009 -8.433e-008 -6.626e-008 -1.192e-010
Mode -3.13e-006 2.757e-007 -1.999e-006 -1.444e-007 3.115e-007 -1.196e-006 -7.765e-007
Maximum 7.614e-005 1.715e-006 4.247e-005 1.704e-005 5.157e-005 5.218e-005 1.567e-005
Minimum -7.929e-005 -1.796e-006 -4.473e-005 -1.665e-005 -5.304e-005 -5.248e-005 -1.536e-005
Range 0.0001554 3.511e-006 8.72e-005 3.369e-005 0.0001046 0.0001047 3.104e-005
Standard Deviation
2.253e-005 5.508e-007 1.279e-005 5.079e-006 1.664e-005 1.674e-005 5.115e-006
Median Absolute Deviation
1.274e-005 3.644e-007 7.162-006 3.35e-006 1.118e-005 1.13e-005 3.48e-006
Mean Absolute Deviation
1.689e-005 4.394e-007 9.675e-006 4.033e-006 1.333e-005 1.343e-005 4.111e-006
5.
CONCLUSION
Processing of spacecraft payload data is utmost important thing in the overall mission of the satellite. The objective of the launch vehicle is to put the spacecraft into orbit. The purpose of the spacecraft is its payload. The payload may be a communication transponder or imaging payload. Imaging payload spacecraft’s are referred to as commonly remote
[image:4.595.53.529.354.644.2]mission is a moon pointing mission and the final image will be a map of moon.
In this paper, we have emphasized that if the body attitude quaternion and body rates are preprocessed for noise using DWT, then the resulting image will be of good quality. After the image is processed with the de-noised body rate and quaternion, another round of digital image processing has to be done. In this case two dimensional discrete wavelet transform can be employed to remove any spatial or non-white noise from the image. The noise characteristic can be given as a feedback to the control system designer of a spacecraft, so as to enable the designer to design a more efficient control system.
6.
REFERENCES
[1] J.R.Wertz., Spacecraft Attitude Determination and Control, Springer, 1978.
[2] Amara Graps., An introduction to wavelets, http://www.eecis.udel.edu/~amer/CISC651/IEEEwavelet .pdf