Application of Optimization Technique to Tune PID
Controller for a Level Process
P Aravind
Assistant ProfessorDepartment of Instrumentation and Control Engineering
Saranathan college of Engineering Triuchirappalli,Tamil Nadu,
India
S.M. Giriraj Kumar,
Ph. D ProfessorDepartment of Instrumentation and Control Engineering
Saranathan college of Engineering Triuchirappalli,Tamil Nadu,
India
ABSTRACT
In any processes industry, process variables that need to be controlled are temperature, level, pressure and flow. This paper deals with an application of genetic algorithm to find the PID controller values to control the liquid level in the cylindrical tank. A process is identified as first order plus dead time model (FOPTD) and is validated. The intension of this paper is to obtain a minimum rise time, minimum setting time, and stable controlled system by obtaining the PID controller using conventional tuning method and Genetic Algorithm optimization technique. The simulation analysis was carried out for the mentioned PID controller settings. From the results based on time domain analysis, it is proved that the PID values are obtained using GA optimization technique yield a better perform than the conventional tuning method.
General Terms
Control System.Keywords
level process, PID controller, Optimization Technique, control system
1.
INTRODUCTION
Measurement and control of measurables like Temperature, Pressure, Flow rate , pH, Humidity , Level, Concentration, Viscosity, Conductivity , Turbidity, Redox/potential , Electrical behavior , Flammability is important in industries. The response of such measurables from the process system are to be identified as model and are to be validated. The obtained models are used for tuning. Application of controller to such process system is to stabilize and operate the measurables or process variables as close as possible to predetermined set value.
Even though in the presence of new control technique industrial persons and researchers are still used PID controller in many control applications. The reason for their popularity are simplicity, transparency and availability of a larger number of highly efficient, reliable and cost effective commercial PID control modules[1]. Optimum solution is attained by Simply adjusting Proportion, Integral and Derivative controller gain parameters[2,3]. In the control strategy literature, there is number of conventional tuning methods are available to tune the parameter of PID controllers, model based controllers[8] ,optimization tuning methods, artificial neural networks , Fuzzy Logic controller. Likewise still new control techniques are emerging. In this work, the application of optimization algorithm[6,7] is implemented to obtain the best PID controller values.
Efficiency of the optimization tuning technique is highlighted by comparing the results with conventional tuning technique. The experimental system and development of the mathematical model for the real time level process is discussed in section 2. The tuning results of control techniques are discussed in section 3. Section 4 and 5 deals with the explanation of the GA and its implementation. The comparative analysis and results are given in section 6.Based on the results is given in Section 7 conclusions arrived.
2.
EXPERIMENTAL SETUP
The real time experimental system consisting of a transparent linear tank, reservoir and water pump, current to pressure converter, compressor, Electronic Type Level Transmitter and a Personal Computer which acts as a controller forms a closed loop
system.
Fig.1. Piping and Instrument diagram of Experimental Setup
F
Fo
8
4
6
5
Compressor
7
3
1
1 Process Tank
2 Storage Tank
3 Rotameter
4 Level Transmitter
5 I to P convertor
6 Computer (controller)
7 Control Valve
8 Pump
F, Fo Inflow and Outflow
Table.1.Technical details of the experimental setup Part
Name Details
Tank Transparent body- Cylindrical Level
Transmitter (LT)
Electronic-Range 0–90 cm, Output 4–20mA
Pump Centrifugal 0.5 HP
Control valve Size ¼“ Pneumatic actuated, Type: Air to close, Input 3 – 15 psi Rotameter Range 10 - 100 LPH
I/P converter Input 4-20 mA, Output 3-15 psi Pressure
gauge Range 0 - 30 psi
2.1
Step Test Method
Step response based method is the most commonly used method for identifying system parameters. At first, the inlet valve is at fully opened condition and outlet valve is set to a particular restriction. The open loop step response is obtained by varying the inflow rate, the experimental results are noted in terms of time and height or level. The models are identified by process reaction curve method (PRC) [4] and Sunderasan Kumaraswamy(SK) method [6] method. For a change in step function the PRC method produces a response, from the response parameters like dead time (τd), the time taken for the
response to change (τ), and the ultimate value that the response reaches at steady state, τ = 63.2 % of the maximum value are measured and Sunderasan & Kumaraswamy(SK) method [6] is used to develop model from the obtained response. As per the structure of the curves, the FOPTD model is given by,
G s =
kpe−τd (s)τs+1 (1)
Where K is the process gain; τ is the first order time constant; τd is the delay time.
The derived models are validated with real time results is presented in figure 2 [8] and model obtained through SK method of identification is effectively suitable to real time response. From the response of the real time system we
obtain the mentioned constants for SK method and thereby we get the FOPTD models for the real time linear tank process as,
G s =
1.7e−27.99s203.68s+1 (2)
Fig.2. Comparison of real time and simulated responses
3.
CONTROLLER DESIGN
The basic PID controller parameters are proportional gain, Kp , integral gain Ki, derivative gain Kd. Numerous methods were developed over last fifty years for setting the parameters of a PID controller. This paper addresses the implementing of PID parameters in two design modes. The IMC based PID control technique and GA based PID controller.
3.1 IMC based PID
In order to arrive at a PID equivalent form for process with a time delay, we must apporimate the dead time using pade approximation method[5].
G s =
kpe−τd (s)τs+1 (3)
First order pade approximation for dead time,
e
−τd(s)=
−0.5τds+1−0.5τds+1 (4)
PID controller parameters are identified by solving the equation (3 and 4 ),
𝐾
𝑝=
τ+0.5τd𝐾𝑝(τc+0.5τd ) (5)
𝑇
𝑖=
τ
+ 0.5
τ
d (6)𝑇
𝑑=
ττd2τ+τ (7) 0
10 20 30 40 50 60 70 80 90
0 200 400 600 800 1000120014001600
Level
in
c
m
Time in seconds
RealTime
PRC
3.2 GA Based PI Controller
The GA is a universal search algorithm based on the evolutionary thoughts of natural selection and natural genetics. The searching path is linked to the natural advancement of biological creatures in which successive generations of organism are given birth and bump up until they themselves are able to procreate. In GA algorithms, the fittest among a set of artificial creatures with string structures can survive and form a new generation together with those which are produced through some structured randomized data. GA efficiently make use of historical information to speculate on new search populations with gradually improved behaviors.
Generally, GA consists of three primary operators: reproduction, crossover and mutation. Given an optimization problem, simply GA encode the parameters concerned into finite bit strings, and then run iteratively using the three operators in a unsystematic manner but based on the fitness function evolution to carry out the basic tasks of copying strings, exchanging parts as well as changing some bits of strings, and decode the solutions to the problem from the last pool of mature strings [7].
3.3 Algorithm
Step 1: Start the algorithm.Step2: Create Initial Random Population.
Step3: Parametric genes evaluate from chromosomes. Step4: Apply Fitness.
Step5: Termination criterion satisfied,goto end,else goto step 6
Step6: Parent Selection and Reproduction. Step7: Processing Crossover.
Step8: Mutation and goto step3. Step9: End.of Algorithm
3.4 Reproduction
In the reproduction phase each value of chromosomes is evaluated. Just like in natural evolution, a fit chromosome has a higher possibility of being selected for reproduction. This is one of the reason for the reproduction operation to be sometimes known as the selection operator.
3.5 Crossover
In reproductive phase no strings is formed , new strings are created in this operator by exchanging information among strings of the mating pool. In crossover operations switches certain parts of the two selected strings from the previous generation to capture the good parts of old chromosomes.
4. IMPLEMENTATION OF GA
The optimal values of the PI controller parameters Kp, Ki are found using GA. All possible sets of controller parameter values are chromosomes whose values are adjusted so as to minimize the objective function, which in this case is the error criterion[8].
4.1 Selection of GA parameters
:Tostart up with GA, predefining certain parameters need to be defined. It includes the population size, bit length of chromosome, number of iterations, selection, crossover and
mutation types etc. Selection of these parameters decides to a great extent the ability of designed controller.
4.2 Performance Indices for the Algorithm
The performance of a controller is best evaluated in terms of integral of time absolute error criterion. A number of such criteria are available and in the proposed work, controller’s performance is evaluated in terms of: Integral of Time multiplied by Absolute Error (ITAE) criterion, given by:I
ITAE= t e(t) dt
T0
5. TERMINATION CRITERIA
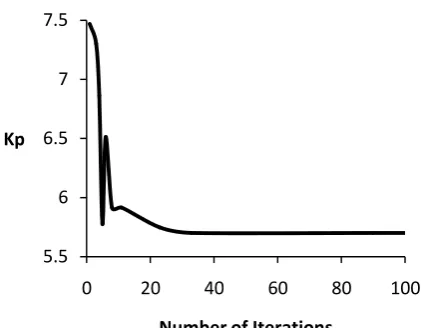
[image:3.595.328.544.418.582.2]Optimization algorithm will automatically terminate execution either when the number of iterations gets over or with the attainment of acceptable fitness value. Fitness value, in this case is nothing but reciprocal of the magnitude of the objective function, since we consider for a minimization of objective function. In this paper the termination criteria is considered to be the attainment of acceptable fitness value which occurs with the maximum number of iterations as 100. For each iteration the best among the 100 particles considered as potential solution are chosen Therefore the best values for 100 iterations for four models are sketched and shown in figure3, figure4, figure5 and figure6 with respect to iterations.
Fig 3: Best solutions of Kp for 100 iterations
5.5 6 6.5 7 7.5
0 20 40 60 80 100
Kp
[image:4.595.53.537.59.696.2]
Fig 4: Best solutions of Ki for 100 iterations
Fig 5: Best solutions of Kd for 100 iterations
[image:4.595.331.534.80.237.2]Fig 6 Best solutions of Kp , Ki , Kd and ITAE response for 100 iterations
Fig 7: Load Change Response of a Process for PID Controller
Fig 8: Servo Response of a Process
Fig 9: Comparison of IMC-PID and GA-PID for a setpoint of 25 cm
0.025 0.03 0.035 0.04 0.045 0.05 0.055
0 20 40 60 80 100
Ki
Number of Iterations
39.7 41.7 43.7 45.7 47.7 49.7
0 50 100
Kd
Number of Iterations
290 310 330 350 370 390 410 430 450
0 20 40 60 80 100
ITA
E
Number of Iterations
-1 1 3 5 7 9 11 13
0 200 400 600
Level
in
c
m
Time in secs
GA-PID
IMC-PID
-1 4 9 14 19 24 29 34 39
0 200 400 600
Level
in
c
m
Time in secs
GA-PID
IMC-PID
-1 4 9 14 19 24 29 34
0 200 400 600
Level
in
c
m
Time in secs
GA-PID
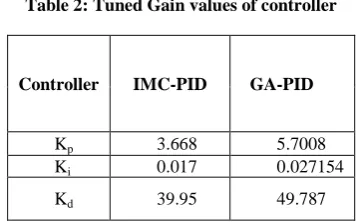
[image:4.595.327.532.86.462.2]Table 2: Tuned Gain values of controller
Controller IMC-PID GA-PID
Kp 3.668 5.7008
Ki 0.017 0.027154
Kd 39.95 49.787
Table 3: Comparison of Time Domain Analysis and Performance Indices
Specifications IMC-PID GA-PID
Rise Time (seconds) 90 42
Maximum overshoot(%) 3 11.2
Settling Time (seconds) 400 350
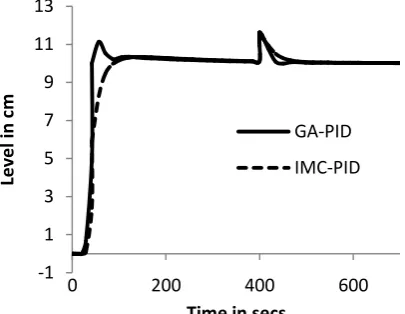
The controller parameters are calculated and implemented for set point 25 cm and shown in figure 8. The servo response of the process was observed by giving set points of 10 cm, 25 cm and 35cm. The corresponding variation of level from a set values are noted. The responses of the tank for all the respective set points with controller settings are presented in the Figure 8.
The performance estimation of proposed controllers are present in Table 3 based on time domain analysis. The response curve of the GA based controller has the advantage of a better closed loop time constant, which enables the controller act faster with minimum rise time and settling time. The response of IMC controller is more sluggish than the GA based controller is shown in Figure 9.
6. CONCLUSION
The developed PID controller using optimization technique and conventional tuning method are analysed. The performances for various set points can be suitably tracked and best among the two methods is highlighted. The results in figure 8 and table 3 are clearly favor to GA based PID control
scheme. It can be concluded that the tuned controller parameters based on GA optimization technique can yield a better performance than IMC based PID controller with lowest settling time, rise time and peak overshoot. The performances of controller are analyzed in time domain and are tabulated in table 3. Based on servo response and disturbance rejection are shown in figure 7 and figure 8 , GA based PID controller gives good results than IMC based PID controller. It is shown graphically that there is a substantial improvement in the time domain specification in terms of lesser rise time and settling time with the application GA based PID controller settings.
7. REFERENCE
[1] J. G. Ziegler and N. B. Nichols, “Optimum settings for automatic controllers,” Trans. Amer. Soc. Mech. Eng., vol. 64, pp. 759–768, 1942.
[2] G.H Cohen and G.A Coon: Theoretical Consideration of Retarded Control , Trans ASME 75,pp.827/834,1953.
[3] Astrom, K J.;. Hagglund .T , Automatic tuning of simple regulators with specifications on phase and amplitude margins, Automatica, 20,645- 651, 1984. [4] D. R. Coughanowar (1991), Process Systems
Analysis and Control, Tata McGraw Hill.
[5] W. B. Bequette (2003), Process Control Modeling and Simulation, Prentice Hall.
[6] S. M. Giri raj Kumar, R. Sivasankar, T. K. Radhakrishnan, V. Dharmalingam and N. Anantharaman , “Particle Swarm Optimization Technique Based Design of Pi Controller for a Real-Time Non-Linear Process”, Instrumentation Science & Technology, Volume 36, Issue 5, 2008 .
[7] P.Aravind and S.M.GirirajKumar,“ Performance Optimization of PI Controller in Non Linear Process using Genetic Algorithm”, International Journal of Current Engineering and Technology, Vol.3, No.5 (December 2013).
[image:5.595.47.288.225.312.2]