Multiple Museum Construct Motivators:
a Multivariable Analysis with Repertory
Grid Analysis (RGA) Approach
Vassiliadis, Christos and Fotiadis, Thomas A.
University of Macedonia, University of Macedonia
5 June 2007
Online at
https://mpra.ub.uni-muenchen.de/25373/
MULTIPLE MUSEUM CONSTRUCT MOTIVATORS-
A MULTIVARIABLE ANALYSIS WITH REPERTORY
GRID ANALYSIS (RGA) APPROACH
Christos Vassiliadis1
University of Macedonia
Thomas A. Fotiadis
University of Macedonia
This paper aims to present and highlight the importance of factors resulting from Repertory Grid Analysis (R.G.A.). Strategic planning management issues concerning the management of museum audience are studied. A short description of the R.G.A. and the corresponding literature is cited, and an empirical application of the aforementioned method in a sample of 128 university students, takes place. The application of RGA produced 1345 interpretation models (constructs) which were coded and analyzed with three multivariable statistical techniques. The paper clearly demonstrates the importance of the analysis of constructs in relation to the management (local authorities or private institutions) suggestions that concern the museums of a specific area. Also, it contributes to the evolution of a new research area for the Destination Marketing Management with emphasis on Place design practices and development. Cultural offers and special managerial suggestions about particular groups of museums (strategic museum groups), are also discussed.
Keywords: Museum Destination Marketing Management, Repertory Grid Analysis.
INTRODUCTION
Cultural tourism or heritage tourism is a special form of tourism that makes a significant economic contribution to profit and non-profit organizations that operate within local communities (Dickinson, 1996;
Daniels, 1993). Globalization has brought intense competition, even in
the field of cultural tourism, which means that the principles and techniques of modern marketing should be adopted in this growing sector
of tourism (Ashworth & Tunbridge, 2000). Research analyses of visitors’ preferences in relation to cultural exhibits are now internationally recognized. For example, the pan-European Research ATLAS was produced by the European Association for Tourism and Leisure Education in all member states during 1991–1992. In addition, the Council of Europe has promoted its “town schemes” program (Richards, 1996; Ashworth & Tunbridge, 2000). Further studies have been conducted by two professional organizations based in the USA—the American Association of Museums (AAM), and the International Council of Museums (ICOM).
A careful selection of marketing strategies is required during the planning stages-with respect to the development of destination image and management’s expectations of the frequency of visitors (Ashworth & Voogd, 1990; Gold & Ward, 1994). It should be noted that museums constitute an attractive destination for many visitors, and that in a sense, they complete a total tourism product—especially among certain target groups who have a preference for cultural attractions (ECTARC, 1989). In the USA, Scandinavia, and France, a tendency to establish new museums developed in the 1960s. In other countries, such as Britain, this tendency became more apparent after 1980, with specialized-subject exhibits on such topics as the economic, social, and industrial history of particular regions. Other developments in Britain have included ‘open-air museums’ during the 1980s and ‘hands-on’ science-based museums in the 1990s (Swarbrooke, 1995).
requires prudent planning. According to Gartner (2000, p. 190): “Image change, to be effective, depends on an assessment of present images”.
A thorough examination of images formed in the minds of visitors can be undertaken using interviews and the technique known as ‘Repertory Grid Analysis’ (RGA). This can allow discovery of the important factors and dimensions that relate to the proposed image change (Fransella & Bannister, 1977; Malhotra & Birks, 2003; Coshall, 2000; Embacher & Buttle, 1989).
The methodology of studies of museum audiences has usually included the use of standard questionnaires. One of the major problems faced by researchers was the inability to focus on variables that had not been included in the questionnaire. Qualitative studies have therefore been popular in this field—including in-depth interviews, focus groups, open interviews (informal conversations), user diaries, projective and ethnographic techniques, and observations (Swarbrooke & Horner, 2001, p. 178; Malhotra & Birks, 2003, pp. 178-200). In addition, the RGA approach has been adopted by several researchers in studying museum audience behaviour (Pike 2003; Caldwell & Coshall 2001; Coshall 2000; Jansen-Verbeke & Van Rekom, 1996).
REPERTORY GRID ANALYSIS (RGA) APPROACH
Rather than simply documenting facts that are already known, the RGA technique can lead to the discovery of previously unknown facts. This technique gives the researcher the opportunity to observe the wider environment as it is perceived by the consumers participating in the research (Coshall, 2000). This provides improved data for describing why a group of visitors behaves in a certain way—in this case the cognitive mechanism of deciding whether to visit or not to visit a museum.
An RGA usually involves one or more of the following statistical techniques:
• a non-parametric factor analysis with the use of dichotomous
scores (Kelly, 1955);
• a cluster analysis or ‘anchor method’ (Higginbotham and
Bannister, 1983; Malhotra & Birks, 2003, pp. 186-187; Winter, Sourmelakis & Noutsou, 2002, p.172); and/or
• a principal components analysis (PCA) (Slater, 1972; Malhotra
A PCA, statistical software is used to produce a graphic representation of the main variables, with their corresponding weights. Thus, the researcher can demonstrate the rating of museums as perceived by those who attend them. The analyst can outline the structure of various museums and demonstrate the opinions of frequent museum attendees with regard to those museums. An ‘average visitor’ can compare Museum A with Museum B in a graphic representation (see also Winter, Sourmelakis & Noutsou, 2002, pp.268), and then form (and reveal) his/her opinion on the relative merits of one construct with other constructs that are typical of museums.
The PCA constitutes the technique adopted in the present study (Fransella, Bannister & Bell, 2003; Bell 1994). The objective of the present analysis was to identify the important factors from numerous data with a view to discovering the most representative factors of constructs. Altered constructs can change the image of museums in the minds of frequent visitors, and thus affect their decision making concerning the realization of a visit regarding a given museum.
METHODOLOGY
The statistical analysis (chosen techniques) used in the present paper, were the following:
• Factor Analysis of constructs. The structure of constructs
contributed in indicating four characteristic categories of grouped museums.
• Discriminant Analysis, to detect and interpret variables and
relations between them that would probably contribute in distinguishing between potentially profitable groups of visitors (as in the case of audience visiting frequently or infrequently museums).
• Cluster Analysis, to describe groups of constructs which were
described “efficient” and were included in the six resulting groups of the frequent museum visitors.
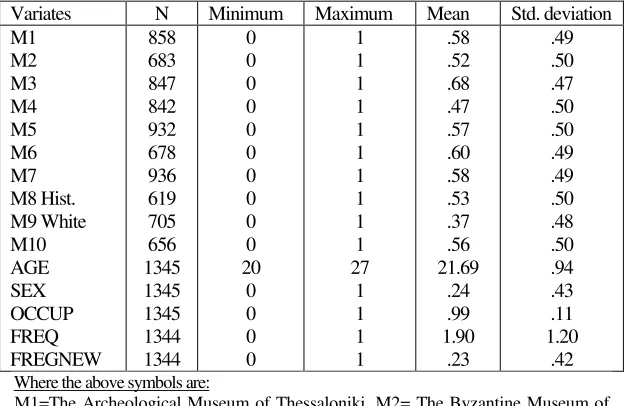
Table 1: Descriptive Statistics
Variates N Minimum Maximum Mean Std. deviation
M1 M2 M3 M4 M5 M6 M7 M8 Hist. M9 White M10 AGE SEX OCCUP FREQ FREGNEW 858 683 847 842 932 678 936 619 705 656 1345 1345 1345 1344 1344 0 0 0 0 0 0 0 0 0 0 20 0 0 0 0 1 1 1 1 1 1 1 1 1 1 27 1 1 1 1 .58 .52 .68 .47 .57 .60 .58 .53 .37 .56 21.69 .24 .99 1.90 .23 .49 .50 .47 .50 .50 .49 .49 .50 .48 .50 .94 .43 .11 1.20 .42
Where the above symbols are:
M1=The Archeological Museum of Thessaloniki, M2= The Byzantine Museum of Thessaloniki, M3= The War Museum of Thessaloniki, M4=Ttie Macedonian Museum of Thessaloniki, M5= The Technological Museum of Thessaloniki, MS^ The Telloglio Institution of Thessaloniki, M7= The Cinema Museum of Thessaloniki, M8= The History Center of Thessaloniki, M9= The White Tower Museum of Thessaloniki, M1O= The Museum of Photography in Thessaloniki, AGE=The age of tfte student target market, SEX=The sex of the student target market, OCCUP= The occupation FREQ= The frequency of museum visits in a year . The variables above has roan evaluated on metric bipolar and interval scales were: a) variable SEX on 0="Female" and i="Mate", b) occupation (OCCUP) on O="0thei" and 1="Student", c) Frequency of visits in a year (FREQ) recocted m 0="2 and under itiyKegm visits and 1= "3 and over museum visits in a year", d) Age (AGE) on interval scale, e) Museums (from M1 to M10) where O=contrast and 1-contruct of the repertory grid, values.
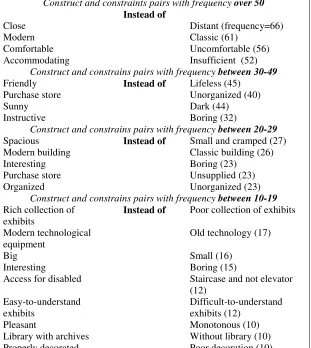
Figure 1. Personal repertory grid construct and constraints pairs for the target market of students with visiting frequency equal or more than 10 (Frequency of construct and constrains pair >10) and table of Conceptual Strengths (= constructs) and Weaknesses (= constraints) of the museums belonging in the analysis sample.
Construct and constraints pairs with frequency over 50
Instead of
Close Distant (frequency=66)
Modern Classic (61)
Comfortable Uncomfortable (56)
Accommodating Insufficient (52)
Construct and constrains pairs with frequency between 30-49
Friendly Insteadof Lifeless (45)
Purchase store Unorganized (40)
Sunny Dark (44)
Instructive Boring (32)
Construct and constrains pairs with frequency between 20-29
Spacious Instead of Small and cramped (27)
Modern building Classic building (26)
Interesting Boring (23)
Purchase store Unsupplied (23)
Organized Unorganized (23)
Construct and constrains pairs with frequency between 10-19
Rich collection of exhibits
Instead of Poor collection of exhibits
Modern technological equipment
Old technology (17)
Big Small (16)
Interesting Boring (15)
Access for disabled Staircase and not elevator
(12) Easy-to-understand
exhibits
Difficult-to-understand exhibits (12)
Pleasant Monotonous (10)
Library with archives Without library (10)
Properly decorated Poor decoration (10)
with the two remaining museums cards (“elements”) (see also Caldwell & Coshall, 2001; Coshall, 2000, p. 86). Each student expressed a positive opinion for his/ her option (i.e. motive for visiting a specific museum) and checked the “strengths +” column for each positive option, and the “weaknesses -”column for each negative option. In particular, the following symbols were used for the completion of the repertory grid: “*” (asterisk) with coding 0 (zero) and the “/” (dash) with coding 1 (one). This procedure is similar to the one adopted by Coshall (2000). The procedure continued until the grid was filled. On the average, 10.5 Strengths (=constructs) were expressed per student (in total 1345 personal constructs to 128 students). A number of these constructs was repeated. The repetition of “constructs” and “constrains” pairs (or the statistically high frequency of their appearance), constitute in this case an index analysis that is presenting the constructs that are mainly repeated in the analysis of all Museums as well as of the Museum of our interest (see figure 1).
Based on Factor Analysis Coding, the repertory grids were prepared so as to be processed by the PCA statistical technique (Malhotra & Birks, 2003, p. 185-187; Coshall, 2000, p. 88; Caldwell & Coshall, 2001).
FACTOR ANALYSIS OF THE RGA RESULTS
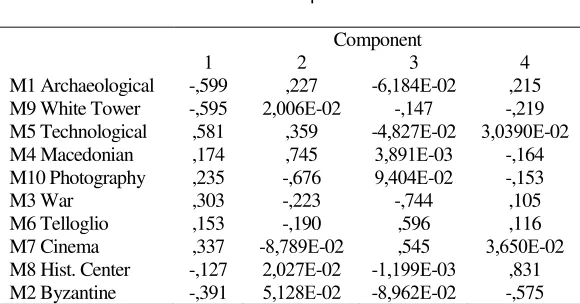
From the Factor Analysis approach (Aaker, Kumar and Day 2003, p.563-575) with the use of the Principal Components Analysis (PCA) method, four factors of basic components were acquired with an eigenvalue bigger than one. A Varimax Orthogonal Rotation procedure of the four components followed, as did the interpretation of each factor based on factor loadings that resulted from the loading of 10 variables, namely the constructs of the ten museums in the four factors (see Table 2).
At the second component, the variable Macedonian Struggle Museum (“M4 Macedonian”) bears the larger load (factor loading= 745), while the Museum of Photography follows (“M10 Photography”) (factor loading=-676).
Table 2: Rotated Component Matrix
Component
1 2 3 4
M1 Archaeological M9 White Tower M5 Technological M4 Macedonian M10 Photography M3 War M6 Telloglio M7 Cinema M8 Hist. Center M2 Byzantine -,599 -,595 ,581 ,174 ,235 ,303 ,153 ,337 -,127 -,391 ,227 2,006Ε-02 ,359 ,745 -,676 -,223 -,190 -8,789Ε-02
2,027Ε-02
5,128Ε-02
-6,184Ε-02 -,147 -4,827Ε-02
3,891Ε-03
9,404Ε-02 -,744
,596 ,545 -1,199Ε-03 -8,962Ε-02
,215 -,219 3,0390Ε-02 -,164 -,153 ,105 ,116 3,650Ε-02 ,831 -,575
Extraction method: Principal Component Analysis Rotation method: Varimax with Kaiser Normalization 1. Rotation converged in 5 iterations.
At the third component, the variable War Museum (“M3 War” museum) bears the larger load (factor loading=-744), and following there are the variables of Telloglio Museum (“M6 Telloglio” museum) (factor loading=596) and Cinema Museum (“M7 Cinema” museum), (factor loading=545).
At the fourth component or factor, the variable History Center Museum (“M8 History Centre”) bears the larger load (factor loading=831), while the variable of the Byzantine Museum follows (“M2 Byzantine” museum) (factor loading=-575).
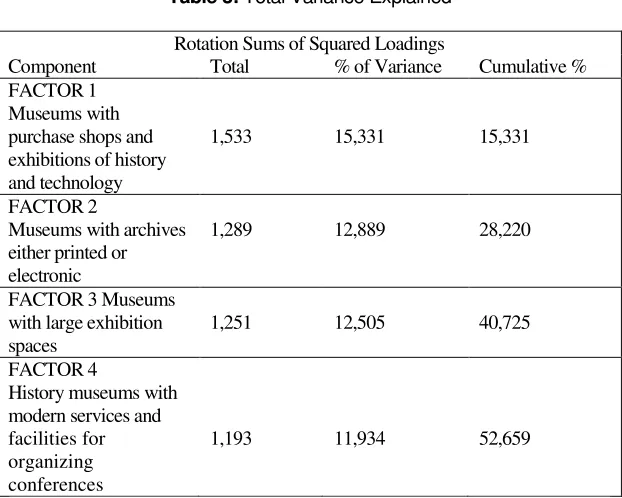
Table 3: Total Variance Explained
Rotation Sums of Squared Loadings
Component Total % of Variance Cumulative %
FACTOR 1 Museums with purchase shops and exhibitions of history and technology
1,533 15,331 15,331
FACTOR 2
Museums with archives either printed or electronic
1,289 12,889 28,220
FACTOR 3 Museums with large exhibition spaces
1,251 12,505 40,725
FACTOR 4
History museums with modern services and facilities for organizing conferences
1,193 11,934 52,659
Extraction Method: Principal component analysis
DISCRIMINANT ANALYSIS
This analysis examined the four factors that express specific types of museums with the use of corresponding factor scores for the formation of an equation that will separate the frequent museum audience visiting museums more than 3 times per year (Heavy Users with Code No=1) in relation to museum audience that is visiting museums less than 2 times per year (Middle and Light Users with Code No=0). In particular, the use of Discriminant Analysis (Aaker, Kumar & Day 2003, p.541-554), is used in order to clarify whether an equation including all four factors can lead to the separation between the two groups of frequent visitors. The analysis included 1344 valid cases.
two groups. In our case the results did not show differences between the two groups of museum visitors (see table 4).
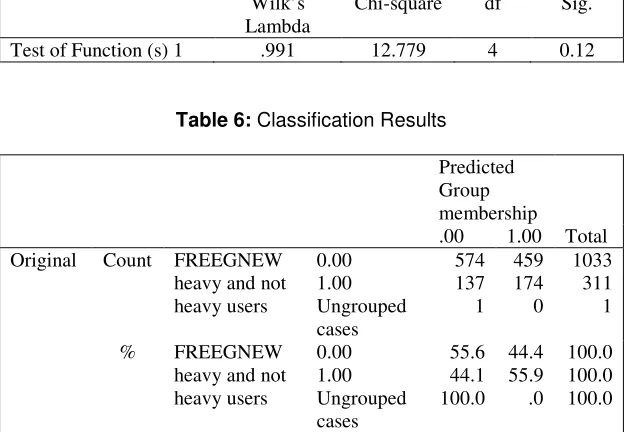
The check of function based on Wilk’s Lamda (Test of Function) illustrated that practically 100% of the function is not justified (Wilk’s Lamda =0.991) from the differences of groups representing the two categories of frequent museum visitors (see table 5). It is thus verified the zero statistical hypothesis that the averages of all factors that are present in the groups of frequent visitors, are equal. The corresponding value of statistical control gives X2001=13.277 namely a value larger than 12.779 that resulted for the equation. This means that among centroids of the two groups of visitors, none important difference is present (see table 5).
[image:11.420.56.369.249.547.2]In addition, the percentage of properly distributed values was 55.7%, which is quite lower in relation to the normal percentage of 86% (see table 6).
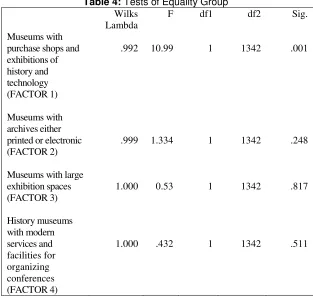
Table 4: Tests of Equality Group
Wilks Lambda
F df1 df2 Sig.
Museums with purchase shops and exhibitions of history and technology (FACTOR 1)
.992 10.99 1 1342 .001
Museums with archives either printed or electronic (FACTOR 2)
.999 1.334 1 1342 .248
Museums with large exhibition spaces (FACTOR 3)
1.000 0.53 1 1342 .817
History museums with modern services and facilities for organizing conferences (FACTOR 4)
The Discriminant Analysis was applied on the four factors in order to verify whether there can be an equation separating the frequent museum visitors, based on different sexes. The analysis shown that even in the case of different sex, there was no important distinction since the ratio Wilks’ Lamda (Test of Function) confirmed that almost 100% of the variance is not justified by the differences of groups expressed by the two categories of frequent visitors. In addition, the percentage of the properly distributed values was in that case also low (=52.6%).
The Discriminant analysis showed that in the case of the four factors, it is not possible for one to structure a function that will support the distinction between statistically important groups as far as the differences are concerned, when, the variables used for the statistical analysis or for same data sets, concern the variables of “sex” and the “frequency of visits”. In other words, as far as these four factors are concerned, there are important similarities when they are described with the variables of sex and frequency of visits.
Table 5: Wilks’ Lambda
Wilk’s Lambda
Chi-square df Sig.
[image:12.420.56.371.297.513.2]Test of Function (s) 1 .991 12.779 4 0.12
Table 6: Classification Results
Predicted Group membership
.00 1.00 Total
Original Count FREEGNEW
heavy and not heavy users
0.00 1.00 Ungrouped cases
574 137 1
459 174 0
1033 311 1
% FREEGNEW
heavy and not heavy users
0.00 1.00 Ungrouped cases
55.6 44.1 100.0
44.4 55.9 .0
100.0 100.0 100.0
FACTOR-CLUSTER SEGMENTATION ANALYSIS APPROACH
[image:13.420.57.369.323.441.2]Following the aforementioned ascertainment, there was a description of visitors with the combination of two multivariable techniques; the Factor-Cluster segmentation analysis (Smith & Smale, 1982; Stynes & Mahoney, 1980; Aaker, Kumar & Day, 2003, p.562-592). As already mentioned, the Factor Analysis procedure, produced four components (factors) that were used in order to group observations, namely constructs that were grouped in statistically homogenous groups (clusters or segments). A Cluster Analysis followed for the purpose of presenting dissimilar segments of visitors that had internal similarities and had great differences as far as the variable of constructs is concerned. The number of clusters (groups) to be analyzed should be first defined before going to the K-means Cluster Analysis Approach or else Partitioning method of Clustering, which is recommended for large samples (n=over 200 cases) (Arabie, Hubert & Carroll, 2005, p.319). The solution of this problem was based on the hierarchical method following a series of applications on random samples (samples 30% of the initial or n=416) and corresponding groupings (clustering), the number of 6 clusters.
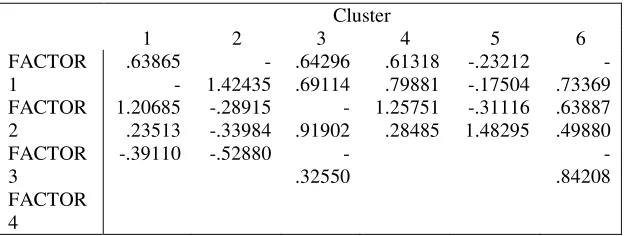
Table 7: Final Cluster Centers
Cluster
1 2 3 4 5 6
FACTOR 1 FACTOR 2 FACTOR 3 FACTOR 4 .63865 -1.20685 .23513 -.39110 -1.42435 -.28915 -.33984 -.52880 .64296 .69114 -.91902 -.32550 .61318 .79881 1.25751 .28485 -.23212 -.17504 -.31116 1.48295 -.73369 .63887 .49880 -.84208
The museum clusters (or groups) were characterized based on the factors that resulted from the application of PCA (Principal Component Analysis) upon the data of constructs. In the case of the members of group 4, there is a higher ratio related to visiting museums of factors 2 and 3 (FACTOR 2 = 0.79, FACTOR 3 = 1.25). Correspondingly, as far as the members of group 5 are concerned, there is a higher ratio related to visiting museums of factor 4 (FACTOR 4 = 1.48) and finally, as far as the members of group 6 are concerned, there is a lower ratio related to visiting museums of factor 4 (FACTOR 4 = 0.84). The analysis of relations between clusters and factors leads to findings that can support the description of frequent visitors (see below table 11).
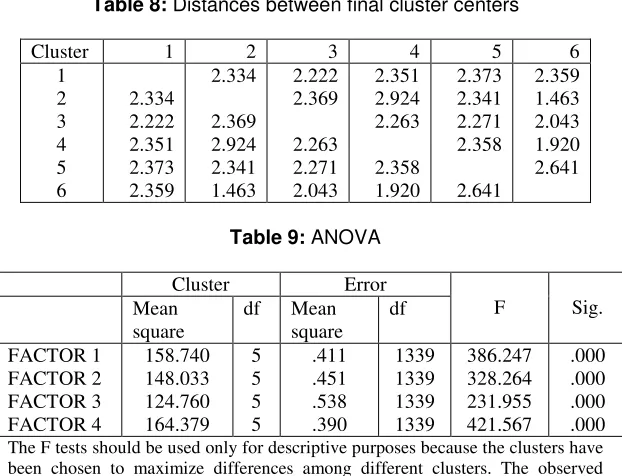
[image:14.420.59.370.237.475.2]The means of clusters 2 and 4 are apart (2.924) while clusters 2 and 6 seem to be the ones that are closer (1.463) (see table 8).
Table 8: Distances between final cluster centers
Cluster 1 2 3 4 5 6
1 2 3 4 5 6 2.334 2.222 2.351 2.373 2.359 2.334 2.369 2.924 2.341 1.463 2.222 2.369 2.263 2.271 2.043 2.351 2.924 2.263 2.358 1.920 2.373 2.341 2.271 2.358 2.641 2.359 1.463 2.043 1.920 2.641
Table 9: ANOVA
Cluster Error
F Sig.
Mean square
df Mean
square df FACTOR 1 FACTOR 2 FACTOR 3 FACTOR 4 158.740 148.033 124.760 164.379 5 5 5 5 .411 .451 .538 .390 1339 1339 1339 1339 386.247 328.264 231.955 421.567 .000 .000 .000 .000
The F tests should be used only for descriptive purposes because the clusters have been chosen to maximize differences among different clusters. The observed levels of significance are not checked for this and thus, cannot be interpreted as tests of the hypothesis that the cluster means are equal.
other factor variances, while the mean values corresponding to the 6 groups of factor 3 are less different in comparison to the remaining factor variances (FFACTOR 3 = 231.955).
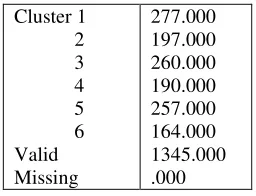
[image:15.420.148.276.196.294.2]Thus, constructs corresponding to the museums of all groups should be presented as “close” to all clusters. As far as the numerical distribution of constructs to clusters is concerned, group 1 (n1=277) has the majority of constructs while less constructs were classified to group 6 (n6=164) (see table 10).
Table 10: Number of cases in each cluster
Cluster 1
2
3
4
5
6 Valid Missing
277.000 197.000 260.000 190.000 257.000 164.000 1345.000 .000
Following the end of grouping (clustering analysis) which was based on the Factor Scores of the PCA statistical approach, Cross-Tabulations were formed between variables of the auxiliary description (namely the variables: “sex”, “age”, “frequency of annual visits”, “Museums” and “names of constructs”), and of the six groups (see table 11). Based on descriptions of table 11 and on the results of former analyses, constructs of the segment of frequent visitors were interpreted. In the next section, suggestions about the Administration and Marketing management of the above mentioned museums take place.
Table 11: Identification of the 6 student clusters on the basis of 4 construct factors and other profiling variables
Cluster % of sample
(n=1345)
Description
1 20.6 Mainly young and older female students 21 to
services, spacious, close, modern, organized, contemporary, friendly and sunny. They visit museums two or three times per year and there is a small percentage of students visiting museums more than 4 times per year.
2 14.6 Mainly young and older female students 21 to
27 years old. Main fans of the White Tower Museum and fans of the Archaeological and Byzantine Museums. Frequent visitors of the museums of this category describe museums as comfortable, spacious, with rich collections of exhibits, organized and fully supplied purchase stores, friendly staff. They visit museums 1 to 3 times per year and their visiting frequency is not more than 4 times per year.
3 19.3 Mainly young female students 21 to 22 years
old. Main fans of the War, Technology and Macedonian Museums. Frequent visitors of the museums of this category describe museums as comfortable, attracting, informative, spacious, close, modern, friendly and sunny. They visit museums 1 to 2 times per year and there is a small percentage visiting museums more than 4 times per year.
4 14.2 Mainly young female students 21 to 22 years
old. Main fans of the Cinema, Technology and Macedonian Museums as well as of the Telloglio Foundation. Frequent visitors of the museums of this category describe museums as intriguing, informative, with good services, with rich collections, modern and friendly. They visit museums 1 to 2 times per year and their visiting frequency does not exceed the 4 times per year.
5 19.1 Mainly young and mature female students 21 to
and Macedonian Museums. Frequent visitors of the museums of this category describe museums as comfortable, informative, with good services, close, big, organized, modern and with state-of-the-art equipment, friendly and sunny. They visit museums 1 to 3 times per year and they present the highest percentage in museum audience since their visiting frequency is more than 4 times per year.
6 12.2 Mainly young and mature female students 21 to
27 years old. Main fans of the Archaeological and Byzantine Museums. Frequent visitors of the museums of this category describe museums as informative, with good services, close and friendly. They visit museums 1 to 2 times per year and there is also a small percentage visiting museums more than 4 times per year.
ADMINISTRATIVE SUGGESTIONS AND DISCUSSION
Taking into account the above mentioned, and based on results of statistical analyses, indicative administrative suggestions concerning the Marketing Management of museums can be formed.
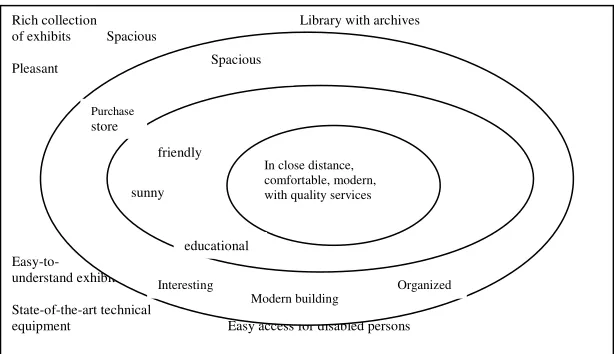
[image:18.420.63.370.345.522.2]Close observation of figure 1 which presents the most important frequencies of constructs that resulted from the Repertory Grid Analysis, can lead to practical conclusions about the elements of marketing mix for 10 museums found in the area. In the centre of figure 2, which presents concentric cycles, the most important strengths of museums appearing in a reference frequency of 50 and more, are shown. These constructs constitute the core of the competitive advantages of the museums as they were expressed by the university students. Distance, modern style and comfortable facilities- services constitute the centre of constructs that are at the same time the strengths of museums. Museums should correspond to the mentioned features in order to appeal to this group of visitors. In order to attract students, museums should process solutions that will include fast and easy transportation from regions frequented by students, and should lay emphasis on their facilities and services. Promotion should stress these main core features while any promotional material should be distributed in places frequented by students such as internet cafés, student offices, university campuses, info-kiosks, restaurants and bars.
Figure 2: The entire conceptual construct product of museum visitors
Rich collection Library with archives
of exhibits Spacious
Pleasant
Easy-to- understand exhibits
State-of-the-art technical
equipment Easy access for disabled persons
Purchase
store
Spacious
friendly
sunny
educational
In close distance, comfortable, modern, with quality services
Interesting
Modern building
In the three levels of the concentric centres, there are elements from constructs related to the staff (“friendly”, “easy-going”, “giving information about the exhibits”), architecture and decoration of the building (“sunny”, “modern”, “organized”, “spacious”, “pleasant”, “big”, “properly decorated”), facilities (“purchase store”, “information leaflets”, “easy-to-understand exhibits”, “access for disabled persons”, “state-of-the-art technical equipment to inform visitors” and “service visitors-customers”, “library with archives”), and finally, exhibits (“rich collections and information that helps visitors to understand” and “appreciate exhibits”). These elements constitute the additional values that each museum should acquire/support and promote, in order to differentiate itself from other museums located in different areas and destinations. As far as frequent museum visitors are concerned, and, based on the results of the Discriminant Analysis performed for the purposes of the present research, it should be highlighted that, the mean visitor of each factor that includes a group of museums, is described more or less in the same manner, since no differentiations exist - taking into account the variables “sex”, and “frequency of visits” in relation to the four factors that resulted from the PCA Approach. In this case, the use of the proper strategy to target all students should include a centralized marketing strategy, which would also be cost-effective (Kotler 2003, p.300). Obviously, this is a fact that should be taken into account by the local government vehicles that usually do not support marketing actions for a destination where museums are points of attraction - mainly because of their limited budget.
ADMINISTRATIVE SUGGESTIONS FOR MUSEUM GROUPS (STRATEGIC GROUPS OF MUSEUM ATTRACTIONS)
museums). In the case of group 4, there is a trend for a higher ratio in relation to the selection of factor 2 museums (Museums with printed and electronic archival material) and 3 (Large exhibition museums). Correspondingly, as far as the members of group 5 are concerned, there is a trend for higher ratio in relation to the selection of museums of factor 4 and finally, regarding group 6, there is a trend for lower ratio in relation to the selection of factor 4 museums (History museums with modern services and facilities for organizing conferences). Consequently, if a marketing strategy was to be formulated regarding the museum groups, it should be noted that there are two alternative solutions. If it is necessary to support the 4 museum categories as they are formed by Factor Analysis with PCA statistical technique, then, “Museums with purchase stores and display areas for history and technology” of factor 1 should be connected to cluster 1(which describes constructs and frequent visitors of this piece of market). In the case of factors 2 and 3 (namely of the “museums with printed and electronic archival material and museums with large showrooms”), frequent visitors should be traced within group 4 (cluster 4). Finally, in the case of “history museums with modern services and facilities for the organization of lectures” (factor 4) frequent visitors from cluster 5 are more likely to be chosen. Alternatively, classifying factors could be avoided, and one could depend on a more detailed analysis of museums, constructs and descriptive variables characterizing the six group categories. The second case could be used in order to introduce another museum in a category concerning the promotion, and to support the cultural values. If a strategy connected to the most profitable group was to be chosen, it would probably concern group 5, since this group represents the highest percentage of people visiting museums annually – compared to the rest of the groups. Those museums visited by the aforementioned group, have historic character and attract older students. Based on frequent visitors’ remarks, these museums meet all important elements already existing in the core of the conceptual construct product that has been presented in figure 2. They also combine elements of the wider conceptual product. Marketing strategy for attracting frequent visitors that belong in this segment should be selective or modified.
CONCLUSIONS
techniques are examined. The difference of marketing strategies was underlined in the aforementioned empirical example in the case where Discriminant Analysis is applied with the variable “sex” as a demographic variable, and the “frequency of visits” as a behavioural variable. The Discriminant Analysis has not supported a statistically important difference between the two categories (namely, frequent visitors coming more than three times, and infrequent visitors, coming up to two times correspondingly) of the two aforementioned variables when a linear model that would include the factor scores of 4 factors, had been applied. Consequently, in museums that are part of the 4 factors, one would choose the centralized marketing approach by forming a proper and attractive marketing mix for all possible categories of frequent visitors. In addition, the combination of the 4 categories of factor scores with the 6 student clusters (that resulted based on the 4 categories of factor scores, and after crossing with other descriptive variables), produced specialized results for sections of frequent visitors and thus, specialized or different marketing strategies could be developed as in the case of factor 4 that was combined with cluster 5.
REFERENCES
Aaker D. A., Kumar, V. & Day, G. S. (2003). Marketing Research. USA: John Wiley and Sons, Inc.
[AAM] American Association of Museums. Http://www.aam-us.org.
Accessed the 15th of July 2005, at 00:20.
Arabie, P., Hubert, L. J. & Carroll J. D. (2005). Clustering. Encyclopedia of Social Measurement, Vol. 1, pp. 317-320.
Ashworth, G. J. & Voogd, H. (1990). “Can places be sold for tourism?”
In G. J. Ashworth, and B. Goodall (Eds.), Marketing Tourism
Places (pp.1-16). London: Routledge.
Ashworth, G. J. & Tunbridge, J. E. (2000). The Tourist-Historic City, Retrospect and Prospect of Managing the Heritage City. Netherlands: Pergamon.
Gold, J. R. & Ward, S. (1994). Place Promotion. London: Belhaven.
Caldwell, N. & Coshall, J. (2001). Measuring Brand Associations for
Museums Galleries using Repertory Grid Analysis.
Http://www.londonmet.ac.uk/Demo_Shado/index.cfm?5CBEA749-
ABD7-F3F6-A5C1-221785E63291.Accessed the 15th of July 2005, at
22:12.
Callegari, F. (2003). Sustainable development prospects for Italian
coastal/cultural heritage: 2 case studies. Journal of Cultural
Heritage, Vol. 4, No. 1, pp. 49-51.
Coshall, J. T. (2000). Measurement of Tourists' Images: The
Repertory Grid Approach. Journal of Travel Research, Vol. 39,
August 2000, pp. 85-89.
Daniels, P. W. (1993). Service Industries in the World Economy. Oxford: Blackwells.
Dickinson R. (1996). Heritage Tourism is Hot. American Demographics, Vol. 18, No. 9. Http://www.findarticles.com/p/articles/mi_m4021/pg_3. Accessed the 15th of July 2005, at 21:13.
ECTARC. (1989). Contribution to the Drafting of a Charterjor—
Qaltuial Tourism. European Center for Traditional and Regional Cultures. Wales: Llangollen.
Embacher, J. & Buttle, F. (1989). A Repertory Grid Analysis of Austria’s Image as a Summer Vacation Destination. Journal of Travel Research,
Vol. 27, (winter), p. 3-7.
Fransella, F., Bannister, D. & Bell, R. C. (2003). A manual for the
repertory grid technique, Second edition. Chichester: Wiley
Fransella, F. & Bannister, D. (1977). Manual for Repertory Grid
Technique. London: Academic Press.
Gartner, W. C. (2000). Image and sustainable tourism systems. In. S.
Wahab, and J. J. Pigram (Eds.), Tourism Development and Growth-the challenge of sustainability (pp.179-198). London-New York: Routledge. Higginbotham, P. G. & Bannister, D. (1983). The GAB computer program for the analysis of repertory grid data. Ilkley, UK: High Royds Hospital.
[ICOM] International Council of Museums. Http://icom.museum/vlmp/ Accessed the 15th of July 2005, at 01:20.
Jansen-Verbeke, M. and Van Rekom, J. (1996). Scanning museum visitors- Urban Tourism Marketing. Annals of Tourism Research, Vol.23, No.2, pp.364-375.
Kalogeropoulou, H. (1996). Cultural Tourism in Greece. In G. Richards
(Eds.), Cultural Tourism in Europe (pp. 183-196). UK: CAB
International.
Kotler, P. & Armstrong, G. (1994), Principles of Marketing. NJ: Prentice– Hall International Englewood Cliffs.
Khalife, K. (2000). What is Marketing? Is your museum's definition inside out. Http://www.museummarketingtips.com/articles/marketing_what.html. Accessed the 10th of July 2005, at 12:50.
Kelly, G. A. (1955). The psychology of personal constructs. New York:
Norton.
Kotler, N. G. & Kotler, P. (2002). Museum Strategy and Marketing
Designing Missions, Generating Revenue and Resources. USA: Routledge.
Malhotra, N. K. & Birks, D. F. (2003). Marketing Research- An Applied Approach. Italy: Prentice Hall.
Pike, S. (2003). The Use of Repertory Grid Analysis to Elicit Salient
Short-Break Holiday Destination Attributes in New Zealand. Journal of
Travel Research, Vol. 41, (February), pp. 315-319.
Richards, G. (1996). The Scope and Significance of Cultural Tourism. In G . Richards (Eds.), Cultural Tourism in Europe (pp.19-46). UK: CAB International.
Slater, P. (1972). Notes on INGRID 72. London: St. George's Hospital in Http://www.terapiacognitiva.net/record/pag/contents.htm. Accessed the 15th of July 2005, at 12:20.
Smith, S. L. J. and Smale, B. J. A. (1982). The changing demand for culture: estimation of cultural elasticities. Visions in Leisure and Business, Vol. 1, No. 2, pp. 22-47.
Stynes, D. J. & Mahoney, E. M. (1980). Michigan downhill ski marketing study: segmenting active skiers. Research report 391.
Swarbrooke, J. (1995). The Development and Management of Visitor
Attractions. Great Britain: Butterworth-Heinemann.
Swarbrooke, J. & Horner, S. (2001). Consumer Behaviour in Tourism. Great Britain: Butterworth Heinemann.
UNESCO. (1994). Statistical Yearbook. Paris: UNESCO.
Winter, D. Soumerlakis, Μ. & Noutsu, Η. (2002) (in Greek). The theory
of personal constructs. In G. Potamianos and comp. Personality
Theory and Clinical Practice. Publ. Athens: ΕΛΛΗΝΙΚΑ
ΓΡΑΜΜΑΤΑ.
SUBMITTED: JUNE 2007
REVISION SUBMITTED: NOVEMBER 2007 ACCEPTED: JANUARY 2008
Christos Vassiliadis ([email protected]) is a Lecturer at the University of Macedonia, Department of Business Administration, 34 Eyfrosinis str., 56224, Thessaloniki, Greece.