ROC Analysis of Partitioning Method for Activity
Recognition Using Two Microphones
Jame A Ward
∗
, Paul Lukowicz
†
and Gerhard Tr¨oster
‡
Abstract. We present an analysis, using ROC curves, of a method for partitioning continuous activ-ity data using two microphones. The algorithm is based on utilising the difference in sound intensactiv-ity recorded by microphones placed on the upper arm and on the wrist. We show that the method is feasi-ble for detecting activities involving the interaction of the hand with tools or machinery where noise is produced close to the hand. We also show that the method is relatively robust across multiple subjects.
1.
Introduction
Activity recognition for application in a maintenance or assembly scenario is currently a hot topic in the field of wearable computing. The development of such systems is the aim of the current European Union WearIT@Work project in which our group participates. To compliment this work we have developed a mock assembly scenario in a wood workshop which provides a useful dataset upon which techniques for activity recognition can be realised and evaluated. The first dataset, as reported in [2], was collected using two microphones placed at different parts of the body, together with a number of 3-axis accelerometers. It involved a single subject performing a series of pre-defined activities using typical woodwork tools (hammer, saw, file, sandpaper, screwdriver, drill, grinder, vise and drawer). One of the drawbacks of this work was in the use of a single subject. This has since been rectified by increasing the number of subjects to five. Whereas the broader work on development of activity recognition for this environment is ongoing, recent results from an analysis of the partitioning method using sound are presented here.
1.1. The partitioning problem
The main problem tackled in this work is that of partitioning, i.e. finding the beginning and end times of interesting events from a continuous stream of data. The assumption is that once this information is known, then recognition can then be performed by classifying such interesting events in isolation from the non interesting (garbage or null) events.
Our solution to this problem is to use sound analysis to identify relevant signal segments. In particular we use the intensity difference between wrist and upper arm mounted microphones in such a way that it allows us to detect sounds made close to the hand.
∗Swiss Federal Institute of Technology (ETH), Wearable Computing Lab, 8092 Z¨urich, CH, email:
†UMIT, Biomedical Informatics, Innsbruck, AT, email: [email protected]
The approach is based on the assumption that all of the activities we are interested in produce some kind of noise close to the hand. While this is certainly not true for arbitrary human activities, in our case it is a reasonable assumption, as most assembly tools and machines produce characteristic sounds. Any time where such characteristic sounds are not detected is defined as as null.
This algorithm was presented initially in [3] and implemented in [2]; this paper continues this work and applies the algorithm to a multiple subject scenario, however we limit this treatment to an anal-ysis of the intensity analanal-ysis algorithm alone and make no attempt to smooth or filter the output as suggested in [2].
2.
Intensity Analysis (IA) Using Two Microphones
Our partitioning cues are obtained from an analysis of the difference in sound intensity from two different microphone positions. It is based on the following ideas:
1. Most activities are likely to be associated with a characteristic sound which will originate in the proximity of the hand.
2. In general, two microphones 1 and 2 placed at different locations on the body will have a different distance from the source of any sound. Thus the signal intensitiesI1 andI2 will also be different. Since the intensity of a sound signal is inversely proportional to the square of the distance from its source, the ratio of the two intensitiesI2/I1 depends on the absolute distance
of the source from the user. Assuming that the sound source is located at the distanced from the first microphone andd+δfrom the second, the ratio of the intensities is proportional to:
I1 I2
' (d+δ)
2 d2 =
d2+dδ+δ2
d2 = 1 + δ d +
δ2 d2
For sound sources located far from both microphones (and thus from the user),dwill be much larger thenδ (sinceδ can not be larger than the distance between the body parts on which the microphones are located). As a consequence the quotient will be close to one. If, on the other hand, the source is very close to the first microphone, thendwill in general be smaller thanδ. This in turn means thatI1/I2will get much larger then one. This is an indication that the source
of a sound is located very close to the body part on which microphone1is placed. Putting the first microphone at the wrist, and the second one on the upper arm, we can use a large quotient as a sign that the sound was generated close to the user’s hand.
Based on these ideas, the intensity analysis (IA) algorithm works as follows:
1. Slide a window wia, in increments of jia, over both channels of audio data, calculating the
signal intensity ratioI1/I2 at each step
2. For each window, calculate the difference between the intensity ratio and its reciprocal, i.e.:
I1/I2 −I2/I1. This provides a more convenient metric for thresholding: zero indicating a far
off (or exactly equidistant) sound, while above or below zero indicates a sound closer to the microphones1and2respectively.
3. Compare this ratio difference with a suitable thresholdTia, which if passed indicates a
2.1. Assembly Experiment with a Wood Workshop
In this experiment, mic. 1was placed near the wrist and mic. 2 at a relatively fixed distance away on the upper arm. The audio streams were sampled at 2kHz. The window size wia chosen for this
sample frequency was 100ms, with an incrementjiaof 25ms.
Five subjects were employed (1 female, 4 male), each performing a sequence of activities in repetition between 3 and 6 times producing a total of (3+3+4+4+6)=20 recordings. Each sequence lasted on average five minutes. (Some subjects performing more repetitions than others due to a combination of technical problems in recording and availability.)
Each of the activities were separated into four distinct sound categories: handheld - sounds produced by the use of some object (or tool) held in the user’s hand; machine - sounds produced by an external machine with which the user might interact; quiet - activities which do not produce much noise, or produce noise away from the user’s hand; and null - the ’garbage’ class of background noises and silences.
The table below shows each of the four categories and gives the total duration (in seconds) represented in the collected data, together with the constituent activities.
category activities total time(s)
handheld hammer, saw, sandpaper, file 1119
machine drill, grinder, drawer 1178
quiet screwdriver, vise 938
null ” 2778
3.
Results
In order to gain a better idea of how the algorithm works over a range of threshold valuesTia, graphs
plotting the Receiver Operator Characteristic (ROC) were used[1]. ROC curves plot true positive rate (or recall) against the false positive rate (fp), as defined below, for a sweep of some decision parameter (in this caseTia):
T rueP ositiveRate=recall = T rueP ositiveT ime
T otalP ositiveT ime (1)
F alseP ositiveRate =f p = F alseP ositiveT ime
T otalN ullT ime (2)
Where Positive time refers to the duration of each non-null activity, and Null time refers to duration of null.
The recall for each activity category handheld, machine, quiet, and an average over all activities -was plotted against the false positive rate for eachTia(across the range 5 to -5). The results for each
0 0.2 0.4 0.6 0.8 1 0 0.2 0.4 0.6 0.8 1 jamie
False Positive Rate
True Positive Rate (Recall)
5 0 5 0 5 0
0 0.2 0.4 0.6 0.8 1
0 0.2 0.4 0.6 0.8 1 roberto
False Positive Rate True Positive Rate (Recall) 5
0
5
0
5
0
0 0.2 0.4 0.6 0.8 1
0 0.2 0.4 0.6 0.8 1 thomas
False Positive Rate True Positive Rate (Recall) 5
0 5 0 5 0 handheld machine quiet all random
0 0.2 0.4 0.6 0.8 1
0 0.2 0.4 0.6 0.8 1 dave
False Positive Rate
True Positive Rate (Recall)
5 0 5 0 5 0
0 0.2 0.4 0.6 0.8 1
0 0.2 0.4 0.6 0.8 1 veron
False Positive Rate
True Positive Rate (Recall)
5 0 5 0 5 0
0 0.2 0.4 0.6 0.8 1
0 0.2 0.4 0.6 0.8
1 all subjects
False Positive Rate
True Positive Rate (Recall)
[image:4.595.107.541.94.362.2]5 0 5 0 5 0
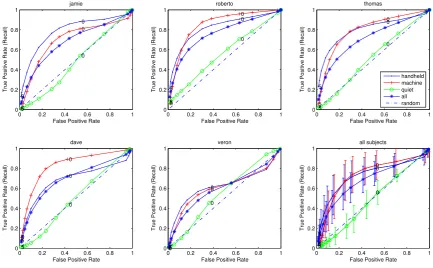
Figure 1. ROC graphs for the five subjects, and (bottom right) mean and standard deviation (of recall) over all subjects. Each graph plots the recall versus false positive rate over a sweep ofTiafor each activity set (handheld,
machine, quiet and all activities.) The point whereTia= 0is shown on each curve (with positive thresholds to the
left and negative to the right of this point.)
recall and mean fp (for a given threshold value) over all subjects. The standard deviation of the recall measure is shown by the error bars.
3.1. Analysis of results
As might be expected, the IA algorithm picks out both handheld and machine activities consistently better than quiet activities.
For most subjects, the machine sounds produce the best results of all. One reason for this is that machines tend to produce a constant sound when on. Additionally, one of the experimental constraints was that subjects kept their hand close to the machine at all times during operation. In reality, it might be expected that such strong performance will fall on relaxation of this constraint.
With the handheld tools, this constraint need not be enforced - it is inherent in the manner of use. It can be expected therefore that the performance reported here would be an accurate prediction of a real world application (as shown, to some extent, by a smaller standard deviation for handheld on the bottom right graph of Figure 1.)
In general however, the graphs show that depending on the application requirements - recall vs. fp tradeoff - a suitable IA threshold parameter might be chosen independent of the user.
4.
Summary
This paper presented an ROC evaluation of the two microphone Intensity Analysis algorithm. The following conclusions were made: this partitioning scheme is suitable for use in detection of hand-held tool activities (provided a sound is made during use); it is also suitable for detecting activities involving interaction with a (noisy) machine - provided that the user’s hand comes into contact with machine; finally, the algorithm parameters can be set independent of any user.
References
[1] Tom Fawcett. ROC Graphs: Notes and Practical Considerations for Researchers. Kluwer Aca-demic Publishers, 2004.
[2] Paul Lukowicz, Jamie A Ward, Holger Junker, Gerhard Tr/¿oster, Amin Atrash, and Thad Starner. Recognizing workshop activity using body worn microphones and accelerometers. In Pervasive
Computing, 2004.