A Benchmark to Select Classification Algorithms for
Decision Support Systems
Mahendra Tiwari
*, Randhir Singh
***
Research Scholar, UPRTOU, Allahabad **
Asstt. Professor, UIM,Allahabad
Abstract- Decision Support System is developing from its starting as a support tool and it is becoming the common resource in an organization. Decision Support System serve the management level of an organization for support to make decisions. Data Mining and DSS can lead to the improved performance and can enable to handle new types of problems. Classification is main task of Data Mining, various types of classification algorithms have been proposed and compared to determine the trends on data.
There has been no single algorithm are to be superior over all others for data sets. Robustness and scalability must be considered for judging the suitable algorithm for any data, In this paper two decision tree algorithm, one algorithm are tested and compared.
Index Terms- Classification,DSS,DM
I. INTRODUCTION
ecision Support System is a computer based support system for management decision makers who deal with unstructured or semi-structured problems. DSS becomes more essential in the area of large scale database design, we are rapidly and increasingly aware of the hidden treasure of new knowledge quietly residing in our data and face difficulties when attempting to get it. Data Mining is defined as the extraction of hidden knowledge, exceptional patterns and new findings from huge database. Integration of Data Mining and Decision Support System can enhance the performance of various applications which faces new types of problem.
II. CLASSIFICATION ALGORITHM
Decision Tree: Decision tree induction is the learning of decision trees from class-labeled training tuples. A decision tree is a flowchart-like tree structure, where each internal node (non leaf node) denotes a test on an attribute, each branch represents an outcome of the test, and each leaf node (or terminal node) holds a class label. The topmost node in a tree is the root node. Naïve Bayesian: Bayesian classifiers are statistical classifiers. They can predict class membership probabilities, such as the probability that a given tuple belongs to a particular class Bayesian classification is based on Bayes’ theorem. Naive Bayesian classifiers assume that the effect of an attribute value on a given class is independent of the values of the other attributes. This assumption is called class conditional independence. It is made to simplify the computations involved
and, in this sense, is considered “naive” Bayesian belief networks are graphical models
III. DETAILS OF DATA SET
I used 2 data set for evaluation with classifier on WEKA ,both of them from UCI Data repository that are labor data set and supermarket data set inbuilt in WEKA 3-6-6 and are in arff file format.
Table 1: Detail of data set
Data set
Type of file
No of attri-butes
No of insta-nces
Attribute charac -teristics
Dataset character istics
Miss -ing value
Labo r
ARF F
17 57 Categoric al
Multi- variate
No
Supe rmar ket
ARF F
217 4627 Categoric al
Multi- variate
No
3.1 Data set:- Labor data
Instances: 57 Attributes: 17
Duration,wage-increase-first-year, wage-increase-second-year, wage-increase-third-year,cost-of-living-adjustment, working-hoursPension, standby-pay,shift-differential, education-allowance,statutory-holidays,vacation, longterm-disability-assistancecontribution-to-dental-plan,bereavement-assistance, contribution-to-health-plan,class
3.2 Data set:- Supermarket data
Instances: 4627 Attributes: 217
Departments,Baby needs, Bread & cake, Baking needs, coupons,juice-sat-cord-ms,tea, biscuits, canned fish-meat,canned fruit, canned vagetables, breakfast food, cigs-tobacco,cigarette cartons, cleaners,coffee etc
IV. EVALUATION OF CLASSIFIERS ON DIFFERENT DATA SET we tried to evaluate the performance of various classifiers on two test mode 10 fold cross validation and percentage split with different data sets at WEKA 3-6-6,
Parameter for Comparison:
I. Test mode: It is defined as cross-validation test mode and percentage split test mode for evaluation.
II. Time to build model: It is a term that describes how much time taken to build classifier model
III. Correctly classified instances: It is defined as how many instances are correctly classified
IV. Incorrectly classified instances: It is defined as how many instances are not classified.
4.1 Test mode
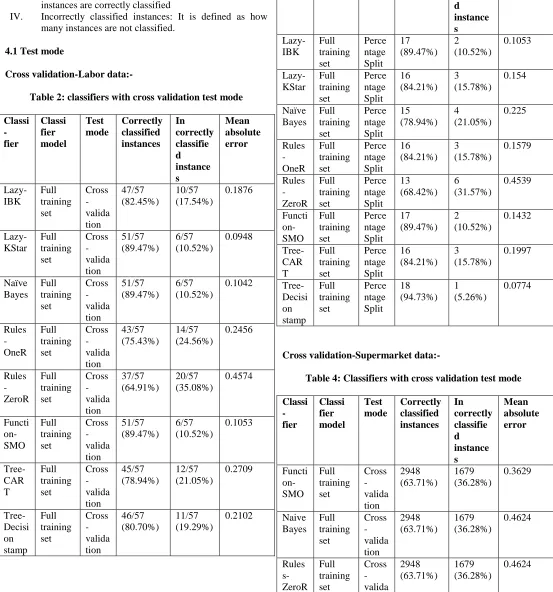
[image:2.612.31.584.139.731.2]Cross validation-Labor data:-
Table 2: classifiers with cross validation test mode
Classi - fier Classi fier model Test mode Correctly classified instances In correctly classifie d instance s Mean absolute error Lazy-IBK Full training set Cross -valida tion 47/57 (82.45%) 10/57 (17.54%) 0.1876 Lazy-KStar Full training set Cross -valida tion 51/57 (89.47%) 6/57 (10.52%) 0.0948 Naïve Bayes Full training set Cross -valida tion 51/57 (89.47%) 6/57 (10.52%) 0.1042 Rules -OneR Full training set Cross -valida tion 43/57 (75.43%) 14/57 (24.56%) 0.2456 Rules -ZeroR Full training set Cross -valida tion 37/57 (64.91%) 20/57 (35.08%) 0.4574 Functi on-SMO Full training set Cross -valida tion 51/57 (89.47%) 6/57 (10.52%) 0.1053 Tree-CAR T Full training set Cross -valida tion 45/57 (78.94%) 12/57 (21.05%) 0.2709 Tree-Decisi on stamp Full training set Cross -valida tion 46/57 (80.70%) 11/57 (19.29%) 0.2102
Percentage split-Labor data:-
Table 3:Classifiers with percentage split test mode
Classi - fier Classi fier model Test mode Correctly classified instances In correctly classifie d instance s Mean absolute error Lazy-IBK Full training set Perce ntage Split 17 (89.47%) 2 (10.52%) 0.1053 Lazy-KStar Full training set Perce ntage Split 16 (84.21%) 3 (15.78%) 0.154 Naïve Bayes Full training set Perce ntage Split 15 (78.94%) 4 (21.05%) 0.225 Rules -OneR Full training set Perce ntage Split 16 (84.21%) 3 (15.78%) 0.1579 Rules -ZeroR Full training set Perce ntage Split 13 (68.42%) 6 (31.57%) 0.4539 Functi on-SMO Full training set Perce ntage Split 17 (89.47%) 2 (10.52%) 0.1432 Tree-CAR T Full training set Perce ntage Split 16 (84.21%) 3 (15.78%) 0.1997 Tree-Decisi on stamp Full training set Perce ntage Split 18 (94.73%) 1 (5.26%) 0.0774
Cross validation-Supermarket data:-
Table 4: Classifiers with cross validation test mode
tion Rules -OneR Full training set Cross -valida tion 3110 (67.21%) 1517 (32.78%) 0.3279 Lazy-IBK Full training set Cross -valida tion 1718 (37.12%) 2909 (62.87%) 0.6218 Trees-CAR T Full training set Cross -valida tion 2948 (63.71%) 1679 (36.28%) 0.4624 Trees-Decisi onstu mp Full training set Cross -valida tion 2980 (64.40%) 1647 (35.59%) 0.4212 Functi on-SMO Full training set Cross -valida tion 2948 (63.71%) 1679 (36.28%) 0.3629
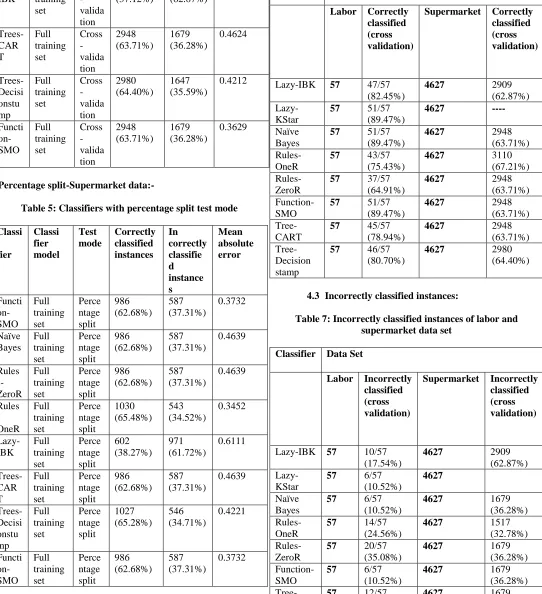
[image:3.612.38.580.135.729.2]Percentage split-Supermarket data:-
Table 5: Classifiers with percentage split test mode
Classi - fier Classi fier model Test mode Correctly classified instances In correctly classifie d instance s Mean absolute error Functi on-SMO Full training set Perce ntage split 986 (62.68%) 587 (37.31%) 0.3732 Naïve Bayes Full training set Perce ntage split 986 (62.68%) 587 (37.31%) 0.4639 Rules s-ZeroR Full training set Perce ntage split 986 (62.68%) 587 (37.31%) 0.4639 Rules -OneR Full training set Perce ntage split 1030 (65.48%) 543 (34.52%) 0.3452 Lazy-IBK Full training set Perce ntage split 602 (38.27%) 971 (61.72%) 0.6111 Trees-CAR T Full training set Perce ntage split 986 (62.68%) 587 (37.31%) 0.4639 Trees-Decisi onstu mp Full training set Perce ntage split 1027 (65.28%) 546 (34.71%) 0.4221 Functi on-SMO Full training set Perce ntage split 986 (62.68%) 587 (37.31%) 0.3732
4.2 Correctly Classified instances:
Table 6: correctly classified instances of labor and supermarket data set
Classifier Data Set
Labor Correctly classified (cross validation)
Supermarket Correctly classified (cross validation)
Lazy-IBK 57 47/57 (82.45%)
4627 2909
(62.87%)
Lazy-KStar
57 51/57 (89.47%)
4627 ----
Naïve Bayes
57 51/57 (89.47%)
4627 2948
(63.71%)
Rules-OneR
57 43/57 (75.43%)
4627 3110
(67.21%)
Rules-ZeroR
57 37/57 (64.91%)
4627 2948
(63.71%)
Function-SMO
57 51/57 (89.47%)
4627 2948
(63.71%)
Tree-CART
57 45/57 (78.94%) 4627 2948 (63.71%) Tree-Decision stamp
57 46/57 (80.70%)
4627 2980
(64.40%)
4.3 Incorrectly classified instances:
Table 7: Incorrectly classified instances of labor and supermarket data set
Classifier Data Set
Labor Incorrectly classified (cross validation)
Supermarket Incorrectly classified (cross validation)
Lazy-IBK 57 10/57 (17.54%)
4627 2909
(62.87%)
Lazy-KStar
57 6/57 (10.52%)
4627
Naïve Bayes
57 6/57 (10.52%)
4627 1679
(36.28%)
Rules-OneR
57 14/57 (24.56%)
4627 1517
(32.78%)
Rules-ZeroR
57 20/57 (35.08%)
4627 1679
(36.28%)
Function-SMO
57 6/57 (10.52%)
4627 1679
(36.28%)
CART (21.05%) (36.28%) Lazy-IBK 57 10/57
(17.54%)
4627 2909
(62.87%)
4.4 Time taken to build model:
Classifier:-OneR(Rules) Test mode:-cross validation
=== Classifier model (full training set) === wage-increase-first-year:
< 2.9 -> bad >= 2.9 -> good (48/57 instances correct)
Time taken to build model: 0 seconds === Stratified cross-validation ===
Correctly Classified Instances 43 75.4386 % Incorrectly Classified Instances 14 24.5614 % Kappa statistic 0.4209
Mean absolute error 0.2456 Root mean squared error 0.4956 Relative absolute error 53.6925 %
Root relative squared error 103.7961 % Total Number of Instances 57
[image:4.612.20.575.44.727.2]
Fig. 1 : One R classifier on Letter image data set with cross validation
Classifier:-Naïve Bayes Test mode:-percentage split Data set:- Labor data
Time taken to build model: 0 seconds === Evaluation on test split ===
Correctly Classified Instances 18 94.7368 % Incorrectly Classified Instances 1 5.2632 % Kappa statistic 0.8725
[image:4.612.318.568.57.195.2]Mean absolute error 0.0774 Root mean squared error 0.2486 Relative absolute error 17.0566 % Root relative squared error 53.0567 % Total Number of Instances 19
Fig. 2 : Naïve Bayes on Labor data set with percentage split
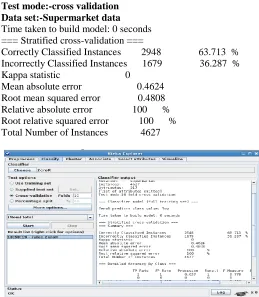
Classifier:-ZeroR(Rules) Test mode:-cross validation Data set:-Supermarket data
Time taken to build model: 0 seconds === Stratified cross-validation ===
Correctly Classified Instances 2948 63.713 % Incorrectly Classified Instances 1679 36.287 % Kappa statistic 0
Mean absolute error 0.4624 Root mean squared error 0.4808 Relative absolute error 100 % Root relative squared error 100 % Total Number of Instances 4627
Fig. 3 : Zero R on Supermarket data set with cross-validation
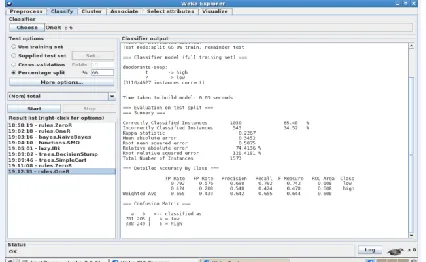
Classifier:-OneR(Rules) Test mode:-percentage split Data set:-Supermarket data
Time taken to build model: 0.03 seconds === Evaluation on test split ===
Correctly Classified Instances 1030 65.48 % Incorrectly Classified Instances 543 34.52 % Kappa statistic 0.2267
[image:4.612.312.571.232.529.2]Fig 4: One R on Supermarket data set with percentage split
V. CONCLUSION
Lazy-kstar algorithm most successfully classified instances of labor data set with cross validation test mode, while Naïve Bayes worked best with percentage split test mode on labor data. Rules OneR performed very well in both the test modes for supermarket data.
REFERENCES
[1] www.boirefillergroup.com/....KDD_CONFERENCE_PAPER_AUG2006.p df
[2] www.dcc.fc.up.pt/~ricroc/aulas/0708/atdmlp/material/paper_dmbiz06.pdf [3] www.ecmlpkdd2006.org/ws-pdmaec.pdf
[4] http://www.linkedin.com/in/federicocesconi [5] www.linkedin.com/in/federicocesconi
[6] www.footwearsinfolinethree.tripod.com/indian_retail_industry_its_growth_ [7] Open source Initiative: The open source definition(2007) www.
Opensource.org/docs/definition_plain.html
[8] Retail and Consumer Worlds, Pricewaterhousecoopers, January, 2009 [9] Bose B.S. (2003), “Handbook of Marketing Management”, Himalaya
Publish in house, New Delhi.
[10] Bishop. C.M. (1995) Neural Networks for pattern Recognition. New York: Oxford University Press
[11] Bigus, J.P. (1996) Data Mining with Neural Networks: Soling Business Problem- from Application Development to Decision Support. New York: McGraw-Hill.
[12] Jiawei han, Micheline Kamber, Data mining : concepts & Techniques (2nd edition).
[13] Decision Trees for Business Intelligence & Data Mining: using SAS Enterprise minor.
[14] DB2 Intelligent miner library(2002), Using the intelligent miner for data ,IBM, version 8 release 1.
[15] SAS Enterprise miner documentation, what’s new in SAS enterprise miner 5.1 SAS Institue Inc.
[16] SPSS Inc,(2005), maximize your returns with data mining and predictive analysis, Clementine.
[17] Peter M. chen and David A.(1993), storage performance-metrics and bench marks, Proceeding of the IEEE, 81:1-33
[18] M.Chen, J. Han, and P. Yu. (1996) Data Mining Techniques for marketing, Sales, and Customer Support. IEEE Transactions on Knowledge and Data Eng., 8(6)
[19] Agrawal R, Mehta M., Shafer J., Srikant R., Aming (1996) A the Quest on Knowledge discovery and Data Mining, pp. 244-249..
[20] Chaudhuri, S.Dayal, U. (1997) An Overview of Data Warehousing and OLAP Technology. SIGMOD Record 26(1) 65-74
[21] John F. Elder et all, (1998) A Comparison of Leading Data Mining Tools, Fourth International Conference on Knowledge Discovery & Data Mining [22] C. Ling and C. Li, (1998 ) “Data mining for direct marketing: Problem and
solutions,” in Proc, of the 4th international Conference on Knowledge Discovery & Data Mining, pp. 73-79
[23] John, F., Elder iv and Dean W.(1998) A comparison of leading data mining tools, fourth International conference on Knowledge discovery and data mining pp.1-31
AUTHORS
First Author – Mahendra Tiwari, Research Scholar,
UPRTOU,Allahabad
Second Author – Randhir Singh, Asstt. Professor,