www.ijsrp.org
Enhancement of the Distribution System by
Implementing LT- Less Distribution Technique
Surabhi Jain*, Ranjana Singh**
* Student, Department of Electrical Engineering, Jabalpur Engineering College, Jabalpur ** Associate Professor, Department of Electrical Engineering, Jabalpur Engineering College, Jabalpur
Abstract- This paper presents an efficient method for reducing losses in existing LT- distribution system.The study is based on a real distribution feeder in Madhya Pradesh (M.P.) state. In this study, main focus is given on the reduction of distribution losses by converting “LT distribution system” to “LT- Less distribution system”. Under this proposed LT- Less distribution system; power is distributed mainly through HT (11 KV) lines with small rating distribution transformers. This paper presents the comparison of existing LT- distribution system with proposed LT-Less distribution system in terms of losses.
In this paper, a program under Turbo C++ is designed to
calculate power losses (I2R loses) in the both existing LT-
distribution system and proposed LT- Less distribution system.Moreover,the calculation of reduction in losses, annual savings and payback period of the proposed method has been done by using programming in Turbo C++.
Index Terms- LT- Less Distribution System, Calculation of I2R Losses and Payback Period through Turbo C++ Programming.
I. INTRODUCTION
In agricultural area, India’s power sector is characterized by inadequate power supply and financial insolvency. The efficiency of the existing distribution is generally low and the system losses are untenably high specifically at the long low tension (LT) networks. The delivery of power from sources to the consumer points is always accompanied with power losses. Such non-negligible amount of losses has a direct impact on the overall efficiency and financial issues of the existing distribution system. Therefore, method for losses reduction is essential for achieving the financial goals of distribution companies.To make it easier to investigate losses in electrical distribution system, it is helpful to divide different types of losses into two categories as Technical losses and Non-Technical losses. Reduction of technical losses leads to a real gain in energy and reduced capital-intensive investments.On the other hand,the reduction of non-technical losses improves the financial balance of the
company concerned. Technical losses consist I2R losses which
occur especially in overhead distribution lines. The electrical
energy losses in distribution lines arewasted in the form of I2R
losses.These I2R losses are current depending losses and mainly
caused by the use of low voltage in distribution.As in the existing distribution system; the current is high due to low
voltage and thus occurs more I2R losses [1,2]. Technical losses
also include transformer losses.The transformer losses can be classified into two components, namely, no-load and load losses. No-load losses occur from the energy required to retain the
continuously varying magnetic flux in the core and its invariant with load on the transformer. Load losses are a function of the winding current. It mainly arise from resistance losses in the conducting material of the windings and it varies with load. The other category, the non-technical losses mainly include electricity theft in existing distribution system. Electricity theft is done by direct hooking of loads in LT lines.Non-technical losses are also known as “Commercial losses”. Mostly, non-technicallosses are associated with LT lines. In some regions, the electrical energy is illegally taking from the nearest LT line. Electricity theft by direct hooking and making unauthorized connections arethemost common and visible form of non-technical losses. Hence, these unauthorized load connections are the main sources of the
non-technical losses. In this paper, I2R losses and payback period is
determined by using programming in Turbo C++.Themain focus of this research paper is to reduce distribution losses and improves thequality of power supply in the existing distribution system [3,4].
II. EXISTING LT- DISTRIBUTION SYSTEM
The loads in agricultural areas are widely dispersed and low tension lines run for long distances to feed a small load. In the LT- distribution system, large capacity transformer is provided at one point and release supply to each load through long LT lines. In some agricultural areas, length of LT (low tension) lines are much larger even up to 20 kms. Theexisting LT- distribution system consists 3 phase DTR of 63KVA, 100KVA or somewhere 200KVA and on each DTR about 20 to 30 such pump sets (depending on DTR capacity) are connected. Hence, long LT lines and many number of load connections with high
capacitydistribution transformer resulting in the increase in I2R
losses, electricity theft losses, overloading and failure of distribution transformers etc. The existing LT- distribution system also affects voltage profile and performance of the distribution system. Such a system is not suitable for Indian conditions, especially in agricultural areas; as unsatisfactory voltage profile, higher losses and outages [5].
III. PROPOSED LT- LESS DISTRIBUTION SYSTEM
www.ijsrp.org supply to 4 or 5 consumers with unavoidable least (or almost nil)
LT lines, preferably with insulated overhead cables [6]. IV. BENEFITS OF PROPOSED LT- LESS
DISTRIBUTION SYSTEM
Electricitytheftby direct hooking of unauthorized load
connection is avoided.
I2R losses can be minimized to the lowest level.
High quality of power supply and excellent voltage profile
earns total consumer satisfaction.
Prevention of unauthorized loads and consequently no over
loading in transformer. Thus,negligible transformerfailures and minimal number of outages.
In the event of transformer failure orany fault, only
4 or 5consumers will be affected.
The authorized consumers assume ownership and take
responsibility of the distribution transformer; as only 4 or 5 pump sets are connected on each DTR in agricultural area.
No frequent fuse blow outs,less fluctuations and also less
burnouts of motors. [7,8]
V.MATHEMATICAL FORMULA FOR POWER LOSSES AND CURRENT
The power losses in a line is based on the measured current of the load and can be calculated as:
Power losses = I2×R×L
Where, I: Current in Amperes, R: Resistanceof conductor in Ohms/Km, L: Length of line in Kilometers.
For 3 phase,Power losses = 3(I2×R×L) …………. (1)
Here, current can be calculated by usingthe formula as given below:
Where, P: Capacity of load in distribution line, V: Voltage in distribution system, COS : Power Factor.
In this paper, the current is computed from the load and power loss for each consumer is evaluated by putting the value of corresponding current, line length and fixed value of resistance in
equation1: [3(I2×R×L)] for both existing LT- distribution system
and proposed LT- Less distribution system [9].
VI. CASE STUDY
This case study includes calculation of power losses (I2R losses)
by using TC- Programming for the both existing LT- distribution system and proposed LT- Less distribution system and also a program under Turbo C++ is designed to calculate reduction in losses, annual savings and pay back period in order to check the feasibility of the proposed LT- Less distribution system.A case study of real distribution feeder in Hinotiya village is presented in this paper. The data along with single line diagram has been taken from Madhya Pradesh Poorv Kshetra Vidyut Vitaran Company Limited (MPPKVVCL) [10,11].
VII. CALCULATION OF LOSSES IN EXISTING LT- DISTRIBUTION SYSTEM
[image:2.612.315.568.127.269.2]The single line diagram of existing LT- distribution system of the Hinotiya Village is shown in figure 1. This figure shows a200 KVA distribution transformer is feeding the consumer’s pump sets in the part of agricultural area of Hinotiya Village, (Madhya Pradesh).
Figure 1:Existing LT- distribution system
A. Power Losses (I2R Losses) in LT distribution System
To determine power losses (I2R losses) in the existing LT line,
the value of resistance of the conductor is required.Here,Weasel conductor of 30 sq. mm is used and the resistance for this particular conductor is 0.928 Ohm/Km. The power factor is assumed to be 0.8 andvoltage of the existing LT- distribution system is 433 volts. In figure 1, one main long distribution trunk
line is taken for calculation of I2R losses in the both LT branch-1
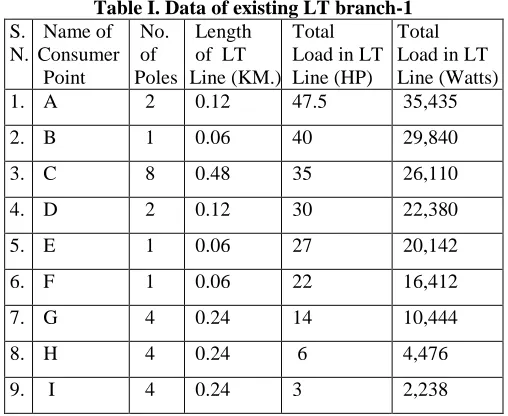
[image:2.612.318.572.464.672.2]& LT branch-2 of the existing LT- distribution system. The length between one pole to another pole is 0.06 km. (say). Details of the consumers, loads, LT poles and length of the LT linefor the both existing LT branch-1 and LT branch-2are given in Table I and Table II respectively.
Table I. Data of existing LT branch-1 S.
N.
Name of Consumer
Point
No. of Poles
Length of LT Line (KM.)
Total Load in LT Line (HP)
Total Load in LT Line (Watts)
1. A 2 0.12 47.5 35,435
2. B 1 0.06 40 29,840
3. C 8 0.48 35 26,110
4. D 2 0.12 30 22,380
5. E 1 0.06 27 20,142
6. F 1 0.06 22 16,412
7. G 4 0.24 14 10,444
8. H 4 0.24 6 4,476
9. I 4 0.24 3 2,238
www.ijsrp.org NO
YES
NO
[image:3.612.318.574.60.223.2]YES
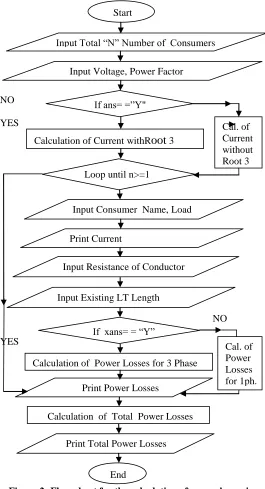
Figure 2: Flow chart for the calculation of power losses in existing LT- distribution system.
The output results of the current and power losses for data of Table I are shown below:
Screenshot 1: Total number of consumers in existing
LT branch-1.
Screenshot 2: Current and power losses for the first consumerpoint “A” in existing LT branch-1.
Similarly, This process continues for all the remaining consumers of the existing LT branch-1. The screenshot of the last consumer point “I” and total power losses in existing LT branch- 1 of the existing LT- distribution system is shown below:
Screenshot 3: Current and power losses for thelast consumerpoint “I” and total power losses in existing LT
branch-1.
[image:3.612.36.301.67.556.2] [image:3.612.318.571.318.468.2] [image:3.612.314.576.564.738.2]Hence, total power lossesin the existing LT branch-1 is 5136.537461 Watts.Similarly, This programming method is also applied in the existing LT branch- 2. Hence, current and power losses for the existing LT branch-2 are shown in Table II.
Table II. Data and power losses of existing LT branch-2 S.
N. Name
of Con- sumer Point
No. of Poles
Length of LT Line (KM.)
Total Load in LT Line (HP)
Total Load
in LT Line (Watts)
Current
(Amp.)
Power Losses (Watts)
1. A 7 0.42 66 49,236 82.064814 7874.672579
2. B 1 0.06 25 18,650 31.085157 161.408578
3. C 2 0.12 22 16,412 27.354938 249.989606
4. D 3 0.18 17 12,682 21.137907 223.905979
5. E 5 0.30 10 7,460 12.434063 129.126862
6. F 1 0.06 8 5,968 9.94725 16.528238
7. G 3 0.18 4 2,984 4.973625 12.396179
Start
Input Total “N” Number of Consumers
Input Voltage, Power Factor
Calculation of Current withRoot 3 If ans= =”Y"
Cal. of Current without Root 3
Input Consumer Name, Load
Print Current
Input Existing LT Length
If xans= = “Y”
Calculation of Power Losses for 3 Phase
Print Power Losses
Calculation of Total Power Losses
Print Total Power Losses
Cal. of Power Losses for 1ph. Loop until n>=1
Input Resistance of Conductor
[image:3.612.39.292.610.719.2]www.ijsrp.org Total-
8668.028022
TotalLT- power lossesare evaluated by summing up the individual power loss of each load at the consumer point in LT branch-1 and LT branch-2 of the existing LT- distribution system. (refer- figure 1).
From Table I and Table II,
Total power lossesof the existing LT- distribution system = [sum of power lossesin existing LTbranch-1
+ sum of power lossesinexisting LT branch-2]
= [5136.537461 Watts+8668.028022]= 13,804.56548 Watts
B. Transformer Losses in LT System
The transformer losses include no-load losses and full-load losses.In figure 1, a high capacity distribution transformer of 200 KVA is used to supply the power to the consumer’s pump sets. For distribution transformer of 200 KVA, the fixed value of no-load losses and full-no-load losses are 550 Watts and 2800 Watts respectively.
Total Transformer Losses = (550 + 2800) = 3350 Watts.
C. Power Theft Losses in LT System
Power theft losses contribute to the 12% of total load. Hence, the sum of the all loads in existing LT branch-1 and LT branch-2 are 35,435 Watts and 49,236 Watts respectively.
Total Load (Watts) = (35,435 + 49,236) = 84,671 Watts Thus, Total Power Theft Losses = 12% of Total Load (Watts) = 12 % of 84,671 Watts = 10,160.52 Watts
VIII. CALCULATION OF LOSSES IN PROPOSED LT-LESS DISTRIBUTION SYSTEM
[image:4.612.36.299.56.83.2]The single line diagram of proposed LT- Less distribution system with small rating distribution transformers is shown in figure 3. In this diagram, LT- Less distribution has done only in the part of agricultural area of Hinotiya Village in which proposed HT lines are extended nearer to the consumer’s pump sets as possible and power is distributed mainly through proposed HT (11 KV) lines.
Figure 3: Proposed LT-Less distribution system
A. Power losses in proposed LT-Less distribution System
In the proposed LT- Less distribution system, voltage is 11000 Volts, as LT line is converted into 11 KV - HT line. The conductor of existing LT- distribution system is not replaced and the same existing conductor (i.e. weasel conductor) is used in
proposed LT- Less distribution system. The resistance of the weasel conductor is 0.928 Ohm/Km.and power factor is assumed to be 0.8. In figure 3, one main long distribution trunk line is
taken for calculation of I2R losses in both HT branch-1 and HT
branch-2 of the proposed LT- Less distribution system. Here, length between one pole to another pole is 0.06 km (say). Details of the consumers, loads,poles and length of proposed HT linefor the both proposed HT branch-1 and HT branch-2are given in Table III and Table IV respectively.The calculations of current and power losses in the both proposed HT branch-1 and HT branch-2 are done by using programming in Turbo C++. Hence, The following flow chart represents the programming to calculate current and power losses in the proposed LT- Less distribution system.
No
YES
No
YES
Start
Input Total “N” Number of DTR’s Transformer
Input Voltage, Power Factor
Calculation of Current withRoot 3 If ans= =”Y"
Cal. of Current without Root 3
Input DTR Name, Load
Print Current
Input Proposed HT Length
If xans= = “Y”
Calculation of Power Losses for 3 Phase
Print Power Losses
Calculation of Total Power Losses
Print Total Power Losses
Cal. of Power Losses for 1ph. Loop until n>=1
Input Resistance of Conductor
[image:4.612.315.580.225.744.2] [image:4.612.39.294.551.668.2]www.ijsrp.org Figure 4: Flow chart for the calculation of power losses in
[image:5.612.321.573.125.280.2]proposed LT- Less distribution system. Table III.Data of proposed HT branch-1 in LT- Less
distribution system S.
N.
Name of Distribution Transformer (DTR)
No.of Consumers Availing Load
No. of Poles
Length of HT Line(K M.)
Total Load in HT Line (KVA)
1. T-1 3 13 0.78 66
2. T-2 2 2 0.12 41
3. T-3 4 5 0.30 25
From the data of Table- III, the current and power losses arecalculated by using Turbo C++programming in the proposed HT branch-1. Hence, the output results of the current and power losses for thedata of Table- III are shown below:
Screenshot 1: Total number of distribution transformers (DTR’s) in proposed HT branch-1.
Screenshot 2: Current and power losses for the first distributiontransformer (DTR) “T-1” in proposed
HTbranch-1.
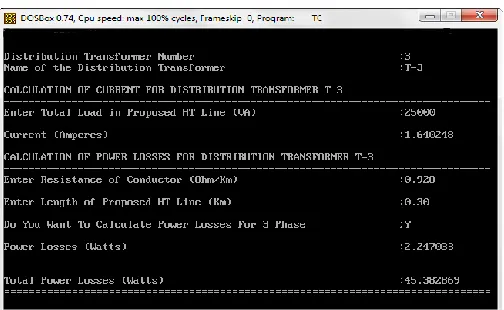
Similarly, This process continues for all the remaining distribution transformers (DTR’s) of the proposed HT branch-1. The screenshot of the last distribution transformer (DTR) T-3and total power losses in proposed HT branch- 1 of the proposed LT-Less distribution system is shown below:
Screenshot 3: Current and power losses for the last distributiontransformer (DTR) “T-3” and total power
lossesin proposed HT branch-1.
[image:5.612.42.298.283.459.2]Here, total power losses in the proposedHT branch-1 is 45.382869 Watts. Similarly, This programming method is also applied in the proposed HT branch- 2. Hence, current and power losses for the proposedHT branch-2 are shown in Table IV.
Table IV. Data and power losses of proposed HT branch-2 in LT- Less distribution system
S. N.
Name of DTR
No. of Consu-
mers Availing
Load No. of Poles
Length of HT Line (KM.)
Total Load inHT Line (KVA)
Current
(Amp.)
Power losses (Watts)
1 T-1 4 6 0.36 100 6.560991 43.143027
2 T-2 5 1 0.06 75 4.920743 4.044659
3 T-3 4 3 0.18 50 3.280495 5.392878
4 T-4 5 9 0.54 25 1.640248 4.044659
Total- 56.625223
Total HT- power lossesare evaluated by summing up the individual power loss of each load in the both HT branch-1 and HT branch-2 of the proposed LT- Less distribution system. (refer- figure 3)
From Table III and Table IV,
Total power lossesof the proposed LT- Less distribution system = [sum of power losses in proposed HT branch-1
+ sum of power losses in proposed HT branch-2] = [45.382869 Watts+ 56.625223]= 102.008092 Watts
www.ijsrp.org For 16 KVA DTR,The fixed value of no-load and full-load
transformer losses are 60 Watts and 275 Watts respectively.
For 25 KVA DTR, The fixed value of no-load and full-load transformer losses are 110 Watts and 720 Watts respectively.
Total no-load losses for the proposed LT- Less
distributionsystem= (Number ofDTR’s) × (No-load losses)
Total full-load losses for the proposed LT- Less
distributionsystem= (Number of DTR’s) × (Full-load losses)
[image:6.612.320.568.57.104.2]For the proposed LT- Less distributionsystem, number of various small rating DTR’s (distribution transformers) aregiven in Table V. Hence, the value of no-load losses and full-load losses forthe proposed LT- Less distribution system is taken from Table V.
Table V. Transformer Losses in Proposed LT- Less DistributionSystem
S. N.
Capacity of Required Small Rating Distribution Transformers
No. of DTR’s
TotalNo-Load Losses in Proposed LT- Less DistributionSyst em (Watts)
TotalFull- Load Losses in Proposed LT- Less Distribution
System (Watts)
1. 16 1 60 275
2. 25 6 660 4320
Total- 720 Watts
Total- 4,595Watts
From Table V,
Total Transformer losses inthe proposed LT- Less distribution system = [sum of total no-load losses
+ sum of totalfull-load losses]
= [720 Watts + 4595 Watts] = 5315 Watts
IX. CAPITAL OUTLAY
It is estimated that total cost of the all required materials for the proposed LT- Less distribution system is Rs. 6, 80, 073.7603.
X. RESULTS
The results are obtained including comparison of existing LT -distribution system and proposed LT- Less -distribution system, reduction in losses, annual savings and payback period.
A. Comparison of existing LT- distribution system and proposed LT- Less distribution system
[image:6.612.34.299.233.369.2]The comparison of existing LT- distribution system and proposed LT- Less distribution system is given in Table VI.
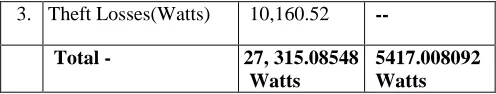
Table VI. S. N.
Parameters Existing LT-
Distribution System
Proposed LT- Less Distribution System
1. Power Losses (Watts) 13,804.56548 102.008092
2. Transformer Losses (Watts)
3350 5,315
3. Theft Losses(Watts) 10,160.52 --
Total - 27, 315.08548
Watts
5417.008092 Watts Since, Total time period of the power supply in agricultural area is 8 hours of 24 hours in 250 days per annum.
Therefore,
Losses in terms of units in existing LT- distribution system = (27,315.08548×8×250) ÷ 1000
= 54,630.17096Units
Losses in terms of units in proposed LT- Less distribution system = (5417.008092×8×250) ÷ 1000
= 10,834.01618 Units
B. Reduction in losses, Annual Savings and Payback Period
The reduction in losses, annual savings and payback period are calculated by programming in Turbo C++. Hence, thefollowing flow chart represents the programming method.
Input Total Losses of Proposed LT- Less Distribution System
Calculation of Reduction in Losses
Input Price of a Unit
End Start
Calculation of Annual Savings Print Reduction in Losses
Print Annual Savings
Calculation of Payback Period Input Capital Outlay
Print Payback Period
Input Total Losses of Existing
www.ijsrp.org Figure 5: Flow chart for the calculation of reduction in
losses, annual savings and payback period.
Here, the reduction in losses, annual savings and payback period are determined by the following formulas:
Reduction in losses (Watts)
= [Total losses of existing LT- distribution system - Total losses of proposed LT-Less distribution system]
Annual Savings = Price of a unit × Reduction in losses per annum in terms of units
Payback Period = (Total Capital Outlay / Annual Savings)
Hence, the output result of the reduction in losses, annual savings and payback period is shown below:
Screenshot of Reduction in losses, annual savings and payback period.
XI. CONCLUSION
Effective implementation of LT-Less distribution technique has reduced the distribution losses ,failure of transformers, burning of agricultural pump sets etc. It is concluded from the study that the use of a small rating distribution transformer for 4 or 5
consumers has reduced the I2R losses, electricity theft losses and
outages. As in the proposed LT- Less distribution system, the registered consumers will feel ownership and take responsibility and not allow others to meddle with the LT lines, hence prevents the unauthorized load connections.Adoption of this innovative LT-Less distribution technique reduces both the technical as well as non-technical losses and improves the commercial and technical performance of the distribution system.It also provides better reliability and results in the increase in annual energy saving. However, initial cost is more because of use of more
number of transformer, but it has been proved that the investment on conversion of existing LT- distribution system to proposed LT- Less distribution system can be easily recovered by the way
of losses reduction and annual savings.In this paper, I2R losses
and payback period are calculated by using programming in Turbo C++in which it is found that losses are reduced by 80.168% and the payback period of the proposed LT- Less distribution system is 3.105 years.
REFERENCES
[1] C. M. P. dos Sanyos, “Determination of Electrical Power Losses in
Distribution System,” IEEE/PESTransmission and Distribution Conference and Exposition Latin America, 15-18 Aug. 2006, pp. 1-5.
[2] A. Gupta, S. Grover and S. Miglani “Loss Reduction Planning Using High Voltage Distribution System”,VSRD, International Journal of Electrical, Electronics & Communication Engineering, Vol. 2 No. 11 November 2012, pp. 865-870.
[3] Sameer S. Mustafa., Mohammed H. Yasen, Hussein H. Abdullah and Hadi K. Hazaa, “Evaluation of Electric Energy Losses in Kirkuk Distribution
Electric System Area”, Iraq J. Electrical and Electronic Engineering,(2011) Vol.7 No.2, 144-150.
[4] Y. Al-Mahroqi, I.A. Metwally, A. Al-Hinai, and A. Al-Badi , “Reduction of Power Losses in Distribution Systems”, World Academy of Science, Engineering and Technology, (2012).
[5] I. Bansal, H.S. Gill, and A. Gupta, “Minimisation of losses by implementing High Voltage Distribution System in Agricultural sector”, IOSR Journal of Electrical andElectronics Engineering, (2012), vol.1, No. 5,pp. 39-45. [6] Yang Lin and Guo Zhizhong, “Reconfiguration of Electric Distribution
Networks for Energy Losses Reduction”,3rd International conference on Electric Utility Deregulation and Restructuring and Power Technologies(DRPT), Nanjing, China, 2008, 662-667.
[7] Sampath Kumar, S.A., Vasudaven, V., Antony, J., Raju, Madhu Sudhana and Ramesh, L. (2011), “Minimization ofpower losses in distribution
system through HVDS concepts”, International Conference on Sustainable Energy and Intelligent Systems, Chennai, India, pp.86-90.
[8] Anoop Singh, “A policy for improving efficiency of agriculture pump sets in India”, (IIT Kanpur, Climate strategies, (2009).
[9] B.R.Gupta, “Power System Analysis and Design”,(New Delhi: S. Chand & Company Limited).
[10] “Madhya Pradesh Poorv Kshetra Vidyut Vitaran Company Limited
”
(MPPKVVCL).[11] Ramesh, L., Ravindiran,S., Chowdhury, P.S., Chowdhury,S., Song,H.Y. and Goswami,K.P. (2007), “Distribution SystemLoss Minimization and Planning using Cymdist”, 42nd International Universities Power EngineeringConference (UPEC), University of Brighten, Brighten, UK, pp. 316-321.
AUTHORS
First Author – Surabhi Jain, Student, Department of Electrical Engineering, Jabalpur Engineering College, Jabalpur, India. Email: [email protected]