Journal of Chemical and Pharmaceutical Research, 2014, 6(6):865-872
Research Article
CODEN(USA) : JCPRC5
ISSN : 0975-7384
Research on the evaluation of collaborative logistics performance
oriented manufacturing industry based on AHP-BP model
Chen Chouyong and Chen Liujun*
School of Management, Hangzhou Dianzi University, Zhejiang, China
_____________________________________________________________________________________________
ABSTRACT
Building an indicator system of collaborative logistics performance oriented manufacturing industry using the Balanced Scorecard, this paper puts forward20 evaluation indicators from five aspects, the level of information, business process, finance, customer service ability, learning and development which builds the model of collaborative logistics performance oriented manufacturing industry based on AHP and BP neural network. The model makes analysis with AHP on collaborative logistics performance indicators for Wen ling automobile and motorcycle manufacturing industry and treats the AHP evaluation results as the training and testing data which will be input into network model to train and simulate test. The results show that the evaluation method of collaborative logistics performance oriented manufacturing industry based on AHP and BP neural network is reasonable and feasible. It is worthy of spreading in the related field of the performance evaluation.
Keywords: Collaborative logistics; Performance; AHP; BP neural network
_____________________________________________________________________________________________
INTRODUCTION
Collaborative logistics, throughout the entire production process, pursuesinternal logistics, external logistics and shipping logistics and so on to meet the needs of customers andprovide professional, timely, efficient logistics services. We wish to achieve the logistics optimization goal of reducing logistics cost and improving the customer satisfaction. In oriented manufacturing management environment,logistics performance is an important part of manufacturing overall performances and should try to integrate and optimize the logistics resources so that to promote the overall logistics performance and also enhance the market competitive capability of manufacturing and competitive advantage.
2.Build the model of collaborative logistics performance oriented manufacturing industry based on AHP-BP
The performance indicator of collaborative logistics performance oriented manufacturing industry, has the characteristics ofthe complexity, uncertainty anda large number of quantity.And at the same time, ithas the features of nonlinear correlation between each other. Based on this, this paper integrates the analytic hierarchy process (AHP) combined with BP neural network for comprehensive evaluation. The analytic hierarchy process supported by expert system, can deal with the combination of qualitative and quantitative problem and also can makes the subjective judgment and policy experience from decision makers into the model which realize quantitative processing. BP neural network has the ability of associative inference, high-speed parallel processing, adaptive identification and simulating human thinking which can be able to find the nonlinear mapping relationship between input-output after scientific training and study. BP neural network has the great advantages to intelligentlyinfer and predict and the disadvantage of that the network training process inevitably exists nonlinear programming as result to fall into local minimum point. So this paper combining the subjective evaluation and objective evaluation, uses analytic hierarchy process (AHP) to give the weight of the indicator system so as to makes up the defect in any assignment of weights of neural network and to reduce the probability of its computation trapped in local minima[5].
This model firstly determines the indicator weightusing AHP method in the performance indicator system and treatsthe results as the inputs of BP neural network. Afterwards,we can get the output results and then build the model BP neural network.
The model of BP neural network uses the sample data for training and when the accuracy requirements are finally met the accuracy requirements, the paper makes simulation of the corresponding data by fitting a good network to get the collaborative logistics performance evaluation results to be evaluated for manufacturing industry.
2.1 Build the hierarchical model of collaborative logistics performance oriented manufacturing industry
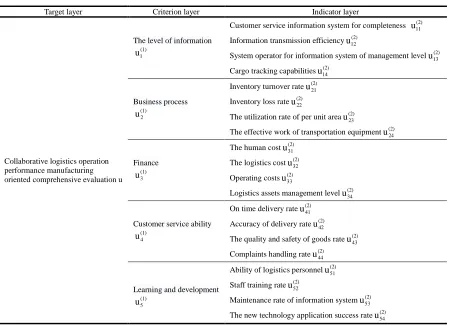
[image:2.595.83.533.416.742.2]The hierarchical structure model generally is divided into three layers, namely the target layer, criterion layer andindicator layer. Establishment of logistics performance evaluation indicator system is based on Balanced Scorecard. After the discussion from the expert group, we build evaluation indicator system from five aspects. See table 1.
Table 1An indicator system of collaborative logistics performance oriented manufacturing industry
Target layer Criterion layer Indicator layer
Collaborative logistics operation performance manufacturing oriented comprehensive evaluation u
The level of information
(1) 1
u
Customer service information system for completeness u11(2)
Information transmission efficiencyu(2)12
System operator for information system of management levelu13(2)
Cargo tracking capabilitiesu14(2)
Business process
(1) 2
u
Inventory turnover rateu(2)21
Inventory loss rateu(2)22
The utilization rate of per unit areau(2)23
The effective work of transportation equipmentu(2)24
Finance
(1) 3
u
The human costu(2)31
The logistics costu(2)32
Operating costsu(2)33
Logistics assets management levelu(2)34
Customer service ability
(1) 4
u
On time delivery rateu(2)41
Accuracy of delivery rateu(2)42
The quality and safety of goods rateu(2)43
Complaints handling rateu(2)44
Learning and development
(1) 5
u
Ability of logistics personnelu(2)51
Staff training rateu(2)52
Maintenance rate of information systemu(2)53
The new technology application success rateu(2)54
2.2 Build the model of BP neural network
_____________________________________________________________________________
for Boolean vector approximation [6]. In this paper, the BP network is a kind of multilayer feedforward neural network and its neurons in the conversion function is nonlinear sigmoid function, f(x)=1/(1+e-x).
(1)Determine the level of the BP network. Theoretically it is approximately arbitrary precision of a mapping from input to output. So a three-layer BP neural network can complete any N to M dimensional mapping and we usually choose BP network with a single hidden layer network[7].
(2)Determine the node number of the input and output layer of the BP network. The external description problemdetermines number of nodes in the network's input and output neurons.The number of input layer nodes and the indicator number of collaborative logistics performance evaluation should be the same. Using 20 indicators of collaborative logistics operation performance manufacturing orientedto simulated evaluation, so the network input layer node number is 20. The collaborative logistics performance evaluation value orientedmanufacturing is the network output, namely, so the output node number is 1.
(3)Determine the number of nodes in the hidden layer. The primary node number can be calculated according to the formula nH=(nI+nO)1/2+L or h=log2N to determine the scope of the general(nHrepresents the hidden layer node number,
norepresents input layer node number, nHrepresents the output layer node number,L is an integer between 1 to 10). This
network hidden layer 8 is finally determined.
EXPERIMENTAL SECTION
3 Application example analysis of AHP-BP in collaborative logistics performance evaluationoriented manufacturing
3.1 Calculation weight of AHP hierarchical structure and each indicator
(1) Build judgment matrix.
As for the collaborative logistics performance evaluation indicator system oriented manufacturing,iinviteexperts and professors in the related fieldsto score the evaluation indicator system of evaluation. These experts and professors include the three logistics association expert in Tai Zhou, two experts of logistics and purchasing association in Zhejiang province, two senior leaderswho have a leading in collaborative oflogistics enterprises and manufacturing enterprises in Wen Ling city and a senior leader who studies on logistics enterprises and manufacturing enterprises. The totally 10 questionnaires are sent out and 10 are taken back. The recovery rate is 100%. At last, we make data collection and sort to calculate all levels of judgment matrix as followed.
1 1 3 1 4 1 3 2 3 1 1 2 3 4 u= 4 2 1 2 4 3 1 3 1 2 1 2 1 2 1 4 1 4 1 2 1
) 1 (1
1 1 3 1 2 1 4 3 1 2 2 =
2 1 2 1 1 2 4 1 2
u 2 1 ) 2 (1
1 1 2 3 1 2 2 1 3 3 =
1 3 1 3 1 1 2 2 1 3 u 2 1 ) 3 (1
1 1 4 1 2 2 4 1 4 3 =
2 1 4 1 3 1 2 1 3 1 u 3 1 ) 4 (1
1 1 2 1 3 2 2 1 1 2 3 =
3 2 1 4 1 2 1 3 1 u 4 1 ) 5 (1
1 3 2 3
1 3 1 1 3 2 =
1 2 3 1 4
1 3 1 2 1 u 4 1
(2) All levels of indicator weight and consistency test 1) Determinate the weight of criterion layer
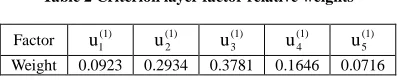
[image:3.595.207.406.612.652.2]According to the above formula, we can get criterion layer factor relative weight as shown in table 2.
Table 2 Criterion layer factor relative weights
Factor u1(1) (1) 2
u u(1)3 (1) 4
u u(1)5
Weight 0.0923 0.2934 0.3781 0.1646 0.0716
At the same time, we can get λMAX=5.2118, CI=0.0529, CR=0.0473<0.1. As a result, this judgment matrix is completely consistent and the weights are in the acceptable range.
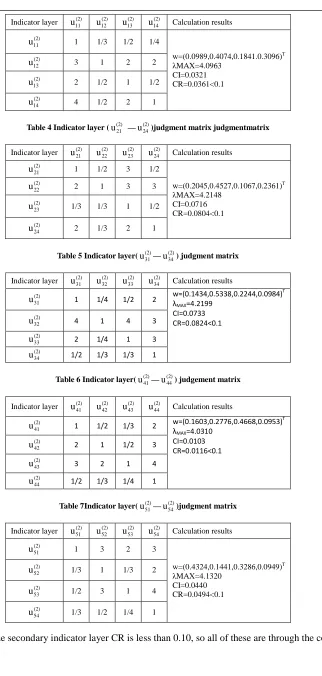
2) Determinate the weight of indicator layer. With the same method, we can calculate judgment matrix, characteristic value vector, thebiggest characteristic root and consistency test as showed in table3-7.
Indicator layer u(2)11 (2) 12
u u13(2) (2) 14
u Calculation results
(2) 11
u 1 1/3 1/2 1/4
w=(0.0989,0.4074,0.1841.0.3096)T λMAX=4.0963 CI=0.0321 CR=0.0361<0.1 (2) 12
u 3 1 2 2
(2) 13
u 2 1/2 1 1/2
(2) 14
[image:4.595.158.480.58.734.2]u 4 1/2 2 1
Table 4 Indicator layer (u(2)21 —u(2)24)judgment matrix judgmentmatrix
Indicator layer u(2)21 (2) 22
u (2) 23
u (2) 24
u Calculation results
(2) 21
u 1 1/2 3 1/2
w=(0.2045,0.4527,0.1067,0.2361)T λMAX=4.2148 CI=0.0716 CR=0.0804<0.1 (2) 22
u 2 1 3 3
(2) 23
u 1/3 1/3 1 1/2
(2) 24
u 2 1/3 2 1
Table 5 Indicator layer(u(2)31—u(2)34) judgment matrix
Indicator layer u(2)31 (2) 32
u u(2)33 (2) 34
u Calculation results
(2) 31
u 1 1/4 1/2 2 w=(0.1434,0.5338,0.2244,0.0984)
T
λMAX=4.2199
CI=0.0733 CR=0.0824<0.1 (2)
32
u 4 1 4 3 (2)
33
u 2 1/4 1 3 (2)
34
[image:4.595.165.473.70.172.2]u 1/2 1/3 1/3 1
Table 6 Indicator layer(u(2)41—u(2)44) judgement matrix
Indicator layer u(2)41 (2) 42
u (2) 43
u (2) 44
u Calculation results
(2) 41
u 1 1/2 1/3 2 w=(0.1603,0.2776,0.4668,0.0953)
T
λMAX=4.0310
CI=0.0103 CR=0.0116<0.1 (2)
42
u 2 1 1/2 3 (2)
43
u 3 2 1 4 (2)
44
[image:4.595.167.449.577.680.2]u 1/2 1/3 1/4 1
Table 7Indicator layer(u(2)51— (2) 54
u )judgment matrix
Indicator layer u(2)51 (2) 52
u (2) 53
u (2) 54
u Calculation results
(2) 51
u 1 3 2 3
w=(0.4324,0.1441,0.3286,0.0949)T λMAX=4.1320 CI=0.0440 CR=0.0494<0.1 (2) 52
u 1/3 1 1/3 2
(2) 53
u 1/2 3 1 4
(2) 54
u 1/3 1/2 1/4 1
From the table 3-7, the secondary indicator layer CR is less than 0.10, so all of these are through the consistency test.
_____________________________________________________________________________
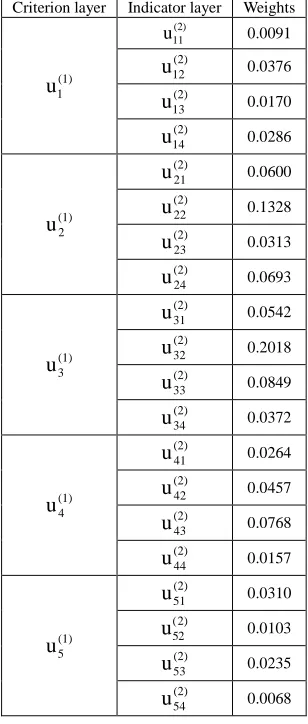
Table 8Collaborative logistics performance evaluation indicator system of weights oriented manufacturing
Criterion layer Indicator layer Weights
(1) 1
u
(2) 11
u 0.0091
(2) 12
u 0.0376
(2) 13
u 0.0170
(2) 14
u 0.0286
(1) 2
u
(2) 21
u 0.0600
(2) 22
u 0.1328
(2) 23
u 0.0313
(2) 24
u 0.0693
(1) 3
u
(2) 31
u 0.0542
(2) 32
u 0.2018
(2) 33
u 0.0849
(2) 34
u 0.0372
(1) 4
u
(2) 41
u 0.0264
(2) 42
u 0.0457
(2) 43
u 0.0768
(2) 44
u 0.0157
(1) 5
u
(2) 51
u 0.0310
(2) 52
u 0.0103
(2) 53
u 0.0235
(2) 54
u 0.0068
3.2 The training and simulation example of the BP neural network model
(1) Sample data
The sample data is through research from oriented manufacturing automobile collaborative logistics industryperformance evaluation ofWen Ling city.
Panel of judges through the interview and the questionnaire survey on staff who are responsible for the logistics industry, makes performance score which has five grades, weaker, weak, normal, strong and very strong and the corresponding values are 1, 3, 5, 7, 9. We can get the performance ratings in table9.
(2)Thenetwork trainingand data simulation
In the actual calculation, firstly, the indicator value should be standardized treatment and make all the data in table 9 divided by 10, with unified to [0, 1].The first 16 sets of data used in the model of BP neural network learning and training, the rest of the other two groups to validate the precision of the model.
Table9The performance evaluation indicators score (specific value in the table)
Sample The serial number
Evaluation indicators
value (2)
11
u u12(2) (2) 13
u u14(2) (2) 21
u u(2)22 (2) 23
u u(2)24 (2) 31
u u32(2) (2) 33
u u(2)34 (2) 41
u u(2)42 (2) 43
u u(2)44 (2) 51
u u(2)52 (2) 53
u u54(2)
Train sample
1 9 9 7 9 9 9 9 7 9 7 9 9 9 9 5 7 3 3 5 5 7.7
2 7 7 5 9 3 3 7 7 7 9 7 7 7 7 7 5 5 5 7 9 6.5
3 7 5 3 5 5 5 5 7 5 5 5 7 3 5 5 7 9 5 7 5 5.3
4 9 5 5 5 7 9 9 5 9 7 3 9 5 7 5 5 7 5 7 5 6.6
5 5 5 9 5 5 5 5 5 5 3 5 7 5 5 7 7 7 9 5 3 5.0
6 5 3 7 5 7 5 7 9 5 5 7 5 5 5 5 7 5 5 5 5 5.6
7 3 7 3 7 5 5 5 5 5 5 3 7 3 5 5 3 7 7 5 5 5.0
8 5 9 5 5 5 5 9 7 9 7 7 7 7 9 7 5 7 9 5 9 6.8
9 5 7 5 5 5 3 7 5 5 5 5 3 5 5 5 7 5 3 5 7 4.8
10 5 3 5 5 9 7 5 7 7 5 5 5 5 5 5 5 5 5 5 7 5.7
11 9 5 9 5 7 7 5 9 7 7 3 9 7 5 7 5 7 7 7 7 6.6
12 7 7 3 3 5 5 5 7 5 3 5 7 7 3 9 7 9 7 7 7 5.3
13 7 9 9 9 3 3 9 7 9 9 9 9 9 9 5 5 5 3 7 3 7.0
14 5 9 5 9 7 9 5 5 5 5 7 7 5 5 7 9 7 7 7 7 6.5
15 5 5 9 7 9 9 5 5 7 5 3 7 5 5 5 5 5 5 3 5 5.9
16 5 9 5 9 3 3 9 3 7 7 9 7 7 5 7 7 5 5 5 5 6.0
Inspect sample 17 9 3 3 5 3 5 5 5 7 5 3 3 5 5 9 7 7 3 9 7 5.1
_____________________________________________________________________________
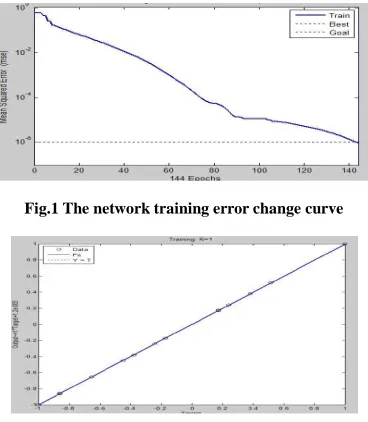
Fig.1 The network training error change curve
Fig.2Actual output of training sample and ideal output of linear regression analysis
RESULTS AND DISCUSSION
From the error analysis of the learning outcomes of the table 10, the training results of BP neural network arealmost consistent with the results of expert evaluation and error is within an acceptable range. So given the training sample learning has met the requirements.
Table 10 Study result error analysis
Serial number 1 2 3 4 5 6 7 8
The training results 0.7700 0.6501 0.5302 0.6600 0.5000 0.5598 0.4999 0.6803 Expected output 0.7700 0.6500 0.5300 0.6600 0.5000 0.5600 0.5000 0.6800 Relative error 0.0038% 0.0129% 0.0219% 0.0036% 0.0177% 0.0117% 0.0310% 0.0102%
Serial number 9 10 11 12 13 14 15 16
The training results 0.4801 0.5700 0.6598 0.5300 0.6998 0.6500 0.5901 0.5999 Expected output 0.4800 0.5700 0.6600 0.5300 0.7000 0.6500 0.5900 0.6000 Relative error 0.0027% 0.0200% 0.0045% 0.0171% 0.0029% 0.0068% 0.0088% 0.0045%
[image:7.595.236.377.523.566.2]After the training, it makes use of trained three-layer BP network and checks the input data respectively. The result is shown in table 11.
Table 11The error analysis of the test results
The serial number 17 18 The training results 0.4847 0.6973 Expected output 0.5100 0.6000 Relative error 0.0253 0.0973
From above the results, it shows that using BP neural network gets the maximumrelative error is 0.03106% between training data output value and the sample. The maximum relative error is 0.03106% between respecting data output value and the desired output. We can infer that network self-learning ability and the network performance are good, and also suggests that the comprehensive evaluation method is effective.
CONCLUSION
The problems ofthird party logistics and supply chain attract the attention of scholars and also have many research results. But collaborative logistics performance indicator systemoriented manufacturing and evaluation method are relative lack. This paper makes use of Balanced Scorecard to design the performance evaluation indicator system. And then, it puts forward a kind of model using AHP combined with BP neural network of comprehensive evaluation.Through the collaborative logistics performance evaluation oriented manufacturing automobile of Wen Ling, the model shows that it’s reasonable and accurate. From the evaluation results, main research conclusions are as follows.
evaluation results, financial index weight ratio is 0.3781 and business processindex weight ratio is 0.2934. So the two aspects accounts for as high as 0.6715. We can suggest that performance evaluation of logistics should strengthen the investment and application in finance and business processes.
Secondly, when building the BP neural network, it makes use of the adaptive learning rate momentum gradient descent back propagation algorithm-traingdxto avoid the local minimum value and improve the stability and efficiency of training model[8].
Thirdly,AHP makes subjective into objective descriptionand enhances the scientific and operation nature of the evaluation results by makingthrough the rational weight assignment to have quantitative processing of large quantities of qualitative index. BP neural network has great adaptive ability and can quickly absorb the knowledge and experience of experts to make more effective and objective evaluation results. Combining the method of AHP and BP neural network,it can provides a new evaluation method for collaborative logistics performance evaluation for manufacturing industry and the test shows that comprehensive evaluation method is effective.
However, collaborative logistics performance evaluation method presented in this paper for the manufacturing industry also has some deficiencies in practice. Firstly, the rationality of established indicator still needs further improvement. Secondly, BP neural network model requires a certain degree of learning samples which have great influence on the learning performance of the neural network model. But selecting the appropriate learning samples is a very difficult and complex. Therefore, aiming at the problems and shortcomings above, it should do further research and improvement work. In spite of this, performance evaluation model based on AHP-BP, easy to operate, provides new research ideas and ways of collaborative logistics performance as the research oriented manufacturing industry.
Acknowledgements
This paper is supported by the Program of the National Natural Science Foundation of China (Grant No. 71171070) and Zhejiang planted talent plan promotion project(Project grant No. 2013R407058)
REFERENCES
[1] Liu H T; Wang W K. Expert Systems with Applications, 2009, 36(3): 4387-4398.
[2] Yang Dequan; Pei Jinying. Operations research and management science, 2009 (5): 81-86. [3] Chen Dongdong; PengJiyuan..Statistics and decision making, 2009 (6): 180-181.
[4] Wu Yisheng. Research on manufacturing enterprise logistics performance evaluation system based on. Nanjing university of aeronautics and astronautics, 2006.
[5] Liang Jie; HouZhiwei. Systems engineering theory and practice, 2001, 3(3): 59-63. [6] Chen Wei. Audit and economic research, 2011 (5): 47-52.