A Motion Analysis in the Volleyball Spike – Part 2:
Coordination and Performance Variability
Ben Serrien
1,*, Jeroen Ooijen
1, Maggy Goossens
2,3, Jean-Pierre Baeyens
1,2,31Department of Biomechanics, Vrije Universiteit Brussel, Belgium 2Department of ICT and Electronics, University of Antwerp, Belgium
3Thim Van Der Laan University College, Switzerland
Copyright©2016 by authors, all rights reserved. Authors agree that this article remains permanently open access under the terms of the Creative Commons Attribution License 4.0 International License
Abstract Part one of this study described the
three-dimensional kinematics of male and female top level and junior elite volleyball players during a spike. Different strategies for generating a high impact speed for the hand were observed between the groups. This part focuses on variability in coordination and performance and will use a single-subject approach for the data-analysis. The research question concerns the relationship between coordination variability and skill level. Two hypotheses exist about this relationship: a continuous decrease of variability or a U-shaped relationship when skill level increases. We used different measures of skill level during this study. The discrete measure (top level vs. junior elite) showed no difference in coordination variability. The continuous measures showed both U-shaped and linear relationships with coordination variability when data from all groups were pooled together. No relationships were observed within the groups. Together with the insight gained from the mechanical analysis from part one, knowledge about the coordination variability can be used for guiding the training and learning process of youth elite volleyball players.Keywords Volleyball, Spike, Self-organizing Maps,
3D Kinematics, Coordination, Variability1. Introduction
Following the dynamical systems theory, variability in coordination is a functional necessity for both normal and optimal motor behavior [1]. In the context of a volleyball spike motion, coordination variability allows athletes to adapt to changing constraints. A volleyball rally is a very fast evolving system and players need to observe the opponents’ motions while building up to the spike. From lift off until ball impact lasts only about 400 milliseconds. Being in mid-air during a limited time frame before impact (while the opponents start to set-up their counter block),
coordination in such motions. Using Self-Organizing Maps, studies of biomechanics in volleyball spikes and services like in part one of this study and [18]–[21] can be complemented by studies on coordination (variability) to construct a more holistic approach of the movement dynamics. This may be beneficial for both trainers and physiotherapists working with athletes [22].
Two hypotheses have been presented in the literature to link coordination variability to skill level. Evidences of both are present. The first hypothesis states a continuous decrease of coordination variability through skill development [23]. Although this hypothesis allows the structure of variability to change (from e.g. Gaussian white noise to chaotic structure), the amount of variability continuously decreases. Data of baseball pitching mechanics suggest a continuous decrease of variability in several kinematic variables, but not in temporal and kinetic variables across increasing competition levels [24]. Also in baseball pitching, Stodden et al. [25] showed a continuous decrease in variability of temporal, kinematic and kinetic variables with an increase in ball speed. Dai et al. [26] provided evidence for a linear decrease in discus throwing variability with an increasing performance. Wagner et al. [27] studied movement variability in three throwing techniques in team-handball among players from three skill levels. Their results were consistent with the continuous-decrease hypothesis, but also showed an interaction with throwing technique. The data obtained by Hiley et al. [28] in gymnastics also contributed to this hypothesis and showed evidence of an interaction between mechanical importance and technical performance. The second hypothesis states a U-shaped relation between coordination variability and skill level where novices present a high (non-functional) variability which decreases with skill improvement, subsequently furthering into an (functional) increase when acquiring a level of expertise in skills. Wilson et al. [29] evidenced this hypothesis analyzing coordination variability in triple-jumpers across skill level (expressed as a percentage of the world record): the R² of the U-shaped curve-fits ranged between 0.3659 and 0.9868 for various coupling parameters. In team-handball throwing, Schorer et al. [30] also revealed a U-shaped relationship. Hiley et al. [28] combined both hypotheses and suggested that in motions with precision requirement, movement variability continues to decrease whereas in motions where adaptability to unexpected perturbations is required, the U-shaped hypothesis is more relevant.
Sport requires an optimal mixture of precision and adaptability. It can be hypothesized that both of the theorems are in fact two forms of the same phenomenon, but presented on different scales of skill level (e.g. discrete measures such as competition level or continuous measures like movement outcome) and highly dependent on sport, task difficulty, definition of variability and possible other factors. The previous discussion shows that the use of a certain definition of skill level can influence the results and favor one of both hypotheses. In this study we will use three measures of skill
level. The first choice will be contrasting elite professional with elite youth players. The other measures of skill level will be continuous: performance (hand impact speed and jumping height) and performance variability. The variability of performance can also be seen as a good measure of skill level. While variability in coordination can be functional, variability in motor output under constant task and environmental constraints is not optimal in a sports performance context. The highly redundant [4] and degenerate [31] human movement system should be able to produce a consistent outcome (at the level appropriate for each participant individually) with various solutions and thus performance variability can be low while still observing a functional level of coordination variability.
To gain insight into the mechanisms behind skill level and coordination variability, the aim of this study was to analyze differences and correlations in coordination variability, performance and performance variability in adult professional and elite youth volleyball athletes while performing a volleyball spike. To evaluate the evolution throughout skill development, a longitudinal cohort design is most appropriate. This research report presents the first outcomes (cross-sectional) of a longitudinal study over four years concerning the coordination dynamics of youth elite athletes.
2. Materials and Methods
The subjects, procedures, measurements and data processing have been described in part one of this study. It will be briefly reviewed and furthered with a description of the analysis of coordination variability. Top level (male n = 8, female n = 10) and junior elite (male n = 8, female n = 11) volleyball players were recruited to perform ten correct volleyball spikes towards a 3 m by 3 m target at the backside of the field. The ball was tossed up by a professional setter who presented very little variability in toss-up (see results part one). They were instructed to perform the spike with maximal effort. Three-dimensional kinematics of the pelvis, trunk, shoulder and elbow were calculated and the time series of all the variables were centralized around ball impact. These time series were used as input for the construction of neural networks and the study of coordination variability.
2.1. Self-organizing Maps
maps [13] – previously used in many applications to human movement and sports [14], [15], [32]–[35]. SOMs are a class of artificial neural networks, ideal for high-dimensional datasets that can be used in a variety of applications from pattern recognition and classification to non-linear data reduction and others [13]. In this study, SOMs were used to construct a holistic measure of coordination (order parameter or collective variable in the language of coordination dynamics ) for every player for every trial. The variability on this order parameter will be used as the measure of coordination variability.
Basically, a SOM consists of several input and output nodes (units), all connected to each other and arranged in a two-dimensional grid. Every unit has a weight-vector with the same dimension as the number of variables of the input vectors. In this study, the input vectors consisted of the twenty measured joint angles and angular velocities at every point in time. Before these input vectors are fed to the map, they were normalized because the SOM uses a Euclidean distance (otherwise the SOM would be dominated by the variables with the highest values on their original scale). The input vectors are fed to the map in an iterative way and for every iteration, the output units engage in a competitive vector learning algorithm to better represent the original data. Each time an input vector is presented to the map, the algorithm searches for the output unit with the smallest distance to the input vector, this is the so-called best-matching unit. This units’ weight vector is updated to match the input vector more closely. Also the units around the best-matching unit are updated to preserve the topological structure of the original data (the neighboring units are updated by a smaller amount according the neighborhood function and -radius). After several iterations, the SOM is trained to represent the high-dimensional input data in a two-dimensional output map. For the time-series data in this study, a trajectory of consecutive best-matching units can be formed and plotted on top of the map to represent the coordination pattern for every trial. This best-matching unit trajectory is the order parameter that will be used to calculate coordination variability in this study. The SOM can be visualized in a variety of ways. The
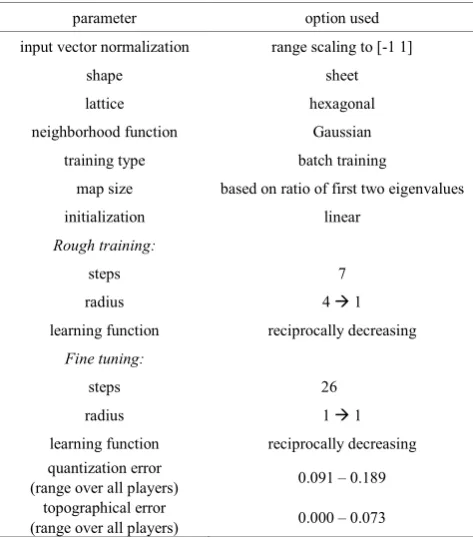
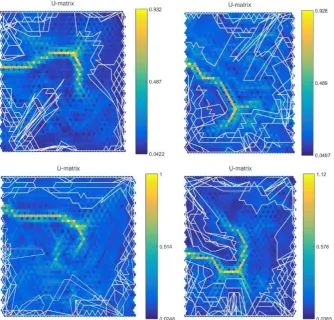
[image:3.595.313.550.290.559.2]U-matrix has been described as a hybrid representation of grid-space and weight-space and is therefore an excellent option [15]. Figure 1 shows the U-matrices for the SOMs of four players with the best-matching unit trajectories (white lines) on top of them. The cells of the U-matrix (little hexagons) show the Euclidean distance between neighboring SOM units. The cells representing SOM units show the average distance to neighboring SOM units. For the quantification of coordination variability, we followed the calculations outlined in Lamb et al. [34] to construct a measure of total trial variability (TTV). All options that were used in this study for the SOM parameters are displayed in Table 1. More information and mathematical formulae can be found in [13], [17]. All analyses were done in Matlab R2015a for Windows with the open-source SOM Toolbox for Matlab [17].
Table 1. SOM training parameters and map quality parameters
parameter option used
input vector normalization range scaling to [-1 1]
shape sheet
lattice hexagonal
neighborhood function Gaussian
training type batch training
map size based on ratio of first two eigenvalues
initialization linear
Rough training:
steps 7
radius 4 1
learning function reciprocally decreasing Fine tuning:
steps 26
radius 1 1
learning function reciprocally decreasing quantization error
(range over all players) 0.091 – 0.189 topographical error
Figure 1. Examples of U-matrices with best-matching unit trajectories (white lines) for top level male (upper left), female (upper right) and junior elite male (lower left) and female (lower right) volleyball players. The color code of the map indicates the Euclidean distance. The direction of time is arbitrary and is different in all players (clockwise in the upper figures and counter-clockwise in the lower figures for these examples).
2.2. Statistical Procedures
To test for differences in coordination variability between the four groups, a 2-way ANOVA (double between design) was done with gender and level of expertise as main factors. Normality was assessed visually with a QQ-plot and numerically with the Shapiro-Wilk test and homogeneity of variance was checked with the Levene’s test. Linear and second degree polynomial fits were calculated between coordination variability and continuous measures of skill level to determine the degree and kind of relation. All statistical analyses were done in Matlab R2015a for Windows, the level of statistical significance was set at 0.05.
3. Results
Normal distribution of coordination variability was assured by the QQ-plot and the Shapiro-Wilk test (p = 0.171) and homogeneity of variance also satisfied Levene’s test (p = 0.343). Figure 2 presents the boxplots of the TTV-values for all groups. The two-way ANOVA on coordination variability did not reveal a significant interaction effect (F1,33
= 2.639, p = 0.114, partial eta² = 0.074, power = 0.351). The main effect of gender was statistically significant (F1,33 =
12.247, p = 0.001, partial eta² = 0.271, power = 0.925) but the main effect of expertise was not (F1,33 = 1.120, p = 0.298,
partial eta² = 0.033, power = 0.177). Male players had a significant lower coordination variability than female volleyball players for both skill levels. Consequently, these results would favor no relationship between coordination variability and skill level, only between coordination variability and gender.
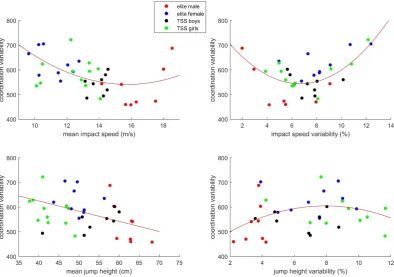
[image:4.595.322.543.528.723.2]Figure 3. Relationships between coordination variability and performance (left panels) and performance variability (right panels).
The continuous variables used as skill level parameters however, did display a relationship. The data in Figure 3 indicate that the relationship between impact speed and coordination variability was non-linear. This is mostly evidenced by the two top level male players with the highest mean impact speed which levered the curve upwards at the end. The R² from the second degree polynomial fit (0.2373) is higher than the linear fit R² (0.1609), favoring the U-shaped relationship over the continuous decreasing trend. For the relationship between coordination variability and impact speed variability, the U-shaped relationship (R² = 0.5693) is favored over the continuously decreasing trend (R² = 0.1917), here due to an up levering effect at the lower end of impact speed variability of the same two male top level players. For mean jump height, we did not observe any bending of the fitted curve at the highest heights (linear fit R² = 0,1897). For jump height variability, no obvious trend is visible. Both linear and second degree fit yielded marginal coefficients of determination (0,0306 and 0,0871 respectively). The second degree polynomial even yielded a reversed U-shape, not in accord with any theoretical rationale.
4. Discussion
The aim of the current research project was to explore the evolution of coordination variability in the volleyball spike throughout the learning process of elite youth athletes. This paper presented the first outcomes of these measurements and compared them to data from top-level professional volleyball players. This comparison provides an immediate
view over a long-term development, but has its inherent problems in being a cross-sectional design. The research questioned the relationship between coordination variability and skill level and how this relationship presented at different measures of skill level (continuous decrease hypothesis vs. U-hypothesis).
The difference in coordination variability and the discrete measure of skill level between top level and elite youth players was not significant. For gender the difference was significant. Part one of this study concluded that the male players had significantly higher impact speeds and jumping heights than the female players. Hence, the continuous measures can give a more detailed view. It is also possible that discrete measures of skill level can indicate a relationship with coordination variability, but because of the cross-sectional design we could not demonstrate this. The longitudinal follow-up of this cohort of junior elite players over the following four years can answer this question. It is also possible that our junior elite players do not differ enough of the top-level players because they are a select group aimed at becoming top-level players.
respectively. These different results indicate that the relation between skill level and coordination variability is dual and depends on what scale they are measured. Perhaps even more relations would have been visible if we used also different kinds of measures for coordination variability.
The amount of variability that could be explained in this study is somewhat lower than some of the variables in the study of Wilson et al. [29], but more importantly, the relations depended on the measure of skill level. Perhaps the R²-values would have been higher if we had been able to sample more top level male players, because these players provided the evidence for the U-shapes. If we had more samples in the upper range of impact speed and lower range of impact speed variability, stronger relationships could be possible. Within a measure of skill level, clear differences between groups could obscure the type of relationship that is observed. Temprado et al. [5] also observed an interaction effect on both the strength and direction of coupling between level of expertise (novices vs. experts) and different measures of coordination in volleyball (couplings between shoulder-elbow-wrist). It is advisable to define different measures of skill level to be used in a research or practical setting.
Besides interesting results on a methodological level, there is also theoretical and practical relevance of this research. On a theoretical level, this new evidence in favor of the U-hypothesis contributes to the self-organized ‘freezing and unfreezing of degrees of freedom’ [4] when developing to respectively an intermediate and expert level. Freezing certain degrees of freedom can be at first beneficial to performance and skill development by focusing attention to the mechanical more important aspects to performance (as suggested by Hiley et al. [28], but to obtain a high skill level, freezing might be a limiting factor. It has been argued extensively [1], [3], [36] that new forms of coordination patterns result from a self-organization of dynamic synergies and that a certain degree of variability is necessary to allow phenomena like bifurcations and non-equilibrium phase transitions to occur. Transitions to higher levels of skill level are often characterized by a more optimal form of coordination. With respect to pathologies and overuse injuries the development of variability is an important issue [7], [12]. Various pathological states (also outside the neuromuscular level like in cardiology) are characterized by a reduced state or a change in structure of variability. From a point of view of applied sport science, the observed results may help trainers to resolve an important issue in training. Do we have to instruct athletes to try reaching a textbook execution according to some sort of model performance or is more variability in the motion a key element for training? By using an individual analysis of coordination and several measures of skill level and plotting individuals on these theoretical curves, we could see where an athlete is located with respect to his peers and with respect to earlier measurements. Players performing high above these curves could be advised to train for a more consistent coordination
pattern, because their coordination variability could be non-functional. Vice versa, players under these theoretical curves could benefit more from a differential and variable training program. Wagner and Müller [37] showed a case-study in team-handball with such a training approach which was very beneficial in improving the throwing speed of the subject. This statement with respect to training practice should be taken within the limits of this study and deserves further research.
Some limitations of this study were present. First of all, we used a cross sectional design, but we are working on the longitudinal follow-up, so a more valid result will be obtained in the near future. Moreover a discussion of our measure of coordination is in order. First of all, we used only one measure of coordination, namely the total trial variability in weight space on a SOM, and perhaps other measures could have given different results. We believe that SOM is the best (current) measure of coordination in a high dimensional discrete motion because it makes no assumptions on the data, can handle large high-dimensional data-sets, has a good topological preservation of the input data and are better able to find non-linear patterns than classical measures like for instance principal component analysis. In our study, SOMs only included kinematic variables and no measures of muscle activity (surface electromyography, sEMG) like in the studies of Lamb et al. [15], [34]. Theoretically, we could increase the dimensionality of the SOM-weight space with input from kinematics from the lower limbs, joint kinetics and –power and sEMG. We chose for kinematic variables (attitude and velocities) of the pelvis, trunk, shoulder and elbow, because these are the final segments and joints in the chain involved in the volleyball spike and therefore, it are these variables that are directly linked to ball speed.
5. Conclusions
We presented data that support both a linear (continuous) decrease and a U-shaped relationship between skill level and coordination variability. The kind and strength of the relationship was dependent on the measure of skill level. A discrete measure (top level vs. junior elite) revealed no difference in variability, but continuous measures did show evidence for both relationships. Impact speed of the spike hand and impact speed variability favored a U-shaped relationship, jumping height favored a linear decrease and jumping height variability showed no relationship at all. More longitudinal research is necessary to evaluate how variability evolves over skill development and could be used to develop training guidelines targeting a more variable training regime when athletes reach a certain skill level.
Acknowledgements
in this study, Brecht Van Kerckhove for coordinating with the Topsportschool and Louis Curtil, Eline De Cleyn and Charlotte Genbrugge who were involved in the project for their Master thesis.
REFERENCES
[1] S. J. A. Kelso, Dynamic Patterns. The self-organization of brain and behaviour. Cambridge, MA: MIT Press, 1995. [2] C. Button, C. M. Lee, A. D. Mazumder, W. K. C. Tan, and J.
Chow, “Empirical Investigations of Nonlinear Motor Learning,” pp. 49–58, 2012.
[3] W. I. Schöllhorn, P. Hegen, and K. Davids, “The Nonlinear Nature of Learning - A Differential Learning Approach,” Open Sports Sci. J., vol. 5, no. Suppl 1–M11, pp. 100–112, 2012.
[4] N. A. Bernstein, The co-ordination and regulation of movements. Oxford: Pergamon Press, 1967.
[5] J. Temprado, M. Della-Grasta, M. Farrell, and M. Laurent, “A novice-expert comparison of (intra-limb) coordination subserving the volleyball serve,” Hum. Mov. Sci., vol. 16, pp. 653–676, 1997.
[6] J. Hamill, J. M. Haddad, and W. J. Mcdermott, “Issues in Quantifying Variability From a Dynamical Systems Perspective,” J. Appl. Biomech., vol. 16, pp. 407–418, 2000. [7] J. Hamill, C. Palmer, and R. E. a Van Emmerik,
“Coordinative variability and overuse injury.,” Sports Med. Arthrosc. Rehabil. Ther. Technol., vol. 4, no. 1, p. 45, Jan. 2012.
[8] R. T. Harbourne and N. Stergiou, “Movement variability and the use of nonlinear tools: principles to guide physical therapist practice.,” Phys. Ther., vol. 89, no. 3, pp. 267–82, Mar. 2009.
[9] E. Preatoni, J. Hamill, A. J. Harrison, K. Hayes, R. E. a. Van Emmerik, C. Wilson, and R. Rodano, “Movement variability and skills monitoring in sports,” Sport. Biomech., no. April 2013, pp. 1–24, Nov. 2012.
[10] R. Rein, “Measurement Methods to Analyze Changes in Coordination During Motor Learning from a Non-linear Perspective.,” Open Sports Sci. J., vol. 5, no. 1, pp. 36–48, Sep. 2012.
[11] W. I. Schöllhorn, “Applications of artificial neural nets in clinical biomechanics.,” Clin. Biomech. (Bristol, Avon), vol. 19, no. 9, pp. 876–98, Nov. 2004.
[12] N. Stergiou and L. M. Decker, “Human movement variability, nonlinear dynamics, and pathology: is there a connection?,” Hum. Mov. Sci., vol. 30, no. 5, pp. 869–88, Oct. 2011.
[13] T. Kohonen, Self-Organizing Maps, 3rd. Ed. Springer, 2001. [14] H. Bauer and W. Schöllhorn, “Self-Organizing Maps for the
Analysis of Complex Movement Patterns.,” Neural Process. Lett., vol. 5, pp. 193–199, 1997.
[15] P. Lamb, R. Bartlett, and A. Robins, “Artificial neural networks for analyzing inter-limb coordination: the golf chip shot.,” Hum. Mov. Sci., vol. 30, pp. 1129–1143, Dec. 2011. [16] P. Lamb, R. Bartlett, and A. Robins, “Self-Organising Maps :
An Objective Method for Clustering Complex Human Movement,” Int. J. Comput. Sci. Sport, vol. 9, pp. 20–29, 2010.
[17] J. Vesanto, J. Himberg, E. Alhoniemi, and J. Parhankangas, “SOM Toolbox for Matlab 5,” 2000.
[18] J. C. Reeser, G. S. Fleisig, B. Bolt, and M. Ruan, “Upper limb biomechanics during the volleyball serve and spike.,” Sports Health, vol. 2, no. 5, pp. 368–74, Sep. 2010.
[19] A. S. Rokito, F. W. Jobe, M. M. Pink, J. Perry, and J. Brault, “Electromyographic analysis of shoulder function during the volleyball serve and spike,” J. Shoulder Elb. Surg., vol. 7, no. 3, pp. 256–263, 1998.
[20] M. Tilp, H. Wagner, and E. Müller, “Differences in 3D kinematics between volleyball and beach volleyball spike movements.,” Sport. Biomech., vol. 7, no. 3, pp. 386–97, Sep. 2008.
[21] H. Wagner, J. Pfusterschmied, M. Tilp, J. Landlinger, S. P. von Duvillard, and E. Müller, “Upper-body kinematics in team-handball throw, tennis serve, and volleyball spike.,” Scand. J. Med. Sci. Sports, pp. 1–10, Jul. 2012.
[22] P. Glazier, “Game, Set and Match? Substantive Issues and Future Directions in Performance Analysis.,” Sport. Med., vol. 40, no. 8, pp. 625–634, 2010.
[23] K. M. Newell, R. van Emmerik, and R. L. Sprague, “Stereotypy and variability,” in Variability and motor control, K. M. Newell and D. M. Corcos, Eds. Champaign; Ill.: Human Kinetics., 1993.
[24] G. Fleisig, Y. Chu, A. Weber, and J. Andrews, “Variability in baseball pitching biomechanics among various levels of competition.,” Sports Biomech., vol. 8, no. 1, pp. 10–21, Mar. 2009.
[25] D. F. Stodden, G. S. Fleisig, S. P. McLean, and J. R. Andrews, “Relationship of biomechanical factors to baseball pitching velocity: Within pitcher variation,” J. Appl. Biomech., vol. 21, no. 1, pp. 44–56, 2005.
[26] B. Dai, S. Leigh, H. Li, V. S. Mercer, and B. Yu, “The relationships between technique variability and performance in discus throwing,” J. Sports Sci., vol. 31, no. August 2013, pp. 1–10, 2012.
[27] H. Wagner, J. Pfusterschmied, M. Klous, S. P. von Duvillard, and E. Müller, “Movement variability and skill level of various throwing techniques.,” Hum. Mov. Sci., vol. 31, no. 1, pp. 78–90, Feb. 2011.
[28] M. J. Hiley, V. V Zuevsky, and M. R. Yeadon, “Is skilled technique characterized by high or low variability? An analysis of high bar giant circles.,” Hum. Mov. Sci., vol. 32, no. 1, pp. 171–80, Feb. 2013.
[30] J. Schorer, J. Baker, F. Fath, and T. Jaitner, “Identification of interindividual and intraindividual movement patterns in handball players of varying expertise levels.,” J. Mot. Behav., vol. 39, no. 5, pp. 409–21, Sep. 2007.
[31] G. M. Edelman and J. A. Gally, “Degeneracy and complexity in biological systems.,” Proc. Natl. Acad. Sci. U. S. A., vol. 98, pp. 13763–13768, 2001.
[32] R. M. Bartlett, P. F. Lamb, D. O’Donovan, and G. Kennedy, “Use of self-organizing maps for exploring coordination variability in the transition between walking and running.,” Int. J. Comp. Psychol., vol. 27, pp. 123–137, 2014.
[33] G. Barton, A. Lees, P. Lisboa, and S. Attfield, “Visualisation of gait data with Kohonen self-organising neural maps.,” Gait Posture, vol. 24, no. 1, pp. 46–53, Aug. 2006.
[34] P. Lamb, R. Bartlett, S. Lindinger, and G. Kennedy,
“Multi-dimensional coordination in cross-country skiing analyzed using self-organizing maps.,” Hum. Mov. Sci., vol. 33, pp. 54–69, 2014.
[35] A. Lapham and R. Bartlett, “The use of artificial intelligence in the analysis of sports performance: A review of applications in human gait analysis and future directions for sports biomechanics.,” J. Sports Sci., vol. 13, pp. 229–237, 1995.
[36] L. Seifert, C. Button, and K. Davids, “Key properties of expert movement systems in sport : an ecological dynamics perspective.,” Sports Med., vol. 43, no. 3, pp. 167–78, Mar. 2013.