Journal of Chemical and Pharmaceutical Research, 2014, 6(3):1496-1500
Research Article
CODEN(USA) : JCPRC5
ISSN : 0975-7384
Determination of ferulic acid content in Cyperus rotundus by HPLC
Yingxia Li
School of Pharmacy, Qingdao University, 38 Deng-zhou Road, Qingdao, China
_____________________________________________________________________________________________
ABSTRACT
A simple accurate HPLC method was developed for determining the ferulic acid content in Cyperus rotundus rhizomes. The chromatographic system was equipped with a Kromasil C 18 (150 mm × 4.6 mm, 5 µm) column and UV detector set at 320 nm, in conjunction with a mobile phase of methanol and water containing 1% (v/v) acetic acid in a ratio of 30:70, at a flow rate of 1.0 ml/min. The method was examined in linearity, precision, stability, repeatability, and recovery. The retention time for ferulic acid was found to be 12.308 min; the linearity was within the range from 0.0162 to 0.162 µg, with the correlation coefficient (R) amounting to 0.9996, and the average percentage recovery was 98.75%. Employing this method, the ferulic acid content of the Cyperus rotundus, collected from twelve source areas in China, was measured, the content varying in a range of 0.027−0.0462%. Due to its accuracy and rapidness, this method can serve as an effective way for evaluating the quality of Cyperus rotundus.
Key words: HPLC, Cyperus rotundus, ferulic acid
_____________________________________________________________________________________________
INTRODUCTION
Cyperus rotundus Linn, a sedge of family of Cyperaceae, Cyperales, is an erect perennial glabrous grass with subterranean stolons ending in ovoid or cylindrical brown edible tubers [1]. It grows in many areas of China, India, and other countries with suitable climate for it. Cyperus rotundus is a traditional medicinal plant drug used for the treatment of spasms stomach disorder, pain, depression, abnormal menstruation, and dysmenorrhesa [2]. It is known that Cyperus rotundus contains many different chemical contents, including volatile oils, alkaloids, glycosides, saponins, flavonoeds, and tannins [3, 4].Most previous studies of Cyperus rotundus focused on its volatile oil or volatile components, while other non-volatile components contained in it, such as flavnoeds, phenols compounds, have attracted little attention [5-8]. In 2009 Soumaya et al reported eight other new compounds separated from Cyperus rotundus, among which were ferulic acid and catechuic acid [4].Ferulic acid, which is one of the main active compositions in Cyperus rotundus, has effects of anti-oxidation, pain easing, and platelet aggregation inhibiting [9-11]. Up to now, no method has been reported for the quantitative analysis of ferulic acid in Cyperus rotundus. In this work we developed such a method for measuring the content of ferulic acid in Cyperus rotundus by HPLC. Using this method, we measured the contents of Cyperus rotundus obtained from twelve different areas in China. The method reported here provides a useful way for quality controlling of Cyperus rotundus as a drug.
EXPERIMENTAL SECTION
Instrumentation and Chromatographic conditions
Reagents and chemicals
As the work standard for content measurement, the ferulic acid was purchased from National Institute for the Control of Pharmaceutical and Biological Products (Beijing, China), with purity of > 98% (Lot No. of 0773-9910). The Methanol used was of HPLC grade, while the water was double distilled. Other chemicals used in the chromatographic experiment were of analytical grade.
Plant materials
The fresh rhizomes of Cyperus rotundus used in this work were collected from twelve main growing areas in China, including Shandong, Zhejiang, Henan, Guangxi, Yunnan, and Hainan provinces. The rhizomes were air-dried at room temperature, and ground into fine power using a blender.
Mobile phase preparation
A mixture was prepared of Methanol and water in the ratio of (30:70) % (v/v), containing 1 % (v/v) acetic acid.
Preparation of standard solution
An amount of 8.1 mg standard ferulic acid was weighted precisely, and was put into a brown flask of volume of 50 ml. with 10 ml of methanol added into it, the flask containing the mixture was mechanically shaken for 5 min, making a standard ferulic acid solution for stock, with a concentration of 162 µg/ml. The stock solution was then filtered using a 0.45 µm nylon syringe filter. After that, 200 µl of filtered solution was taken and put into a brown flask of volume of 10 ml. By adding methanol to its full scale, the standard solution for use in the experiment was made, containing 3.24 µg of ferulic acid per 1 ml.
Preparation of sample solution
An amount of 500 mg homogenized power of Cyperus rotundus rhizomes was accurately weighted, and was put into a 250 ml volumetric flask. Adding 50 ml of ethanol solution (70% ) (v/v) containing 5% (v/v) hydrochloric acid into it, the flask was sealed with a plug, and was weighted precisely. It was then heated for 3 hours, for the ethanol to be vaporized and re-condensed. After its cooling to room temperature, it was weighted again. The lost weight was compensated with corresponding solvent, and then the flask was shaken mechanically until a homogenized state of the inside solution was achieved. It was then kept still for enough time. The clear solution from the upper part was filtered through a 0.45 µm membrane filter, and serves as the sample solution.
RESULTS AND DISCUSSION
Applicability of the system
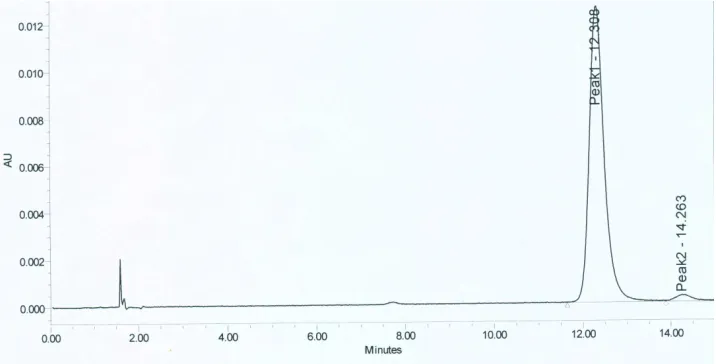
Under the chromatographic conditions mentioned above, 10 µl of standard solution was injected, and the measurement was made at 320 nm. Figure 1 shows the standard chromatogram, the retention time for ferulic acid was 12.308 min. As in the case of the standard solution, the measurement on the sample solution was also made by injecting 10 µl of solution. One sees in the sample chromatogram, which is shown in Fig. 2, that a chromatographic peak also occurs at the same retention time (12.479 min) as for the standard sample. Spectroscopic analysis indicates that this peak corresponds to a single substance, which is the same as that of the standard sample, i.e., the ferulic acid. The degree of separation of ferulic acid from its adjacent peaks was determined to be in excess of 1.5.
[image:2.595.129.487.562.744.2]
Figure 2: Chromatogram of Cyperus rotundus sample
Method validation
The method was validated for linearity, precision, stability, repeatability, and recovery study in accordance with Chinese Pharmacopoeia [12-14].
Linearity
A group of samples of stock standard solution (162 µg/ml), with increasing amounts of 100, 200, 300, 400, 500, 700, and 1000 µl, respectively, were taken, each of which was put into a brown flask of 10 ml, and was diluted by adding methanol to the full scale of the flask, making standard solutions of different concentrations. The peak area was recorded for each of these standard solutions, with 10 µl of sample being injected. A regressing analysis was performed, with the injection amount (X) represented by the horizontal axis, and the peak area (Y) by the vertical axis. The resulting correlation coefficient was determined to be R = 0.9996, while the linearity was within a range from 0.0162 to 0.162 µg, with a regression equation obtained as Y = 1.06 × 10⁷X − 46810.3. The linearity curve is depicted in Figure 3.
Figure 3: Linearity curve for the ferulic acid standard
Precision
Measurements at 320 nm were made for five times, with 10 µl of standard solution (3.24 µg/ml) injected successively, the RSD of averaged peak area for the ferulic acid being 0.52%, showing a good precision of the instrument.
Stability
[image:3.595.155.411.468.654.2]time with an interval of 2, 4, and 8 h, respectively. The averaged peak area was determined to be 344707, with a RSD of 1.08%. The results show that the sample solution was stable within 8 h.
Repeatability
Five samples of power (2#) of the same amount were weighted, and sample solutions were prepared following the same procedures as described above. Measurements were made for each sample, with 10 µl of solution injected. The content of ferulic acid was then calculated for each sample, and the resulting averaged content was 0.0403%, with RSD of 1.69%, demonstrating the good repeatability of the current method.
Recovery examination
Five samples of 250 mg of Cyperus rotundus power (2#) containing 0.322 (mg/g) of ferulic acid were weighted, from which the sample solutions were prepared by adding 1 ml of standard solution of ferulic acid of concentration of 94 µg/ml (with 1:1 ferulic acid ratio of the added standard solution to the sample). Measurements were then made for these samples, with peak areas being recorded. From these measurements the recovery for each sample was calculated according to Formula 1 (as given below), yielding an mean recovery for ferulic acid of 98.75%, with RSD of 1.18%. The results indicate that the recovery of this method meets the requirement for measurement. The data for recovery were listed in Table 1, in which M1 is weighted quality of sample; M2 is calculated amount of ferulic acid in each sample; M3 is amount of ferulic acid standard; and M4 is amount of ferulic acid measured for each sample.
Tablet 1: Experimental results for the recovery of ferulic acid
M1 (mg) M2 (mg) M3 (mg) M4 (mg) Recovery
(%) Mean recovery (%)
RSD (%)
250.1 0.1008 0.094 0.1941 99.26 250.5 0.1010 0.094 0.1933 98.19
248.3 0.1000 0.094 0.1926 98.51 98.75 1.18 250.7 0.1010 0.094 0.1954 100.43
243.8 0.0983 0.094 0.1898 97.34
Formula 1:Recovery (%) = (M4− M2) / M3× 100 %
Measurements of samples
Using the method presented here, the ferulic acid content in different Cyperus rotundus samples, which were collected in several areas in China, was measured. Three samples of 500 mg of Cyperus rotundus powder were weighted for each source area, from which the sample solutions were prepared following the same procedures as described above. Standard solutions were also prepared in accordance with the method for the ferulic acid standard solution. Measurements were then made for all the samples. Listed in Table 2 are the averaged ferulic acid content and the corresponding RSD, calculated according to the external standard method, using the measured results for the three samples of each source area.
Tablet 2: Contents of ferulic acid in Cyperus rotundus from different source areas
Sr. No. Source areas Mean ±SD (mg/g ) RSD (%)
1 Taian , Shandong 0.403 ± 0.0015 0.37 2 Dongping, Shandong 0.322 ± 0.0021 0.65 3 Linyi, Shandong 0.293 ± 0.0039 1.33 4 Yishui , Shandong 0.462 ± 0.0045 0.97 5 Weifang, Shandong 0.332 ± 0.002 0.60 6 Liangshan, Shandong 0.373 ± 0.0028 0.75 7 Heze, Shandong 0.280 ± 0.0048 1.71 8 Dali, Yunnan 0.308 ± 0.0029 1.20 9 Hainan 0.363 ± 0.0034 0.94 10 Sheqi, Henan 0.377 ± 0.0042 1.11 11 Zhejiang 0.272 ± 0.0025 0.92 12 Guangxi 0.324 ± 0.0010 0.31
CONCLUSION
REFERENCES
[1] HW Swift. Sedge. In: The Encyclopaedia Americana, vol.24, International Edition, Grolier Incorporated Publishers & Distributors, Danbury, Connecticut, 1989, 513.
[2] Chinese Pharmacopoeia Committee. Chinese Pharmacopoeia, vol. I, 1st Edition, Medicine Science and Technology Press, Beijing, China, 2010, 241-242.
[3] Vu VD, Pham XS, Tap Chi Duoc Hoc, 1993, 4, 20.
[4] S Kilani-Jaziri; A Neffati; I Limema; J Boubakera; I Skandrani; MB Sghaira; I Bouhlel; W Bhouri; AM Mariotted; K Ghediraa; M-GD Francac; L Chekir-Ghediraa, Chem. Biol. Interac., 2009, 181 (1), 85-94.
[5] GQ Liu; QJ Wang; ZQ Xie, Zhongguo Yaokedaxue Xuebao (in Chinese), 1989, 20(1), 48-50. [6] YJ Jia; JL MO, Zhong Yao Cai (in Chinese), 2005, 28(8), 722-723.
[7] J Jin; YL Cai; ZX Zhao; JL Ruan, Zhong Yao Cai (in Chinese), 2006, 29(5), 490-492.
[8] Y Chen; YY Zhao; XY Wang; JT Liu; LQ Huang; CS Peng, Zhong Yao Cai (in Chinese), 2011, 34(8) ,1225-1229.
[9] SY Wang; HS Lin, Agric Food Chem, 2000, 48(2), 140-146.
[10] WH Lv; L Zhang; SJ Wu, Zhongguo Zhongyao Za Zhi (in Chinese), 2013, 38(21), 3736-3741.
[11] AY Wang; Y Lu; WX Chen, JA Duan; LJ Zhang; ZG Sun, Zhonghua Zhongyiyao Za Zhi (in Chinese), 2010, 25(10), 1586-1588.