International Journal of Emerging Technology and Advanced Engineering
Website: www.ijetae.com (ISSN 2250-2459,ISO 9001:2008 Certified Journal, Volume 4, Issue 7, July 2014)
500
Evaluation of Groundnut (Arachis hypogaea L.) Genotypes for
Quantitative Character & Yield Contributing Traits
Satyanarayan Patidar1, Prashant Kumar Rai
2, Arvind Kumar
32Assistant Professor, 1,3Ph.D. Scholar, Department of Genetics and Plant Breeding, Allahabad School of Agriculture Sam
Higginbottom Institute of Agriculture, Technology & Sciences, Allahabad- 211007, Uttar Pradesh, India.
Abstract--Fourteen groundnut genotypes obtained from International Crop Research Institute of Semi Arid Tropics (ICRISAT), Patancheru, Hyderabad, (A.P.), India evaluated for Quantitative and Yield parameters. The crop was sown during kharif season 2013 at Field Experimentation Center, Department of Genetics and Plant Breeding, Faculty of Agriculture, SHIATS, Allahabad Uttar Pradesh. The experiment was laid out in randomized block design with three replications, 14 quantitative parameters were studied. The analysis of variancerevealed the prevalence of significant different among the genotypes for all studied parameters viz. field emergence, days to 50% flowering, plant height, number of primary branches/plant, days to maturity, number of pod per plant, pod yield per plant, pod yield, seed yield per plant, seed index (hundred kernels weight), shelling percentage, kernel yield, sound matured kernels and kernel uniformity. Based on per se performance genotypes, ICG 8567, ICG 8490 and ICG 7181 were found to best for pod yield per plant. High to moderate estimates of genotypic coefficient of analysis(GCV) and coefficient of analysis (PCV) were exhibited by kernel yield q/ha, pod yield q/ha, pod yield per plant(g),number of pod per plant, indicating that these character could be used selection indices for crop improvement. The exhibited high values for heritability (broad sense), seed yield per plant, number of pod/plant, followed by kernel yield (q./ha.)and pod yield per plant. Exhibited high values for genetic advance for pod yield per plant, field emergence (%) followed by seed yield per plant and plant height. Depicted high values for genetic advance as mean percent plant height, kernel yield (q/ha.) followed seed yield per plant and pod yield per plant.
Keywords-- Groundnut (Arachis hypogaea L.) GCV, PCV, Heritability, Genetic Advance.
I. INTRODUCTION
Groundnut (Arachis hypogaea L.) is one of the important oilseed self pollinated crop belongs to family Leguminosae (old name) Fabaceae (new name) and sub family Popiliniaceae, and chromosome no.2n=40 with two genomes, A and B. and these origin in Brazil. groundnut as Arachis (derived from the Greek “arachos” meaning a weed) hypogaea (meaning an underground chamber) or in botanical terms, a weed fruits produced below the soil. It is believed to have originated in the Bolivian region of South America where the greatest diversity is found.
The gene pool of cultivated groundnut is divided into two subspecies fastigiata and hypogaea. The subspecies fastigiata is sub divided into four botanical varieties, fastigiata, peruviana, aequatoriana and vulgaris whereas; sub species hypogaea includes varieties hypogaea and hirsuta (Krapovickas and Gregory, 1994).Groundnut are grown in tropical and sub tropical region of the world Globally, The area, production and productivity of groundnut in India during 2012-13 is 5.0 mha, 5.43 mt, 1.08 t/ha. (Annual Report, Directorate of Groundnut Research, 2013). The western world, most of the groundnut goes into food uses where groundnut butter, roasted groundnut and salted groundnut are preferred food for consumers (Ahmed and Young, 1982). According to
Patra et al., 2011, groundnut is primarily used for extraction of oil, with an analysis of about 46.70%. It is also consumed directly because of its high food value, which is again due to its higher content of protein (22.0%), carbohydrate (10.0%) and minerals (3.0%). Hence, in the present study groundnut genotypes were evaluated for quantitative character and also asses genetic parameters among fifteen (14 Genotypes + 1 local check) genotypes of groundnut.
II. MATERIALS AND METHODS
International Journal of Emerging Technology and Advanced Engineering
Website: www.ijetae.com (ISSN 2250-2459,ISO 9001:2008 Certified Journal, Volume 4, Issue 7, July 2014)
501
Analysis of variance to test the significance difference among accessions for eachcharacter was carried out as per methodology suggested by Panse and Sukhatme (1967). GCV and PCV were calculated by the formula given byBurton (1952), heritability in broad sense (h2) was worked out by using formula suggested by Lush (1949), Burton
and Devane (1953) and genetic advance i.e. the expected genetic advance were calculated by using the procedure given by Lush (1949), Johnson et al., (1955).
III. RESULTS AND DISCUSSION
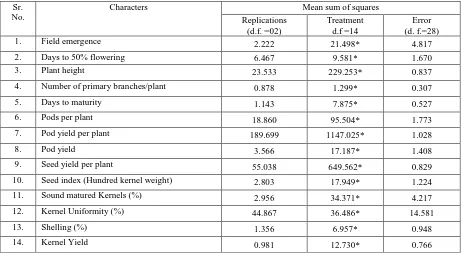
The analysis of variance for different characters is presented in Table 1 the mean sum of squares due to genotypes showed significant difference for all 14 quantitative characters studied. The mean sum of squares were suggesting that the selected genotypes were genetically variable and considerable amount of variability existed among them. Similar results were also reported by
[image:2.612.76.537.284.537.2]Korat et al., (2009), Savaliya et al., (2009), Singh et al. (2013),Shukla and Rai (2014), and Maurya et al. (2014).
Table 1.
Analysis of variance for 14 quantitative Characters in 15 Groundnut genotypes during Kharif season2013
*Significant at 5% Level of significant respectively
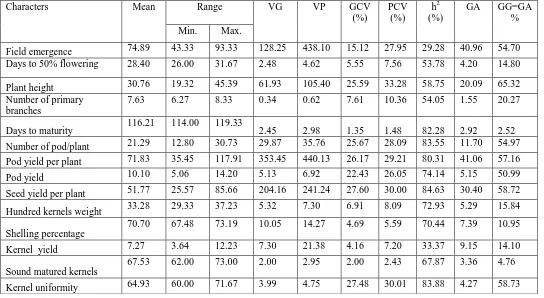
The genotypic coefficient of variation provides a measure to compare of genetic variability present in 14 quantitative parameters. The high estimates of genotypic coefficient of variation was recorded for seed yield per plant (27.60), followed by kernel yield q/ha (27.48), pod yield per plant (27.16), pod per plant (25.67) and plant height (25.59). The moderate genotypic coefficient of variation(GCV) value was observed for pod yield (22.43), followed by field emergence (15.12), and low genotypic coefficient of variation (GCV) value was observed for number of primary branches per plant (7.61), seed index (6.91), days to 50% flowering (5.55) sound matured kernel (4.69), kernel uniformity (4.16), shelling% (2.00), days to maturity (1.35) (Table 2).
Similar finding were reported by Venkataramana et al.
(2001). Nath and Alam (2002) Injeti (2008) also resulted low Genotypic co-efficient of variation for days to maturity. Phenotypic coefficient variation (PCV) which measures total relative variation was high for plant height (33.28) followed by kernel yield (30.01), seed yield per plant (30.00), pod yield per plant (29.21), pod per plant (28.09), field emergence (27.95) and pod yield (26.05). The moderate estimate of Phenotypic coefficient of variation value was observed in number of primary/ plant (10.36) and low Phenotypic coefficient variation of observed by seed index (8.09), days to 50% flowering (7.56), kernel uniformity (7.20), sound matured kernel (5.59), shelling % (2.43), days to maturity (1.34), (Table 2) Similar finding were observed for days to maturity by John et al. (2008).
Sr. No.
Characters Mean sum of squares
Replications (d.f. =02)
Treatment d.f =14
Error (d. f.=28)
1. Field emergence 2.222 21.498* 4.817
2. Days to 50% flowering 6.467 9.581* 1.670
3. Plant height 23.533 229.253* 0.837
4. Number of primary branches/plant 0.878 1.299* 0.307
5. Days to maturity 1.143 7.875* 0.527
6. Pods per plant 18.860 95.504* 1.773
7. Pod yield per plant 189.699 1147.025* 1.028
8. Pod yield 3.566 17.187* 1.408
9. Seed yield per plant 55.038 649.562* 0.829
10. Seed index (Hundred kernel weight) 2.803 17.949* 1.224
11. Sound matured Kernels (%) 2.956 34.371* 4.217
12. Kernel Uniformity (%) 44.867 36.486* 14.581
13. Shelling (%) 1.356 6.957* 0.948
International Journal of Emerging Technology and Advanced Engineering
Website: www.ijetae.com (ISSN 2250-2459,ISO 9001:2008 Certified Journal, Volume 4, Issue 7, July 2014)
502
Heritability is a measure of extent of phenotypic caused by the action of gene. For making effective improvement in the character for which selection is practiced, heritability has been adopted by genetic variability, which is transmitted from parent to offspring is reflected heritability.The estimates of heritability in broad sense for 14 quantitative traits ranged from field emergence (29.28%) to seed yield/plant (84.63%).
The higher estimates of heritability were observed for characters like seed yield per plant (84.63%)followed by kernel yield (83.88%), pod per plant (83.55%), days to maturity (82.88%), pod yield per plant (80.31%), pod yield (74.14)%), seed index (72.93%), sound matured kernel (70.44%),and shelling%(67.87%).
Moderate estimates of heritability were observed for characters like plant height (58.74%), number of primary branches (54.05%), field emergence (33.59%), and days to 50% flowering (53.78%) The low estimate of heritability was observed for character like field emergence (29.28%). (Table 2). Similar observations were made by Khote et al.
[image:3.612.37.581.348.646.2](2009), Sumathi et al. (2009). The results are in according with findings of Mahalakshmi et al., (2005) and John et al. (2008) for hundred kernel weight. The high heritability could with high genetic advance has been noticed for pod yield per plant and seed yield per plant indicating that these traits are less influenced by the environment. this is essential for the traits to maintain the desirable confectionery standards when grown under varied environment (Parameshwarappa et al. 2003).
Table 2.
Genetic Parameters of 14 Quantitative characters in 15 Groundnuts Genotypes during kharif season 2013
Characters Mean Range VG VP GCV
(%)
PCV (%)
h2 (%)
GA GG=GA % Min. Max.
Field emergence 74.89 43.33 93.33 128.25 438.10 15.12 27.95 29.28 40.96 54.70 Days to 50% flowering 28.40 26.00 31.67 2.48 4.62 5.55 7.56 53.78 4.20 14.80
Plant height 30.76 19.32 45.39 61.93 105.40 25.59 33.28 58.75 20.09 65.32 Number of primary
branches
7.63 6.27 8.33 0.34 0.62 7.61 10.36 54.05 1.55 20.27
Days to maturity 116.21 114.00 119.33 2.45 2.98 1.35 1.48 82.28 2.92 2.52
Number of pod/plant 21.29 12.80 30.73 29.87 35.76 25.67 28.09 83.55 11.70 54.97
Pod yield per plant 71.83 35.45 117.91 353.45 440.13 26.17 29.21 80.31 41.06 57.16
Pod yield 10.10 5.06 14.20 5.13 6.92 22.43 26.05 74.14 5.15 50.99
Seed yield per plant 51.77 25.57 85.66 204.16 241.24 27.60 30.00 84.63 30.40 58.72
Hundred kernels weight 33.28 29.33 37.23 5.32 7.30 6.91 8.09 72.93 5.29 15.84
Shelling percentage
70.70 67.48 73.19 10.05 14.27 4.69 5.59 70.44 7.39 10.95
Kernel yield 7.27 3.64 12.23 7.30 21.38 4.16 7.20 33.37 9.15 14.10
Sound matured kernels
67.53 62.00 73.00 2.00 2.95 2.00 2.43 67.87 3.36 4.76
Kernel uniformity 64.93 60.00 71.67 3.99 4.75 27.48 30.01 83.88 4.27 58.73
International Journal of Emerging Technology and Advanced Engineering
Website: www.ijetae.com (ISSN 2250-2459,ISO 9001:2008 Certified Journal, Volume 4, Issue 7, July 2014)
503
A perusal of genetic advance for different traits revealed that it varied from 1.55 (number of primary branches) to 41.06 (pod yield per plant). High genetic advance was observed for character like pod yield per plant (41.06), field emergence % (40.96), seed yield/plant (30.40) and plant height (20.09). Moderate genetic advance was observed in pod per plant (11.70). Low genetic advance was observed for character like kernel uniformity (9.15),sound matured kernel(7.39), seed yield per plant (5.29), pod yield (5.15), kernel yield (4.27), days to 50% flowering(4.20),shelling% (3.36), days to maturity (2.92) and number of primary branches (1.55) (Table 2). Similar finding were observed by Rani et al. (2005) for pod yield and shelling percentage. Genetic advance as percent of mean for various characters are presented in table and noticed that Moderate estimates of genetic advance as percent of mean was observed for plant height (65.32), kernel yield (58.73), seed yield per plant (58.72), pod yield/plant (57.16), pod per plant (54.97), field emergence % (54.70),and pod yield (50.99). The low estimate of genetic advance as percent of mean was observed for character like number of primary branches/plant (20.27), seed index (15.84), days to 50% flowering (14.80), kernel uniformity(14.10), sound matured kernels (10.95), shelling% (4.76), days to maturity (2.52). (Table 2). Similar finding were reported by Saraswathi et al. (2010). High heritability coupled with high genetic advance as percent of mean in the groundnut genotypes was recorded for kernel yield indicating predominance of additive gene effect and the possibilities of effective selection for improvement programme. High heritability and moderate genetic advance as percentage of mean were observed for seed index & sound matured kernel. The highly heritable character with high genetic advance as percent of mean could be further improved through individual plant selection (John et al. 2013) andVenkataramna (2001).
IV. CONCLUSION
The genotype ICG 8567 identified as best genotype for pod yield kernel yield, seed yield per plant and pod yield per plant, seed yield per plant, seed index, seed yield per plant recorded high estimates of genotypic coefficient of variation, plant height recorded high estimates of phenotypic coefficient of variation. Highest heritability was recorded for field emergence (%). High estimates of genetic advance as percent of mean for plant height. So these genotypes were used as a parent for future hybridization programme.
Acknowledgements
Authors are thankful to International Crop Research Institute for Semi Arid Tropics, (Patancheru), Hyderabad, (A.P.) India, for providing accessions of groundnut and all the members of the Department of Genetics and Plant Breeding for their encouragement and support for providing necessary facilities.
REFERENCES
[1] Ahmed, E.H. and Young, C.T. (1982). Composition nutrition and flavors of peanut. Peanut Science and Technology 655–688 [2] Anonymous (2012).Coverage and Production of Groundnut in India,
International Crop Research Institute for Semi Arid Tropics (Patancheru) Hyderabad.
[3] Burton, F.W. (1952).Quantitative inheritance of grasses. Proc. 6thIntstitute. Grassland congress, 1:277-283.
[4] Burton, G. W. and Devane E.W. (1953).Estimating heritability, GCV and PCV in tall Fescue from replicated clonal material, Journal of Agronomy, 45:171-181.
[5] Injeti, S. K., Venkataravana, P. and Rao, M. R. G. (2008).
Evaluation of new germplasm and advanced breeding lines of groundnut (Arachis hypogea L.) under late kharif situation, Legume Research, 31 (4): 254-258.
[6] John, K., Vasanthi, R. P., Venkateswarlu, O., Muralikrishna, T. and Naidu, P. H. (2008). Genetic analysis and regression studies for yield and yield attributes in F2 segregating populations of groundnut crosses, Legume Research, 31 (1): 26-30.
[7] Johnson, R. E., Robison, H. W. and Comstack, H. F. (1955).
Estimates of Genetic and environmental variability in rice, Journal of Agronomy. 47:314-318.
[8] Khote, A.C., Bendle, V.W., Bhave, S.G. and Patil, P.P (2009).
Genetic variability, heritability and genetic advance in some exotic genotype of groundnut (Arachis hypogea L.) Crop Research, 37(1, 2 & 3) 186-191.
[9] Korat, V. P., Pithia, M. S., Savaliya, J. J., Pansuriya, A. G. and Sodavadiya, P.R. (2009). Studies on Genetic variability in different genotypes of Groundnut (Arachs hypogea L.) Legume Research, 32
(3): 224-226.
[10] Krapovickas, A. and Gregory, W.C. (1994). Map in diploid peanut Arachis (leguminosae)
[11] Lush. J. L. (1949). Intensive correlation and regression of characters proceeding of American Society of Production, 33: 293-310. [12] Mahalakshmi, P.,Manivannan, N. and Muralidharan, V.
(2005).Variability and correlation studies in groundnut (Arachis hypogea L.), Legume Research, 28: 3, 194-197.
[13] Maurya Mukesh Kumar, Prashant Kumar Rai, Arvind Kumar and Bazil A. Singh, A. K. Chaurasia (2014). Study on Genetic Variability and Seed Quality of Groundnut (Arachis hypogaea L.) Genotypes, International Journal of Emerging Technology and Advanced Engineering Volume 4, Issue 6 Pg 818-823.
[14] Nath, U.K. and Alam, M.S. (2002). Genetic variability, heritability and genetic advance of yield and related traits of Groundnut (Arachis hypogea L.) Journal of Biological Science, 2(11):762-764.
International Journal of Emerging Technology and Advanced Engineering
Website: www.ijetae.com (ISSN 2250-2459,ISO 9001:2008 Certified Journal, Volume 4, Issue 7, July 2014)
504
[16] Parameshwarappa, K.G., Kenchanagoudar, P.V., Bentur, M.G.and Patil, R.K. (2005). Genetic variability and correlation in adopted genotypes of Spanish bunch groundnut. National Symposium: Enhancing Productivity of Groundnut for Sustaining Food and National Security, NRCG, Junagadh, Oct. 11-12, 2004, pp. 74-75
[17] Patra, P. S., Sinha, A. C. and Mahesh, S. S. (2011).Yield, nutrient uptake and quality of groundnut(Arachis hypogaea L.) kernels as affected by organic sources of nutrient. Indian Journal of Agronomy
56(3): 237-241.
[18] Rani, K. S. K.,Parameshwarappa K. G. and Bentur, M. G. (2005). Genetic variability and character association in large seeded groundnut genotypes, Journal of Agricultural Sciences, 18 (2) 329-333.
[19] Saraswathi, M., Venkateswarlu, O., Sekhar, M. R. and Sudhakar, P. (2010). Studies on variability, heritability and genetic advance in Groundnut (Arachis hypogaea L.) Research on Crop, 11
(2): 471-475.
[20] Savaliya, J. J., Pansuriya, A.G., Sodavadiya, P. R. and Leva, R.L. (2009). Evaluation of inter and intra specific hybrid derivatives of Groundnut (Arachis hypogea L.) For yield and its components. Legume Research, 32 (2): 129-132.
[21] Shukla A. K. and Rai P. K. (2014) Evaluation of Groundnut Genotypes for Yield and Quality Traits. Annals of Plant and Soil Research 16(1): 41-44.
[22] Singh S., Kumar A., Tiwari V, Maurya M. K., Chaurasia, A. K. and Rai, P. K. (2013). Study on the performance of groundnut (Arachis hypogaea L.) accessions for seed yield and quality parameters for north east plain zone of Uttar Pradesh. Progressive Research 8 (2) : 237-240. species. Theory and Applied Genetics, 87: 379-384.
[23] Sumathi, P., Amalabalu, P. and Muralidharan, V. (2009).
Genetic variability for pod characters in large seeded genotypes of groundnut (Arachis hypogea L.) Advance in Plant Sciences, 22 (1): 281-283.