203
Emission Reduction in MSW
Management Using Composting
Shiau Hewi Beh, Agamuthu P., University of Malaya, Malaysia
CONTACT
Shiau Hewi Beh
A307, Solid & Hazardous Waste Lab, Institute of Graduate Studies (IGS), University of Malaya,
50603 Kuala Lumpur, Malaysia. Tel: 6012-2335950 Fax: 603-62611898 Email: [email protected] EXECUTIVE SUMMARY
Eighteen percent of global anthropogenic methane emission is contributed by waste sector. Today, landfilling is the most common municipal solid waste (MSW) management technology. Due to the worsening global warming, MSW management is switching to more environmental friendly options such as energy recovery from landfill gas and composting.
This paper presents an estimation of emissions reduction from MSW management using composting compared to landfilling. MSW samples were taken from residential and commercial areas in Selayang and Rawang. The samples were then sorted into categories by material types. ‘Baseline’ is the scenario where the collected MSW was originally disposed off at the Bukit Tagar Sanitary Landfill. In order to prevent greenhouse gas (GHG) released into the atmosphere, a composting plant is proposed as an alternative to convert the organic materials into compost, which is the ‘project activity’. Emissions from baseline and project activity were calculated and compared based on methodology ASM III-F under Clean Development Mechanism (CDM), United Nation Framework Convention on Climate Change (UNFCCC). Differences in the emissions between baseline and project activity is taken as the emission reduction. Emissions from baseline and project activity will be 8,058.97 tCO2e and 132.18 tCO2e
(for 10 years), respectively. Composting as an alternative will generate an emission reduction of 7,926.79 tCO2e, equivalent to 98% of methane being prevented.
INTRODUCTION
204
Currently, landfilling is the most common waste management method in Malaysia as 95% of total MSW generated are disposed off at the landfills (Fauziah & Agamuthu, 2009). There are 301 disposal sites in the country, where 260 are operating landfills and 41 closed (Fauziah, 2010). Waste reduction and waste separation are seldom practiced in the country as the recycling rate is relatively low, at only 5% (Agamuthu et al., 2004; Chenayah et al., 2007; Mohd Osman et al., 2009). Besides that, composting rate in Malaysia is relatively low too, at only 1% (Agamuthu et al., 2006).
Since landfilling is the main international waste management option, landfills are identified as the main source of GHG (Lou & Nair, 2009). More than 45% of the landfill gas (LFG) is methane (EPA, 2007). Under the Kyoto Protocol, Clean Development Mechanism (CDM) is one of the mechanisms designed to the Annex I countries (industrialized and developed countries) to reduce carbon equivalent emissions of GHG by 5.2% of their 1990 levels (Seema & Anju, 2010). This study compares GHG emissions from landfilling and composting. GHG emissions at landfill are due to anaerobic degradation of MSW, while throughout the whole composting process, GHG emissions are caused by the transportation of MSW and compost for sale, machines involved in the process and methane emissions during anaerobic composting process. The objective of this paper is to estimate how much GHG emissions can be reduced by converting organic fraction MSW into compost instead of disposed off at landfill by comparing respective GHG emissions from landfilling and composting.
EXPERIMENTAL METHODS AND MATERIAL
Data collection
MSW samples were taken from Rawang and Selayang by using garbage trucks. Approximately 2.5 tonnes to 6.0 tonnes of MSW were collected daily. Each truck was unloaded and divided into eight (8) portions. Two (2) portions were selected randomly for sampling. The waste was separated manually base on the waste categories stated in the CDM methodology under UNFCCC, called AMS III-F: Avoidance of methane emissions through controlled biological treatment of biomass (Version 08, Scope 13) (thereafter known as AMS III-F) as below:
i. Wood and wood products
ii. Pulp, paper and cardboard (other than sludge)
iii. Food, food waste, beverages and tobacco (other than sludge) iv. Textiles
v. Garden, yard and park waste, and
vi. Inerts (such as glass, plastic, metal and rubber)
Baseline emissions
The baseline emissions from the landfill, BEy were determined using the following Equation (1) based on paragraph 17 of AMS III-F:
BEy = BECH4,SWDS,y – (MDy,reg * GWPCH4) + (MEPy,ww * GWPCH4) + BECH4,manure,y (1)
Where:
BECH4,SWDS,y Yearly methane generation potential of the solid waste composted or
205
beginning of the project activity (x = 1) up to the year y estimated as per latest
version of the “tool to determine methane emissions avoided from disposal of waste at a solid waste disposal site” (tCO2e)
MDy,reg Amount of methane that would have to be captured and combusted in the year
y to comply with the prevailing regulations (tonne)
MEPy,ww Methane emission potential in the year y of the wastewater co-composted. The
value of this term is zero if co-composting of wastewater is not included in the project activity (tonne)
BECH4,manure,y Where applicable, baseline emissions from manure composted by the project
activities, as per the procedures of AMS-III.D
GWPCH4 Global Warming Potential for methane (value 21 is used)
BECH4,SWDS,y is calculated based on multi-phase model in the “Tool to determine methane
emissions avoided from disposal of waste at a solid waste disposal site (Version 05)” using the following Equantion (2):
BECH4,SWDS,y = φ * (1-f) * GWPCH4 * (1-OX) * 16/12 * F * DOCf * MCF * ∑∑ Wj,x
* DOCj * e – kj * (y-x) * (1-e – kj) (2)
Where:
Φ Model correction factor to account for model uncertainties
f Fraction of methane captured at the solid waste disposal site (SWDS) and flared, combusted or used in another manner
GWPCH4 Global Warming Potential (GWP) of methane, valid for the relevant commitment
period (value 21 is used)
OX Oxidation factor (reflecting the amount of methane from SWDS that is oxidized in the soil or other material covering the waste)
16/12 Stoichiometric ratio of carbon to methane
F Fraction of methane at the SWDS gas (volume fraction)
DOCf Fraction of degradable organic carbon (DOC) that can decompose
MCF Methane correction factor
Wj,x Amount of organic waste type j prevented from disposal in the SWDS in the year x
(tonnes)
DOCj Fraction of degradable organic carbon (by weight) in the waste type j
kj Decay rate for the waste type j
j Waste type category (index)
x Year during the crediting period: x runs from the first year of the first crediting period (x=1) to the year y for which avoided emissions are calculated(x=y)
y Year for which methane emissions are calculated
Project emissions
The project emissions from composting activities, PEy were determined by using the Equation
(3) based on paragraph 20 of AMS III-F:
PEy = PEy, transp + PEpower + PEy, phy leakage + PEy, comp + PEy, runoff + PEy, res waste (3)
Where:
PEy,transp Emissions from incremental of transport in the year y (tCO2e)
206
PEy,power Emissions from electricity or fossil fuel consumption in the year y (tCO2e)
PEy,phy leage In case of anaerobic digestion: methane emissions from physical leakage of the
anaerobic digester in the year y (tCO2e)
PEy,comp In case of composting: methane emissions during composting process in the
year y (tCO2e)
PEy,runoff In case of composting: methane emissions from runoff in the year y (tCO2e)
PEy,res waste In the case of residual waste/ slurry/ products are subjected to anaerobic
storage or disposed in a landfill: methane emissions from the anaerobic decay of the residual waste/ products (tCO2e)
PEy,transp = (Qy / CTy) * DAFw * EFCO2 + (Qy,treatment,i / CT y,treatment,i) * DAF treatment,i* EFCO2 (4)
Where:
Qy Quantity of waste composted in the year y (tonnes)
CTy Average truck capacity for waste transportation (tonnes/truck)
DAFw Average incremental distance for waste transportation (km/truck)
EFCO2 CO2 emission factor from fuel use due to transportation (kgCO2/km, IPCC default
values or local values may be used) i Type of compost
Qy, treatment,i Quantity of compost i produced in the year y (tonnes)
CT y, treatment,i Average truck capacity for compost i transportation (tonnes/truck)
DAF treatment,i Average distance for compost i transportation (km/truck)
PEy,power = PEy, diesel on-site + PEy,electricity (5)
Where:
PEy,diesel on-site Emissions through fossil fuel consumption on-site in the year y (tCO2e)
PEy,electricity Emissions through electricity consumption in the year y (tCO2e)
Electricity consumption is very minimum and its emisisons are insignificant. Hence, PEy,electricity =
0
Physical leakage happens in case of anaerobic digestion. However, this project activity is solely involves a composting plant. Hence, PEy,phy leage = 0.
PEy,comp = Qy * EF composting * GWPCH4 (6)
Where:
EF composting Emission factor for composting of waste (t CH4/tonne waste treated). Emission
factors can be based on facility/site-specific measurements,country specific values or IPCC default values (Table 4.1, Chapter 4, Volume 5, 2006 IPCC Guidelines for National Greenhouse Gas Inventories). IPCC default values are 10g CH4/kg waste treated on a dry weight basis and 4g CH4/kg waste treated on
a wet weight basis.
The composting plant is roofed and with concrete flooring. Thus the collected runoff is 100% from the composting process and it will be recycled onto the windrows. Hence, PEy,runoff = 0.
207 Emission reduction
Emission reduction were determined by using the Equation (7):
ERy = BEy – (PEy + LEy) (7)
Where:
LEy Leakage emissions in the year y (tCO2e)
Leakages happen when project equipment is transferred from another activity or if the existing equipment is transferred to another activity project. The project activity does not involve both of the aspects. Hence leakage = 0. Equation (8) becomes:
ERy = BEy - PEy
RESULTS AND DISCUSSION
Baseline emissions
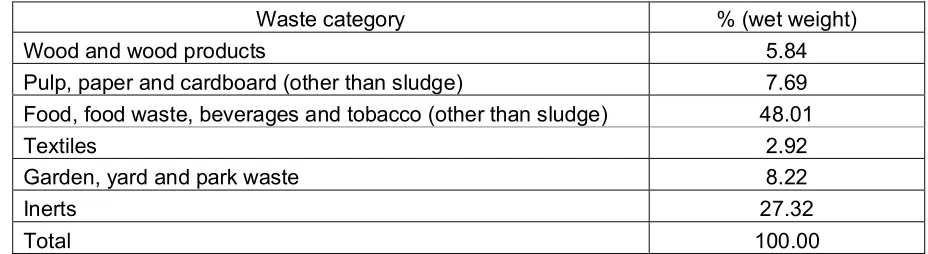
[image:5.595.63.527.432.559.2]As shown in Table 1, food, food waste, beverages and tobacco (other than sludge) took up almost half of the total compositon (48.01%), followed by inerts such as rubber, metal and plastic (27.32%) and garden, yard and park waste (8.22%). However, inerts are not accounted for emissions in this case as they are inorganic materials.
Table 1. MSW compositions
Waste category % (wet weight) Wood and wood products 5.84 Pulp, paper and cardboard (other than sludge) 7.69 Food, food waste, beverages and tobacco (other than sludge) 48.01
Textiles 2.92 Garden, yard and park waste 8.22
Inerts 27.32
Total 100.00 Table 2 shows emissions of each waste category in 10 years. Emissions from food, food waste,
beverages and tobacco (other than sludge) will be far ahead other types of waste category, 5,516.90 tCO2e. Second contributor is pulp, paper and cardboard (other than sludge) (966.27
tCO2e) followed by garden, yard and park waste (916.14 tCO2e) at the third place. Baseline
emissions will increase year by year and reach a total baseline emissions of 8,058.97 tCO2e.
Project emissions
Project emissions are the sum of emissions from transport, diesel on-site consumption and anaerobic condition during composting process. Project emissions will be 132.18 tCO2e (Table
208
Table 2. Emissions of each waste category
Year Emissions of each waste category (tCO2e) Total
A B C D E
2010 6.92 16.89 192.12 3.86 20.73 240.52 2011 15.44 36.98 356.64 8.46 43.04 460.56 2012 23.83 56.13 469.34 12.83 62.27 624.4 2013 32.10 74.35 545.95 16.97 78.80 748.17 2014 40.25 91.77 598.06 20.95 93.05 844.08 2015 48.28 108.15 635.26 24.67 105.29 921.65 2016 56.18 123.91 659.65 28.26 115.84 983.84 2017 63.96 138.78 676.23 31.63 124.92 1,035.52 2018 71.61 152.94 687.51 36.39 132.73 1,081.18 2019 79.16 166.37 696.14 37.91 139.47 1,119.05 Total 437.73 966.27 5,516.90 221.93 916.14 8,058.97 Note) A: Wood and wood products, B: Pulp, paper and cardboard (other than sludge), C: Food, food waste, beverages, tobacco (other than sludge), D: Textiles, E: Garden, yard and park waste
Table 3. Project emissions Year PEy, transp
(tCO2e)
PEy,diesel,on-site
(tCO2e)
PEy,comp
(tCO2e)
Project emissions (tCO2e)
2010 8.87 1.27 1.66 x 10⁻⁴ 10.14
2011 11.34 1.27 2.12 x 10⁻⁴ 12.61
2012 11.57 1.27 2.16 x 10⁻⁴ 12.84
2013 11.80 1.27 2.20 x 10⁻⁴ 13.07
2014 12.03 1.27 2.25 x 10⁻⁴ 13.30
2015 12.28 1.27 2.29 x 10⁻⁴ 13.55
2016 12.52 1.27 2.34 x 10⁻⁴ 13.79
2017 12.77 1.27 2.38 x 10⁻⁴ 14.04
2018 13.02 1.27 2.43 x 10⁻⁴ 14.29
2019 13.28 1.27 2.48 x 10⁻⁴ 14.55 Total 119.48 12.70 2.23 x 10⁻³ 132.18
Emission reduction
Emission reduction is the emissions difference between baseline and project activity. By converting organic waste into compost, 7,926.79 tCO2e emissions will be able to be prevented
from being emitted to the atmosphere (Table 4).
209
From this study, composting proved to be able to reduce emissions generated from MSW. Baseline emissions generated from MSW disposed off at Bukit Tagar Sanitary Landfill will be 8,058.97 tCO2e in 10 years. By converting the MSW into compost, methane emissions being
released into the atmosphere can be reduced to 132.18 tCO2e, generating emission reduction
of 7,926.79 tCO2e.
Table 4. Emission reduction
Year Estimation of baseline emissions
(tCO2e)
Estimation of project emissions
(tCO2e)
Estimation of leakage
(tCO2e)
Estimation of emission reduction
(tCO2e)
2010 240.52 10.14 0 230.38 2011 460.56 12.61 0 447.95 2012 624.40 12.84 0 611.56 2013 748.17 13.07 0 735.10 2014 844.08 13.30 0 830.78 2015 921.65 13.55 0 908.10 2016 983.84 13.79 0 970.05 2017 1,035.52 14.04 0 1,021.48
2018 1,081.18 14.29 0 1,066.89 2019 1,119.05 14.55 0 1,104.50
Total 8,058.97 132.18 0 7,926.79
ACKNOWLEDGEMENT
Authors would like to express their sincere gratitude to the operator of Bukit Tagar Sanitary Landfill (KUB-Berjaya Enviro Sdn Bhd) for providing information about the landfill. Special thanks dedicated to University of Malaya for allocating PPP research grant to the authors.
REFERENCES
Agamuthu, P., Fauziah, S. H., & Kahlil, K. (2009). Evolution of solid waste management in Malaysia: impacts and implications of the solid waste bill, 2007. Journal of Material Cycles and Waste Management, 11(2).
Agamuthu, P., Fauziah, S., Noorazamimah Aiza, A., & Suhaila, M. (2006). Recycling of municipal solid waste: is it sustainable? . Paper presented at the The Green Chemistry
Conference, Malaysian Institute of Chemistry.
Agamuthu, P., Fauziah, S. H., & Lingesveeramani, M. (2004). Evolution of MSW and its management in Malaysia - An overview. Paper presented in the World Congress ISWA 2004, 17-21 October 2004, Rome, Italy.
210
Environmental Protection Administration. (2007). Definition of terms in environmental statistics. Retrieved 20 December 2010, from http://www.epa.gov.tw/b/b0100.asp?Ct Code= 03X0000129X0002328
Fauziah, S. H., & Agamuthu, P. (2009). Recycling of household organic waste in Malaysia: The challenges. Progress in Environment Science and Technology. Vol II. Part B: 2234-2240.
Science Press.
Lou, X. F., & Nair, J. (2009). The impact of landfilling and composting on greenhouse gas emissions - A review. Bioresource Technology, 100(16), 3792-3798.
Mohamed Osman, S., Mohd Nasir, H., & M. Abdul Mujeebu. (2009). Assessment of municipal solid waste generation and recyclable materials potential in Kuala Lumpur, Malaysia.
Waste Management, 29, 2209–2213.