comm
en
t
re
v
ie
w
s
re
ports
de
p
o
si
te
d r
e
sea
rch
refer
e
e
d
re
sear
ch
interacti
o
ns
inf
ormation
Microarray-based resequencing of multiple Bacillus anthracis
isolates
Michael E Zwick
*†
, Farrell Mcafee
*
, David J Cutler
‡
, Timothy D Read
*
,
Jacques Ravel
§
, Gregory R Bowman
*
, Darrell R Galloway
*
and
Alfred Mateczun
*
Addresses: *Biological Defense Research Directorate, Naval Medical Research Center, 503 Robert Grant Avenue, Silver Spring, MD 20910,
USA. †Department of Human Genetics, Emory University School of Medicine, Atlanta, GA 30322, USA. ‡McKusick-Nathans Institute of Genetic
Medicine, Johns Hopkins University School of Medicine, 733 North Broadway, Baltimore, MD 21205, USA. §The Institute for Genomic
Research, 9712 Medical Center Drive, Rockville, MD 20850, USA.
Correspondence: Michael E Zwick. E-mail: [email protected]
© 2004 Zwick et al.; licensee BioMed Central Ltd.
This is an Open Access article distributed under the terms of the Creative Commons Attribution License (http://creativecommons.org/licenses/by/2.0), which permits unrestricted use, distribution, and reproduction in any medium, provided the original work is properly cited.
Resequencing of multiple Bacillus isolates
<p>Custom-designed resequencing arrays were used to generate 3.1 Mb of genomic sequence from a panel of 56 <it>Bacillus anthracis </ it>strains. Sequence quality was shown to be very high by replication and by comparison to independently generated shotgun sequence</ p>
Abstract
We used custom-designed resequencing arrays to generate 3.1 Mb of genomic sequence from a panel of 56 Bacillus anthracis strains. Sequence quality was shown to be very high by replication (discrepancy rate of 7.4 × 10⁻⁷) and by comparison to independently generated shotgun sequence
(discrepancy rate < 2.5 × 10⁻⁶). Population genomics studies of microbial pathogens using rapid
resequencing technologies such as resequencing arrays are critical for recognizing newly emerging or genetically engineered strains.
Background
Population genomics, the study of genome-wide patterns of genetic variation in a large number of organisms, is emerging as a vigorous new field of study [1-3]. Rapid, accurate and inexpensive resequencing could enable a variety of potential applications and studies. For the biowarfare (BW) pathogen,
Bacillus anthracis, genomic sequences from multiple strains and non-pathogenic close relatives could aid studies that definitively identify B. anthracis in environmental and clini-cal samples, determine forensic attribution and phylogenetic relationships of strains, and uncover the genetic basis of phe-notypic variation in traits such as mammalian virulence. Moreover, first recognizing the presence of a novel pathogen, and then attempting the difficult task of discerning between novel naturally occurring pathogenic organisms (for instance
Bacillus cereus G9241 [4]) and artificially enhanced bacterial pathogens, requires a thorough knowledge of extant patterns
and levels of genetic variation in natural populations. Unu-sual patterns of genetic variation may serve as evidence aid-ing the detection of these unusual types of pathogens.
The current technological model for genome sequencing employs high-throughput shotgun sequencing at large cent-ers. This highly successful enterprise has completed about 200 bacterial genomes with more than 500 ongoing as of July
2004 [5]. The genome sequences of the B. anthracis Ames
chromosome (5.2 Mb, NC_003997) and plasmids pXO1 (181.6 kilobases (kb), NC_001496) and pXO2 (96.2 kb, NC_002146) have been determined [6-8], as have the genomes of three near neighbors, B. cereus ATCC 14579 [9],
B. cereus ATCC 10987 [10] and B. cereus G9241 [4]. A strain of B. anthracis Ames strain isolated from a victim of the autumn 2001 bioterror attack in Florida was also sequenced to a high level of coverage using the random shotgun method Published: 17 December 2004
Genome Biology 2004, 6:R10
Received: 26 July 2004 Revised: 18 October 2004 Accepted: 19 November 2004 The electronic version of this article is the complete one and can be
and compared to the Ames sequence to identify 60 new mark-ers that included single nucleotide polymorphisms (SNPs), inserted or deleted sequences, and tandem repeats [11]. The success of this effort has led to an extensive phylogeny-based
whole-genome shotgun resequencing effort in B. anthracis
(reported by [12]). Whole-genome shotgun studies are increasingly being used to explore variation among more closely related bacterial strains [13-15]. However, the rela-tively high costs of these efforts have limited the extent of their application.
Numerous molecular methods for genotyping B. anthracis
and near neighbors of the Bacillus cereus sensu lato group [16] have been developed and successfully employed in a wide variety of studies. These include DNA sequence surveys from one or a few number of loci [17-21], repetitive element morphism-PCR [22,23] and amplified fragment length poly-morphisms (AFLP) [24-27]. However, because of the relative paucity of genetic variation between isolates [28], the most
effective method for subtyping B. anthracis has employed
multiple locus variable number of tandem repeats analysis (MLVA) [29-31]. Similar to the mammalian short tandem repeat methodology, MLVA determines strain phylogenetic relationships based on a relatively few, highly variable genomic repeat regions. While being relatively rapid and inexpensive, a key limitiation of MLVA lies in its exclusive focus on loci with common alleles that are differentiated by size. Because of the relatively rapid mutational process gener-ating variation at these loci, similarly sized markers may have different evolutionary origins.
Clearly, a method for rapid, inexpensive genome resequenc-ing of bacterial strains would be of great benefit for genotyp-ing, forensics and studies of the genetic basis of strain phenotypic variation. Developing DNA-based biodetection assays depends upon prior knowledge of patterns of genetic variation within and between bacterial species. It would be ideal to enable technologies that could combine the high information content of whole-genome resequencing of strains while also being rapid and inexpensive like MLVA, AFLP and multi-locus sequence typing (MLST). Further-more, while conventional strain typing methodologies have focused on the utility of common variants, rare variants may prove to be especially informative for forensic applications.
High-density oligonucleotide resequencing microarrays are a highly parallel technology that can enable the rapid identifi-cation of DNA sequence variants with minimal laboratory effort and infrastructure [32,33]. Previous applications of microarrays on bacterial genomes [34,35] or small eukaryotic genomes like yeast [36,37], focused on methods that scanned specific genes or a genomic region for genetic variants. Initial high-throughput microarray applications in the human genome for SNP discovery [38-40] were successful, but also reported that between 12% and 45% of the detected variants were false. Subsequent experimental improvements and the
development of the ABACUS algorithm/software package [32] significantly reduced SNP false-positive ascertainment, radically improved genotype calling and automatically assigned quality scores to each genotype call. These funda-mental advances enabled rapid resequencing of 40 human genomic regions [32,41] and ABACUS is now the standard application for microarray-based resequencing.
Here we present the first microarray-based high-throughput resequencing of a large collection of B. anthracis isolates. Our study first reaffirms, and then directly demonstrates that the quality of microarray-generated DNA sequence data is directly comparable to that produced by conventional shot-gun sequencing. We then estimate the levels of genetic varia-tion in the annotated genomic regions we resequenced, characterize the frequency spectrum of DNA sequence vari-ants we observe, and finally explore patterns of linkage dise-quilibrium and recombination among those variants. Because of the scalability and minimal effort associated with microar-ray-based resequencing, our work demonstrates the possibil-ity of a rapid and cost-effective method of genome resequencing that could be applied to both environmental, and ultimately clinical specimens.
Results
Resequencing B. anthracis with microarrays
A panel of 56 B. anthracis strains from the Biological Defense Research Directorate's strain collection (see Additional data file 1) was resequenced using Affymetrix resequencing arrays (RAs) and base calls determined using the ABACUS software package [32]. Each RA was capable of resequencing 29,212
base-pairs (bp) or about 0.5% of the B. anthracis genome
from a single isolate sample (see Additional data file 2). Long PCR sample preparation and chip processing was conducted for 118 RAs. Analysis of these 118 RAs with the ABACUS soft-ware package shows that 115 are successful (97.5%). Experi-mental failure occurs when less than 60% of the total possible bases fail to achieve quality scores exceeding the ABACUS user-defined threshold. For this study, the total threshold was set at 31 and a strand minimum of -2 [32], as determined from analysis of a replication experiment described below.
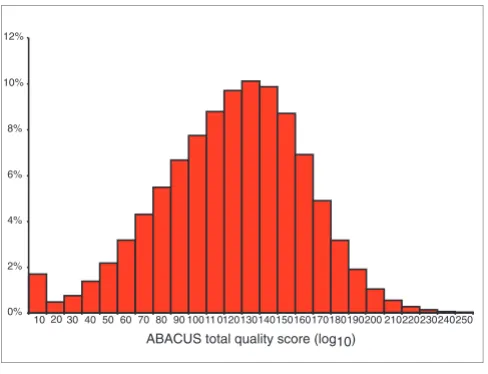
The 115 successful RAs call 92.6% of the possible bases (3,109,539 bp out of a total possible of 3,359,380 bp). Figure 1 shows the distribution of quality scores across all 3,359,380 base calls. Amplicon failure, typically arising from long PCR (LPCR) failure, accounts for 1.1% of the uncalled bases. The remaining base-calling failure (6.3%) consists of features on the RAs that fail to generate quality scores exceeding the experimental threshold.
comm
en
t
re
v
ie
w
s
re
ports
refer
e
e
d
re
sear
ch
de
p
o
si
te
d r
e
se
a
rch
interacti
o
ns
inf
o
rmation
multiple RAs. Guanine-rich probes, in particular, showed the greatest reduction in hybridization intensity (see Figure 6 in [32]). Consequently, total quality scores at these sites fre-quently failed to exceed the quality-score threshold and they remained uncalled. To determine if probe sequence composi-tion, specifically purine and guanine content, contributed to the 6.3% of bases not called, the sequence composition of the purine-rich oligonucleotide probes at 4,209 sites successfully called on all 115 RAs (484,035 total sites) was compared to that at the 886 sites that failed to be called on any RA (101,890 total sites). These failed sites account for 3.0% of the total base calling failure in the experiment. Uncalled sites are composed of oligonucleotide probes with a significantly higher purine composition (P < 10-22). A similar pattern is
detected if we limit our analysis to guanine-rich probes (P < 10-9). This latter result is surprising given that the B.
anthra-cis genomic sequences we examined have a low G+C content
(~34%). Nevertheless, these analyses demonstrate that both purine-rich and guanine-rich oligonucleotide probes are sig-nificantly more likely to fail to generate quality scores exceed-ing the experimental threshold.
Assessing microarray resequencing data quality
Building on the recognition of the importance of automated algorithms to assess data quality [42,43], we used two meth-ods to assess the quality of microarray resequencing data [32]. The first consisted of a replicate experiment where 51 samples were independently hybridized on 102 RAs. A parameter search that optimized the percentage of called bases, while minimizing the number of discrepancies between replicates was then performed. A total of 1,489,812 bases could have been called in each replicate experiment. At the optimal parameter values (total threshold of 31, strand
minimum of -2 see Cutler et al. [32]), 90.6% (1,349,178) of sites are called in both replicates. Other parameter values provide similar levels of base calling and discrepancy rates. The optimal parameter values are similar to those previously used by Cutler et al. [32]. Of the bases called in both repli-cates, 1,349,177 are called identically. Only one site is called differently. This corresponds to a replication discrepancy rate of 7.4 × 10⁻⁷ (Table 1). If repeatability could be related to
accu-racy, then this level of repeatability would correspond to a phred score of at least 61 [42,43]. This calculation assumes that the discrepancy rate corresponds to a binomial error probability of P, where phred = -10 log10P. These replication levels and discrepancy rates are consistent with those previ-ously reported [32], providing further evidence for the ability of RAs analyzed with ABACUS to produce highly replicable data.
While RA data is highly replicable, repeated systematic errors would not be detected in a replicate experiment. To obtain an independent estimate of RA sequence accuracy, we compared
the sequence data from 30 RAs where the same B. anthracis
strain had been sequenced using the random shotgun
approach and deposited in GenBank (B. anthracis: strain
Ames, NC_003997 [8], Vollum, NZ_AAEP00000000, 4 June 2004 update, strain Australia 94, NZ_AAES00000000, 7 June 2004 update, strain Kruger B NZ_AAEQ00000000, 7 June 2004 update (J Ravel, DA Rasko, MF Shumway, L Jiang, RZ Cer, NB Federova, M Wilson, S Stanley, S Decker,
TD Read, et al., unpublished work). In a comparison of
398,467 bp of RA- and shotgun-generated sequence, we observed 15 discrepancies occurring at six sites. This corre-sponds to a discrepancy rate of 3.8 × 10⁻⁵. If we make the
con-servative assumption that all discrepancies lie in the RA-generated sequence, this level of accuracy would correspond to a phred score of at least 44.
ABACUS quality scores for base calls in B. anthracis Figure 1
ABACUS quality scores for base calls in B. anthracis. A quality score measures the difference, in log10 units, between the likelihood support level for the best base-call model minus that for the second-best model [32]. Of the bases, 92.6% possess quality scores that exceeded the threshold (31) used for this study.
30 40 50 60 70 80 90 10011 0120130140150160170180190200 210220230240250 0%
2% 4% 6% 8% 10% 12%
ABACUS total quality score (log10)
[image:3.612.54.298.85.272.2]10 20
Table 1
Assessing microarray resequencing data quality
Replication experiment
Total number of bases called in replicate 1 1,383,229
Total number of bases called in replicate 2 1,373,905 Total number of bases called in both replicates 1,349,177
Total number of bases called differently 1
Replication experiment discrepancy rate 7.4E-07
Accuracy estimation experiment
Total number of bases called identically 398,452 Total number of bases called differently 15
To determine if this conservative assumption is warranted, we examined in greater detail the nature of the RA/shotgun sequence discrepancies. Five of the discrepant sites, account-ing for 10 discrepancies total (twofold RA replication at each site), were found in Kruger B strain sequences. The one remaining site, accounting for five discrepancies (fivefold RA replication at this site), was found in Vollum strain sequences. At all 15 discrepancies, the RA called a base iden-tical to the Ames reference sequence [8], while the Kruger B/ Vollum shotgun sequence called a new SNP. The fact that the shotgun sequence called a SNP at every discrepancy was sur-prising, leading us to examine more closely the level of shot-gun coverage and assembly at each discrepant site. A comparison of the latest shotgun assembly of the Kruger B strain (J Ravel, et al., unpublished work) with the RA Kruger B strain base calls agreed with the RA base calls. The latest Vollum shotgun assembly (J Ravel, et al., unpublished work) still disagreed at the one site (five discrepancies total), but this discrepancy was based on a single shotgun sequencing read with a phred score of 7 at the discrepant base. Clearly, the shotgun coverage lacks sufficient depth at this site to make a reliable base call and it seems far more likely that the fivefold RA base call is correct. Hence, the RA sequence data has less than one discrepancy per 398,467 bases called, or a discrepancy rate of < 2.5 × 10⁻⁶ (Table 1). This observed level
of sequencing accuracy corresponds to a phred score of 56. These data demonstrate that our conservative assumption is not warranted. Resequencing array data quality from a single experiment matches, and in some cases perhaps exceeds, that obtained by multiple DNA sequencing reads using conven-tional DNA sequencing technologies [42,43].
Patterns and levels of genetic variation in B. anthracis We identify 37 SNPs among 56 B. anthracis strains. The SNP location, base-call, and position relative to the respective GenBank reference sequences [6-8] are contained in Addi-tional data file 3. Twenty-four of the 37 SNPs, including two singletons, were independently confirmed in identical strains where whole-genome random shotgun sequence was availa-ble (A0039, A4088 and A0442 in Additional data file 1 (J Ravel, et al., unpublished work)). Of the remaining 13 SNPs not independently verified by The Institute of Genomic Research (TIGR), 11 were seen only once in our collection of strains and two SNPs were seen three times.
Population genetic inference typically assumes that study samples are selected without prior knowledge of their pat-terns of genetic variation. For this study, we selected diverse strains from widely distant geographic regions in an attempt to sample the full extent of genetic variation in B. anthracis. The number of SNPs identified, the amount of sequence gen-erated and the nucleotide diversity [44] of the 56 strains is contained in Table 2. We performed analyses for sequences comprising the total dataset, for each genomic region sepa-rately, and for the total dataset with each resequenced base assigned into an annotated SNP class. We report three main
findings. First, the total average level of DNA sequence varia-tion in B. anthracis is very low. This finding is in agreement with previous studies [11,28]. This level of genetic variation is much lower than that seen in commonly studied bacterial species [14], roughly half of that observed in the human
genome and 25-fold lower than that observed in D.
mela-nogaster [38,39,45-48]. Second, the B. anthracis chromo-some appears less variable than either the pXO1 or pXO2 plasmids, although this difference is not statistically signifi-cant. Third, the patterns of genetic variation by SNP class (see Table 2 and Additional data file 4) are similar to that seen in other well studied bacterial [14] and eukaryotic genomes [45]. Silent sites, those sites that when mutated do not alter the protein primary structure, are significantly more variable than are amino acid altering replacement sites (P = 0.0011). Intergenic regions are observed to have intermediate levels of genetic variation, whereas replacement sites, those sites that when mutated alter the protein primary structure, are the least variable. Replacement sites are marginally significantly less variable than intergenic sites (P = 0.039) whereas silent sites are not significantly more variable than intergenic sites (P = 0.22).
The neutral theory of molecular evolution predicts a charac-teristic frequency spectrum of SNPs, or segregating sites, for populations at equilibrium [49]. Deviations from this expected distribution are observed when an experimental population sample contains an excess of low frequency, rare SNPs, or an excess of high frequency, common SNPs, relative to the neutral expectation. These deviations can arise as a consequence of demographic history and/or the action of nat-ural selection [50]. Figure 2 compares the observed and expected percent of SNPs in four allele-frequency classes. The data suggest an observed excess of rare SNPs as compared to that expected under the neutral theory. For example, while the neutral theory predicts that approximately 60% of SNPs should have minor allele frequencies less than or equal to 0.25, we observe that more that 92% of the B. anthracis SNPs we discovered have minor allele frequencies that fall into this class, a statistically significant difference (Figure 2).
comm
en
t
re
v
ie
w
s
re
ports
refer
e
e
d
re
sear
ch
de
p
o
si
te
d r
e
se
a
rch
interacti
o
ns
inf
o
rmation
from the 0.5% resequenced in 56 B. anthracis genomes, we
can estimate a range around the total number of SNPs that
one would detect upon sequencing two random B. anthracis
isolates, sampled in the same fashion as isolates in this study were chosen. Our results indicate that we should expect to find, on average, between 944 (standard deviation (SD) 454) [50] and 1,586 SNPs (SD 762) [44]. A substantial proportion of these SNPs, probably more than expected under the neu-tral theory, would be rare.
Using multiple sequence alignments of 17 genes from B. anthracis (NC_003997, Ames) and B. cereus (NC_004722, ATCC 14579 [9] and NC_003909, ATCC 10987 [10]) the pat-terns of genetic polymorphism and divergence at silent and replacement sites was assessed. The raw counts are presented in Table 3. It is striking that two B. cereus strains exhibit more polymorphism at silent and replacement sites than diver-gence from B. anthracis. This result confirms, at the DNA sequence level, previous results suggesting that the B. cereus
species group is diverse and polyphyletic in origin. B.
anthra-cis then appears to be a clonal lineage derived from, and
[image:5.612.54.556.118.288.2]nested within, a diverse species. In other words, the species names do not encompass or reflect the evolutionary history of the species [10,51,52].
Table 2
Observed genetic variation in B. anthracis
Observed number of SNPs Total amount resequenced (bp) Nucleotide diversity (× 104) ± 2 SEs Tajima's D
Total 37 1,544,913 2.9 ± 1.3 -0.93
Genomic location
Chromosome 18 874,564 2.5 ± 1.4 -0.95
pXO1 9 325,397 3.3 ± 2.4 -0.54
pXO2 10 344,952 3.5 ± 2.5 -0.73
SNP class
Silent 15 243,481 7.5 ± 4.3 -0.55
Replacement 9 898,837 1.2 ± 0.80 -0.64
[image:5.612.53.552.357.423.2]Intergenic 13 402,595 3.8 ± 2.3 -1.09
Table 3
Observed patterns of polymorphism/divergence between B. anthracis (Ames) and B. cereus (ATCC 14579, ATCC 10987)
Silent sites Replacement sites
Polymorphic sites within B. cereus strains 660 136
Divergent sites between B. anthracis and B. cereus 646 125
Polymorphic sites within B. anthracis strains 11 3
B. anthracis SNP frequency spectrum
Figure 2
B. anthracis SNP frequency spectrum. An excess of rare SNPs are observed in our sample. Ninety-two percent of the SNPs that we discovered have a minor allele frequency less than or equal to 0.25. This finding (92%) is significantly different from the neutral theory expectation (60%). This excess can arise as a consequence of rapid, population expansion from a small founder population and/or the action of natural selection.
100% 90% 80% 70% 60% 50% 40% 30% 20% 10% 0%
q ≤ 0.25 0.25 < q 0.5≤ 0.5 < q ≤ 0.75 0.75 < q < 1.0 Observed Expected
[image:5.612.311.554.466.626.2]No evidence for recombination in B. anthracis
chromosome
The 37 SNPs discovered on the B. anthracis chromosome and plasmids pXO1 and pXO2, possess in total, 636 pairs of sites where two alleles are observed. In principle, the alleles at each pair of sites could form four distinct haplotypes. Plasmid transfer between different B. anthracis strains would affect physically unlinked site pairs resulting in four distinct haplo-types. Homologous recombination or gene conversion between physically linked site pairs is also expected to pro-duce all four haplotypes. The straightforward counting of the number of haplotypes that one detects in a large population sample, such as the one used in this study, is often referred to as the four-gamete test [53].
Among the 636 site pairs in our sample, we observe 26 pairs of sites with two haplotypes, 610 pairs of sites with three haplotypes, and no pairs of sites with four haplotypes. This striking result implies that the value of D', the standardized measure of linkage disequilibrium (LD) [54], is equal to 1, its maximum value, for all site pairs that we observe. Among the 137 site pairs where we could have detected statistically sig-nificant LD at P < 10-3, we observe that 52 site pairs exhibit
statistically significant LD. Four of the six site pairs showing significant LD on the B. anthracis main chromosome are over 500 kb apart.
Correlation of RA resequencing data with MLVA typing
Because of the low level of genetic variation in B. anthracis
([28,29] and this study), determining the phylogenetic rela-tionship among B. anthracis strains has proven difficult. Twenty-four B. anthracis strains characterized with a single fluorescent AFLP primer combination were reported to be monomorphic [27]. One recent MLST study sequenced seven
housekeeping genes (approximately 3 kb total) in 5 B.
anthracis strains and reported that the strains were mono-morphic at the sites examined. Another recent MLST study sequenced seven genes (approximately 3 kb total) in 11 diverse B. anthracis strains finding three polymorphic nucle-otides [55]. Neither the AFLP nor the MLST studies discover and genotype sufficient genetic variation to distinguish between B. anthracis strains.
The most successful marker-based approach used to date, MLVA, determined the genotypes at eight VNTR loci in 426 B. anthracis isolates, enabling the construction of a phyloge-netic tree of B. anthracis strains [29]. We sought to determine
if our resequencing of 0.5% of each of 56 B. anthracis
genomes is capable of confirming the major phylogenetic groupings determined by MLVA. To test this, we concate-nated the 37 variant positions for all strains in this study, cal-culated a distance matrix using a simple Kimura substitution model, and generated an Unweighted Pair Group Method Arithmetic Mean (UPGMA) tree (see methods [56]; Figure 3). The strains group together in a manner broadly similar to that
found by Keim et al. [29] with B strains forming an outgroup and most A strains being found together in the same sub-groups (Figure 3). There are exceptions: one group in Figure 3 contains a mix of A3a, A1a, A1b and A2 strains. This anom-aly is probably due to the relatively few SNPs that effectively distinguish these groups when only 0.5% of the genome is sampled. All B. anthracis Ames strains but ASC394 correctly cluster in an A3b group. B. anthracis ASC394 may be a case of an originally mistyped or mislabeled strain. Nevertheless, our data suggest that limited, random resequencing of 0.5%
of the 56 B. anthracis genomes discovers and genotypes
sufficient genetic variation to determine the major phyloge-netic relationships among B. anthracis strains.
Discussion
Population genomics requires the random sampling of genome-wide patterns of DNA sequence variation in a large number of organisms. Such studies require high-throughput, highly accurate, cost-effective resequencing technologies. While the conventional industrial-scale shotgun-sequencing model is clearly the best technology available for de novo gen-eration of genomic sequence, it may not be the best approach for resequencing large numbers of strains. RAs, as originally applied for human genome resequencing [32], offer one com-peting technology that can rapidly produce very high-quality data with limited personnel and infrastructure requirements. Our application of RAs to resequence multiple genomic regions in the biowarfare pathogen, Bacillus anthracis, fur-ther supports this perspective.
Studies of DNA sequence variation are most informative when both rare and common variants are identified. While the limited ascertainment of selected common variants can be employed to identify broad evolutionary relationships among bacterial genomes, and in fact underlies most bacterial strain typing methodologies, the ultimate forensic application of resequencing lies in the ascertainment of rare, presumably newly arising variants, that may allow more precise determi-nation of a strain's origin. Rare variants may be particularly informative since they are likely to be restricted to specific strains (substrains/isolates). Strain genotyping of common variants provides an incomplete description of genomic pat-terns of DNA sequence variation, while obtaining most or all of the genomic sequence from multiple strains allows a maximally informative analyses of DNA sequence variation, its function, and ultimately, the evolutionary history of the organisms. The ability to rapidly, accurately and inexpen-sively resequence entire bacterial genomes should also con-tribute to an understanding of a variety of important phenotypic traits in B. anthracis and other bacterial patho-gens [57-62].
tech-comm
en
t
re
v
ie
w
s
re
ports
refer
e
e
d
re
sear
ch
de
p
o
si
te
d r
e
sea
rch
interacti
o
ns
inf
ormation
nologies (Table 1). In this experiment, 115 RAs, or 97.5% of the total attempted, were processed successfully obtaining an average high-quality base-calling rate of 92.6%. Called bases are shown to be highly replicable (discrepancy rate of 7.4 × 10⁻⁷)
and accurate when compared to conventional shotgun
sequence (discrepancy rate of < 2.5 × 10⁻⁶). Clearly,
RA-gen-erated resequencing data from a single experiment is compa-rable, in terms of data quality, to DNA sequence generated from multiple shotgun reads by a DNA sequencing center. The major technical challenge facing RA-based resequencing
Radial tree showing inferred phylogenetic relationships of B. anthracis strains from this study
Figure 3
Radial tree showing inferred phylogenetic relationships of B. anthracis strains from this study. The 37 variable positions identified in this study were concatenated together to create artificial sequence types. Groups of strains with identical sequence types were A0488 and ASC006; A0039, ASC025, ASC031, ASC070, ASC074 and ASC394; ASC074 and ASC054; A0328, ASC061 and ASC073; A0034, ASC159, ASC165 and ASC398. A DNA distance matrix was created using DNADIST, plotted as a UPGMA tree using NEIGHBOR and the tree plotted using DRAWGRAM [56]. The B1 strain A0465 was used as an outgroup.
A0465
ASC004
ASC027, 054 ASC050 ASC206
A0442
ASC120A0256
ASC038
A0039, ASC025, 031,
070, 074,394 A0248
ASC032 ASC152
ASC016
A0419
A0328, ASC061
, 073 A0188 ASC285
ASC006, A0488
ASC069 A0379
ASC386
ASC254
ASC065
A0149 A0264
ASC131
A0293 A0158 A0193
A0174
A0376
A0267
A0463
ASC010 ASC158 A0462 ASC161 ASC330
A0034, ASC159, 165, 398 A0089
ASC015 ASC014
A1a, A1b, A2, A3a
A3b (Ames)
A3a/A3d
B1
B2
is to increase overall call rates while not compromising data quality. Modifications of RA synthesis, experimental proto-cols and the ABACUS software algorithm could all contribute to improved base-calling rates. While it is possible to increase call rates while sacrificing data quality, there is a need to focus on generating very high-quality data at virtually all sites. If this is absent, the second-best outcome is to call all bases in an environment in which we understand the nature of probable errors. In diverse fields where RAs might be widely used as a first-stage screening tool, such as BW agent identi-fication or human clinical testing, the imperative is to use highly sensitive technologies that minimize the false-negative rate. False-positive findings could be confirmed later in a sec-ond-stage screen with an alternative technology such as con-ventional dideoxy chain termination sequencing.
Microarray-based resequencing identifies and genotypes SNPs in a single experiment. No prior knowledge of the vari-ability of a site is required - only a reference genomic sequence. Microarray design and applications are flexible. It is, however, important to note that the use of RAs in this study is not as a SNP typing technology. Thus, problems in inter-preting the inferred phylogenetic relationships between strains that arise from SNP typing schema are avoided [63]. RA-based resequencing resembles MLST methodology used for bacterial strains [52,55,64]. MLST attempts to choose the most informative genomic regions to resequence, largely because of the costs associated and technological limitations in generating enough DNA sequence data on a large collection of variant strains. While a typical MLST approach might
rese-quence between 3 and 4 kb, in organisms like B. anthracis
that have low levels of genetic variation ([28,51,55] and this study), this amount of generated sequence is insufficient. Clearly, RAs, such as those used in this study that can resequence approximately 29 kb, could rapidly increase this amount and be used for MLST studies. Furthermore, manu-facturing improvements that reduce RA feature sizes enable the resequencing of greater quantities of genomic sequence per microarray. Ongoing work at NMRC/BDRD is evaluating RAs that can resequence 300 kb per chip. At that RA feature density, when combined with whole-genome amplification protocols, a single technician in two days could resequence the entire B. anthracis genome on approximately 15 RAs.
Our data provides the first population genetic estimation of
the levels and patterns of DNA sequence variation in B.
anthracis. We report three main findings. First, among B. anthracis isolates sampled in the same fashion as in this
study we would expect two randomly selected B. anthracis
strains to differ, on average, at between 944 (SD 454) and 1,586 SNPs (SD 762). The variance surrounding these expec-tations is large, and any two isolates may differ from the expectation. Closely related, nonrandomly sampled isolates, such as those sequenced in [11], will have far fewer SNPs than that expected for samples drawn from a worldwide collection. Nevertheless, our data suggest that were it possible to rapidly
resequence entire B. anthracis genomes, sufficient genetic variation is likely to be found to make very fine-level discrim-ination of strain collections. Resequencing offers the best chance to identify newly arising, rare, strain-specific variants that will discriminate between very closely related strains, since we expect identical genotypes at the known common genetic variants [11]. We also observe, that as seen in eukary-otic genomes [45], the amount of silent variation per site within genes is much higher than that seen at replacement sites. Intergenic regions are seen to have intermediate levels of polymorphism. This pattern is expected to arise if noncod-ing intergenic regions possess variants visible to natural selection. If SNPs in intergenic regions were purely neutral, then we would expect to see levels of polymorphism similar to that at silent sites, which are undoubtedly under less strin-gent selective forces.
Second, the neutral theory of molecular evolution predicts that in a population at equilibrium, a significant proportion of the observed genetic variation will consist of rare genetic var-iants [49]. We observe a significant excess of rare SNPs as compared to that expected under the neutral theory (Table 2). This pattern of variation classically has at least two possible causes. The first consists of a recent population expansion from a small founder population. The second consists of the action of natural selection on genetic variants [65-67]. Rese-quencing technologies will be of particular use in populations of organisms exhibiting this pattern of genetic variation.
Finally, we see no evidence for plasmid exchange or recombi-nation altering the patterns of DNA sequence variation
among B. anthracis strains in the regions that we
rese-quenced. Some of the regions that we resequenced contain genes whose function influences B. anthracis pathogenicity or surrounded the bacterial origin of replication. In other bac-terial species, these types of regions are the most likely to exhibit recombination [14]. The fact that we observe no evi-dence of plasmid exchange or recombination among physi-cally linked markers in the regions that we resequenced, is striking.
comm
en
t
re
v
ie
w
s
re
ports
refer
e
e
d
re
sear
ch
de
p
o
si
te
d r
e
se
a
rch
interacti
o
ns
inf
o
rmation
or the entire genome, would allow a more thorough analysis of this pattern. Sequencing a larger percentage of the genome in a similar-sized or larger sample of isolates would provide greater power to detect rare recombination events. We are undertaking such a project to test the validity of our inference and to better determine if recombination is rare or absent among B. anthracis strains.
The absence of recombination in B. anthracis, a potential bio-warfare agent, suggests a novel approach to identifying a newly arising or a genetically engineered strain. A recombina-tion event could arise through rare natural genetic exchange or as a consequence of genetic engineering. Irrespective of the cause, the discovery of a B. anthracis strain possessing evi-dence of genetic recombination would warrant close exami-nation and probably demand immediate further phenotypic and genomic characterization.
Taken together, the findings of a low number of differences between strains, a preponderance of rare variants, and an absence of recombination all point to a scenario where the
current world population of B. anthracis has expanded
recently from a single clone derived from, and nested within a diverse species, B. cereus. Other bacterial pathogens, such as the potential biowarfare agent Yersinia pestis, possess a similar recent pattern of rapid expansion [15]. However, the patterns of genetic variation in Y. pestis are quite different from that seen in B. anthracis, for instance in the much more active role of insertion sequences in Yersinia. We speculate that the B. anthracis history of clonal expansion could arise as a consequence of the life history of a highly pathogenic sporulating mammalian pathogen. Exploring the population biology of less virulent members of the B. cereus group could directly test this. These population genomics studies could determine if clonal clusters of B. cereus strains exhibit similar population dynamics and patterns of genetic variation, or whether the picture of B. anthracis emerging from studies such as this is as unusual as the level of pathogenicity of the species itself.
Conclusions
Microarray-based resequencing can rapidly generate very high quality data, enabling population genomics studies in bacteria. We find no evidence for plasmid exchange or recom-bination altering the patterns of DNA sequence variation
among B. anthracis strains in the regions that we
rese-quenced The patterns of genetic variation in the B. anthracis
regions resequenced are consistent with that expected for a bacterial species that has undergone a rapid, historically recent expansion from a single clone. Detecting plasmid exchange or recombination between B. anthracis genetic var-iants could act as an indicator of a newly emerging or geneti-cally engineered strain.
Materials and methods
B. anthracis strains surveyedWe selected a geographically diverse panel of 56 B. anthracis
strains from the Biological Defense Research Directorate col-lection (see Additional data file 1). Twenty-four of the strains originated from the Louisiana State University collection [29]. These have been typed by MLVA [29] and in order to sample diversity, we chose a group that had representatives of the A1a, A1b, A2, A3a, A3b, A3d, A4, B1 and B2 lineages. The remaining 35 strains originate from a UK collection and were chosen to represent geographical variation as well as unusual phenotypes such as gamma phage and penicillin resistance. Six of the UK strains were reisolates of the Ames strain [11], which allowed us to test the reproducibility of resequencing.
Resequencing array design
Unique genomic sequences were identified using Miropeats [68] at the default thresholds from among the B. anthracis
Ames chromosome (5.2 megabase-pair (Mb), NC_003997) and plasmids pXO1 (181.6 kb, NC_001496) and pXO2 (96.2 kb, NC_002146). The genomic regions that we resequenced included at least one gene of interest (pXO1: toxin lethal fac-tor precursor lef, toxin moiety, protective antigen pagA;
pXO2: encapsulation protein gene CapC; Ames chromosome:
vrrA, DNA-directed RNA polymerase rpoB, yfhp protein), but also included many surrounding loci (see Additional data file 4 for complete listing). The total chip design consisted of 6,191 bp from pXO1, 6,725 bp from pXO2, and 16,584 bp from the Ames chromosome (total submitted sequence 29,500 bp). From these unique sequences, a single 20 × 25 µm RA design capable of resequencing 29,212 bp or 0.5% of the B. anthracis
genome was fabricated by Affymetrix (see Additional data file 3). The final sequences submitted for RA design are contained in Additional data file 5.
B. anthracis strain genomic DNA isolation
Five milliliters of brain heart infusion (BHI) was inoculated and grown 12-16 h at 37°C. One-ml aliquots of cells were
cen-trifuged for 10 min at 5,000-7,500g. Pellets were
Sample preparation and RA hybridization
Genomic DNA was amplified using Long PCR (LPCR) proto-cols described in Cutler et al. [32]. The primers that amplified each RA fragment are shown in Additional data file 3. The primer sequences were:
ant8 AAAAAGACGAGATGCGTCAACATCCCGTCCCA,
ant9 TCAACTAAATCCGCACCTAGGGTTGCTGTAAG,
ant10 ATTACTTTGAGTGGTCCCGTCTTTATCCCCCT,
ant11 ACATTAGCAGGCAAGGACAGTGGTGTTGGAGA,
ant14 ATTCACGCTCTCCCACCCAGATATTCCTACAT,
ant15 GTCCTAATATCGGTGAGCAACGCAGGGTAGTT,
ant20 GAGAAGAACCCCTACTACACGCATTGATACTG,
ant21 TTTAGTAGCGAGGGTACAGGCGCGTTTATACC,
ant26 TGGAAGCAGGCTTCGTAAGTGTAGGCGACGTT,
ant27 GTTGCATGTTCGCTCCCATAAGTGCGCGGTTA,
ant 32 AATGGGTGTATAGGGGTGATCTGTTGTGATGG,
ant33 TCCATGTTCGGCCATCTGATTCCGTCACTACT.
Long PCR product concentration was determined by using Pico-Green (Molecular Probes, Inc.) with lambda DNA stand-ards (Invitrogen). The LPCR products were then pooled, DNAse digested, biotin endlabelled and hybridized to individ-ual RAs overnight following established protocols contained in [32]. Subsequent washes and stains were carried out as described in Cutler et al. [32] and were only washed and not antibody stained. RAs were scanned at 570 nm, with a pixel size of 3 µm/pixel averaged over two scans. Automated grid alignment and base calling was performed for the .DAT files on a Mac G5 computer with the ABACUS software suite.
RA sequence determination
An ABACUS parameter search was employed to determine those parameters that called the maximal number of bases while minimizing discrepancies [32]. This total experiment consisted of 118 RAs, of which three failed (< 60% base call-ing). Of the remaining 115 RAs, 8 were used to sequence indi-vidual strains once. Of the remaining 107 RAs, 96 were used to replicate hybridize 48 B. anthracis strains, while the remaining 11 RAs were used as additional multiple replicates of these same strains. In total, sequence data was generated from 56 unique B. anthracis strains (see Additional data file 1 for strain listing). In order to obtain the most complete data possible, for those strains with replicate RA sequences, a sin-gle composite strain sequence was generated for subsequent
population genetic analyses. The current version of ABACUS algorithm is not designed to detect insertion/deletion variation.
The effect of oligonucleotide probe composition was deter-mined by choosing for each base, the probe with the most purines or the most guanines. The number of times that a given base was called was tabulated across all 115 successful RAs. The mean purine and guanine composition was deter-mined for the classes that were called in all 115 RAs and uncalled in all 115 RAs. A Student's t test with unequal vari-ances was used to test for difference in mean sequence com-position (purines/guanines) between the always called and never called classes. The DNA sequence files for the 115 RAs and the original RA image files (.DAT files) are available from the authors and will be made available through the NCBI Trace Archive.
Population genetic analyses
All population genetic analyses were calculated using the popgen_fasta2.0.c code (Cutler DJ, unpublished work) on the collection of 56 sets of B. anthracis fasta files. The fasta files were analyzed in total and separately for the main chro-mosome and plasmids pXO1 and pXO2. The identification of genes was taken from publicly available annotation contained in the relevant GenBank refseq files (B. anthracis str. Ames NC_003997; pXO1, NC_001496; pXO2 NC_002146). The statistical significance of linkage disequilibrium between site pairs was performed by using the Fisher's Exact Test at P < 10-3 [69].
Estimating levels of genetic variation
To account for missing data, θ is estimated by [Σn(Sn/an)]/L,
where Sn is the number of observed segregating sites at posi-tions with exactly n alleles sequenced (n is a maximum of 56, fewer with missing data), an = Σi = 1..n-1 1/i, and L is the total
length of the sequence examined. Var{θ} is estimated by [Σn (Lnθ/an + (Ln)2bnθ2/(an)2]/L2, where Ln is the number of sites
with data from exactly n alleles, and bn = Σi = 1..n-1 1/i2. With
missing data π is estimated by [Σi 2piqini/(ni - 1)]/L, where the sum is taken over all sites i, pi and qi are the allele frequencies at site i, and ni is the number of alleles sequenced at site i.
comm en t re v ie w s re ports refer e e d re sear ch de p o si te d r e sea rch interacti o ns inf ormation
significantly better than the model with a single theta through a likelihood ratio test. Reported significances are the p-values from the likelihood ratio test.
Site frequency spectrum
Comparing the observed site frequency spectrum with that expected under the neutral theory is a powerful approach to detect unusual patterns of genetic diversity. We employed two different approaches for this analysis. First, we calculated the expected number of sites with minor allele frequency i as ΣnθLn [1/i + 1/(n - i)] and from this determine the expected
percent of sites under the neutral expectation. This is directly compared with the observed percent of SNPs in Figure 2. Confidence intervals for the sample proportion of each SNP minor allele frequency classes as
where N is the number of SNPs observed for each class, is
their observed frequency, and .
As a second method, we employed Tajima's D statistic [50], estimated as (π - θ)/Var(π - θ). Under the neutral model, π and θ have the same expectation, hence Tajima's D is expected to be 0. Since π is a function of site heterozygosities and θ is a function of the total number of segregating sites, Tajima's D is negative (positive) with an excess (deficit) of rare sites. We use our estimated values of π [51] and θ [45], multiplied by the total genome B. anthracis genome length (5,505,178), to determine the expected number of SNPs that we would expect to observe among two B. anthracis strains sampled in same random fashion as isolates in this study were chosen. Using Equations 6-9 in [51], we calculated the vari-ance of and θ estimators. The one standard deviation (SD) that we report is the square root of this variance.
Phylogenetic tree inference
The 37 variable positions identified in this study were con-catenated together to create artificial sequence types. A DNA distance matrix was created using DNADIST, plotted as a UPGMA tree using NEIGHBOR and the tree plotted using DRAWGRAM [57].
Additional data files
The following additional data are available with the online version of this article. Additional data file 1 lists B. anthracis
strains from the Biological Defense Research Directorate (BDRD) strain collection resequenced in this study. Addi-tional data file 2 lists the BDRD-01 RA fragment names, the GenBank reference sequence from which they are derived, the length of the unique genomic sequences submitted to RA design, the length of the unique genomic sequences capable of being queried, and the LPCR primer pairs used to amplify the
RA fragments. Additional data file 3 lists the B. anthracis
SNPs identified in this study. The data include the BDRD SNP ID, the GenBank reference sequence and RA fragment containing the SNP, the SNP position relative to the GenBank reference sequence and the RA sequence, the SNP frequency, and the listing of the base calls in all strains at sites harboring SNPs. Additional data file 4 lists the 31 B. anthracis genes partially or wholly resequenced in this study. The observed number SNPs by SNP type (silent vs replacement) for each gene are provided. Finally, Additional data file 5 shows the genomic sequences submitted to RA design for BDRD-01. Additional data file 1
B. anthracis strains from the Biological Defense Research Directo-rate (BDRD) strain collection resequenced in this study
B. anthracis strains from the Biological Defense Research Directo-rate (BDRD) strain collection resequenced in this study
Click here for additional data file Additional data file 2
The BDRD-01 RA fragment names, the GenBank reference sequence from which they are derived, the length of the unique genomic sequences submitted to RA design, the length of the unique genomic sequences capable of being queried, and the LPCR primer pairs used to amplify the RA fragments
The BDRD-01 RA fragment names, the GenBank reference sequence from which they are derived, the length of the unique genomic sequences submitted to RA design, the length of the unique genomic sequences capable of being queried, and the LPCR primer pairs used to amplify the RA fragments
Click here for additional data file Additional data file 3
The B. anthracis SNPs identified in this study. The data include the BDRD SNP ID, the GenBank reference sequence and RA fragment containing the SNP, the SNP position relative to the GenBank ref-erence sequence and the RA sequence, the SNP frequency, and the listing of the base calls in all strains at sites harboring SNPs The B. anthracis SNPs identified in this study. The data include the BDRD SNP ID, the GenBank reference sequence and RA fragment containing the SNP, the SNP position relative to the GenBank ref-erence sequence and the RA sequence, the SNP frequency, and the listing of the base calls in all strains at sites harboring SNPs Click here for additional data file
Additional data file 4
The 31 B. anthracis genes partially or wholly resequenced in this study
The 31 B. anthracis genes partially or wholly resequenced in this study
Click here for additional data file Additional data file 5
The genomic sequences submitted to RA design for BDRD-01 The genomic sequences submitted to RA design for BDRD-01 Click here for additional data file
Acknowledgements
Funding from the Defense Threat Reduction Agency (DTRA) was used to support this study. The authors would like to thank Peter Turnbull for aid in B. anthracis strain selection, Michael Chute for B. anthracis genomic DNA isolation and David Rasko for comments on the manuscript. The views expressed in this paper are those of the authors and do not reflect the offi-cial policy or position of the Department of Navy, Department of Defense or US Government.
References
1. DeLong EF: Microbial population genomics and ecology.Curr Opin Microbiol 2002, 5:520-524.
2. DeLong EF: Towards microbial systems science: integrating microbial perspective, from genomes to biomes. Environ Microbiol 2002, 4:9-10.
3. Joyce EA, Chan K, Salama NR, Falkow S: Redefining bacterial pop-ulations: a post-genomic reformation. Nat Rev Genet 2002, 3:462-473.
4. Hoffmaster AR, Ravel J, Rasko DA, Chapman GD, Chute MD, Marston CK, De BK, Sacchi CT, Fitzgerald C, Mayer LW, et al.: Iden-tification of anthrax toxin genes in a Bacillus cereus associ-ated with an illness resembling inhalation anthrax.Proc Natl Acad Sci USA 2004, 101:8449-8454.
5. GOLD Genomes OnLine Database [http://www.genomeson line.org]
6. Okinaka RT, Cloud K, Hampton O, Hoffmaster AR, Hill KK, Keim P, Koehler TM, Lamke G, Kumano S, Mahillon J, et al.: Sequence and organization of pXO1, the large Bacillus anthracis plasmid harboring the anthrax toxin genes. J Bacteriol 1999, 181:6509-6515.
7. Okinaka R, Cloud K, Hampton O, Hoffmaster A, Hill K, Keim P, Koehler T, Lamke G, Kumano S, Manter D, et al.: Sequence, assem-bly and analysis of pX01 and pX02. J Appl Microbiol 1999, 87:261-262.
8. Read TD, Peterson SN, Tourasse N, Baillie LW, Paulsen IT, Nelson KE, Tettelin H, Fouts DE, Eisen JA, Gill SR, et al.: The genome sequence of Bacillus anthracis Ames and comparison to closely related bacteria.Nature 2003, 423:81-86.
9. Ivanova N, Sorokin A, Anderson I, Galleron N, Candelon B, Kapatral V, Bhattacharyya A, Reznik G, Mikhailova N, Lapidus A, et al.: Genome sequence of Bacillus cereus and comparative analy-sis with Bacillus anthracis.Nature 2003, 423:87-91.
10. Rasko DA, Ravel J, Okstad OA, Helgason E, Cer RZ, Jiang L, Shores KA, Fouts DE, Tourasse NJ, Angiuoli SV, et al.: The genome sequence of Bacillus cereus ATCC 10987 reveals metabolic adaptations and a large plasmid related to Bacillus anthracis pXO1.Nucleic Acids Res 2004, 32:977-988.
11. Read TD, Salzberg SL, Pop M, Shumway M, Umayam L, Jiang L, Holt-zapple E, Busch JD, Smith KL, Schupp JM, et al.: Comparative genome sequencing for discovery of novel polymorphisms in Bacillus anthracis.Science 2002, 296:2028-2033.
12. Cummings CA, Relman DA: Genomics and microbiology. Micro-bial forensics - "cross-examining pathogens". Science 2002, 296:1976-1979.
13. Hughes AL, Friedman R, Murray M: Genomewide pattern of syn-onymous nucleotide substitution in two complete genomes of Mycobacterium tuberculosis. Emerg Infect Dis 2002,
ˆ ˆˆ,
p±1.96 pq N
ˆ
p
ˆ ˆ
q= −1 p
8:1342-1346.
14. Whittam TS, Bumbaugh AC: Inferences from whole-genome sequences of bacterial pathogens. Curr Opin Genet Dev 2002, 12:719-725.
15. Wren BW: The yersiniae - a model genus to study the rapid evolution of bacterial pathogens. Nat Rev Microbiol 2003, 1:55-64.
16. Jensen GB, Hansen BM, Eilenberg J, Mahillon J: The hidden lifestyles of Bacillus cereus and relatives.Environ Microbiol 2003, 5:631-640. 17. Harrell LJ, Andersen GL, Wilson KH: Genetic variability of Bacil-lus anthracis and related species. J Clin Microbiol 1995, 33:1847-1850.
18. Andersen GL, Simchock JM, Wilson KH: Identification of a region of genetic variability among Bacillus anthracis strains and related species.J Bacteriol 1996, 178:377-384.
19. Price LB, Hugh-Jones M, Jackson PJ, Keim P: Genetic diversity in the protective antigen gene of Bacillus anthracis. J Bacteriol 1999, 181:2358-2362.
20. Schupp JM, Klevytska AM, Zinser G, Price LB, Keim P: vrrB, a hyper-variable open reading frame in Bacillus anthracis.J Bacteriol 2000, 182:3989-3997.
21. Ko KS, Kim JM, Kim JW, Jung BY, Kim W, Kim IJ, Kook YH: Identi-fication of Bacillus anthracis by rpoB sequence analysis and multiplex PCR.J Clin Microbiol 2003, 41:2908-2914.
22. Cherif A, Brusetti L, Borin S, Rizzi A, Boudabous A, Khyami-Horani H, Daffonchio D: Genetic relationship in the 'Bacillus cereus group' by rep-PCR fingerprinting and sequencing of a Bacillus anthracis-specific rep-PCR fragment. J Appl Microbiol 2003, 94:1108-1119.
23. Cherif A, Borin S, Rizzi A, Ouzari H, Boudabous A, Khyami-Horani H, Daffonchio D: Bacillus anthracis diverges from related clades of the Bacillus cereus group in 16S-23S ribosomal DNA inter-genic transcribed spacers containing tRNA genes.Appl Environ Microbiol 2003, 69:33-40.
24. Jackson PJ, Hill KK, Laker MT, Ticknor LO, Keim P: Genetic com-parison of Bacillus anthracis and its close relatives using amplified fragment length polymorphism and polymerase chain reaction analysis.J Appl Microbiol 1999, 87:263-269. 25. Ticknor LO, Kolsto AB, Hill KK, Keim P, Laker MT, Tonks M, Jackson
PJ: Fluorescent amplified fragment length polymorphism analysis of Norwegian Bacillus cereus and Bacillus thuringiensis soil isolates.Appl Environ Microbiol 2001, 67:4863-4873.
26. Radnedge L, Agron PG, Hill KK, Jackson PJ, Ticknor LO, Keim P, Andersen GL: Genome differences that distinguish Bacillus anthracis from Bacillus cereus and Bacillus thuringiensis.Appl Environ Microbiol 2003, 69:2755-2764.
27. Hill KK, Ticknor LO, Okinaka RT, Asay M, Blair H, Bliss KA, Laker M, Pardington PE, Richardson AP, Tonks M, et al.: Fluorescent ampli-fied fragment length polymorphism analysis of Bacillus anthracis, Bacillus cereus, and Bacillus thuringiensis isolates. Appl Environ Microbiol 2004, 70:1068-1080.
28. Keim P, Klevytska AM, Price LB, Schupp JM, Zinser G, Smith KL, Hugh-Jones ME, Okinaka R, Hill KK, Jackson PJ: Molecular diversity in Bacillus anthracis.J Appl Microbiol 1999, 87:215-217.
29. Keim P, Price LB, Klevytska AM, Smith KL, Schupp JM, Okinaka R, Jackson PJ, Hugh-Jones ME: Multiple-locus variable-number tan-dem repeat analysis reveals genetic relationships within Bacillus anthracis.J Bacteriol 2000, 182:2928-2936.
30. Smith KL, DeVos V, Bryden H, Price LB, Hugh-Jones ME, Keim P: Bacillus anthracis diversity in Kruger National Park. J Clin Microbiol 2000, 38:3780-3784.
31. Fouet A, Smith KL, Keys C, Vaissaire J, Le Doujet C, Levy M, Mock M, Keim P: Diversity among French Bacillus anthracis isolates.J Clin Microbiol 2002, 40:4732-4734.
32. Cutler DJ, Zwick ME, Carrasquillo MM, Yohn CT, Tobin KP, Kashuk C, Mathews DJ, Shah NA, Eichler EE, Warrington JA, Chakravarti A: High-throughput variation detection and genotyping using microarrays.Genome Res 2001, 11:1913-1925.
33. Maitra A, Cohen Y, Gillespie SE, Mambo E, Fukushima N, Hoque MO, Shah N, Goggins M, Califano J, Sidransky D, Chakravarti A: The Human MitoChip: a high-throughput sequencing microarray for mitochondrial mutation detection. Genome Res 2004, 14:812-819.
34. Gingeras TR, Ghandour G, Wang E, Berno A, Small PM, Drobniewski F, Alland D, Desmond E, Holodniy M, Drenkow J: Simultaneous genotyping and species identification using hybridization pattern recognition analysis of generic Mycobacterium DNA arrays.Genome Res 1998, 8:435-448.
35. Wilson KH, Wilson WJ, Radosevich JL, DeSantis TZ, Viswanathan VS, Kuczmarski TA, Andersen GL: High-density microarray of small-subunit ribosomal DNA probes. Appl Environ Microbiol 2002, 68:2535-2541.
36. Winzeler EA, Richards DR, Conway AR, Goldstein AL, Kalman S, McCullough MJ, McCusker JH, Stevens DA, Wodicka L, Lockhart DJ, Davis RW: Direct allelic variation scanning of the yeast genome.Science 1998, 281:1194-1197.
37. Winzeler EA, Castillo-Davis CI, Oshiro G, Liang D, Richards DR, Zhou Y, Hartl DL: Genetic diversity in yeast assessed with whole-genome oligonucleotide arrays. Genetics 2003, 163:79-89.
38. Halushka MK, Fan JB, Bentley K, Hsie L, Shen N, Weder A, Cooper R, Lipshutz R, Chakravarti A: Patterns of single-nucleotide poly-morphisms in candidate genes for blood-pressure homeostasis.Nat Genet 1999, 22:239-247.
39. Cargill M, Altshuler D, Ireland J, Sklar P, Ardlie K, Patil N, Shaw N, Lane CR, Lim EP, Kalyanaraman N, et al.: Characterization of sin-gle-nucleotide polymorphisms in coding regions of human genes.Nat Genet 1999, 22:231-238.
40. Wang DG, Fan JB, Siao CJ, Berno A, Young P, Sapolsky R, Ghandour G, Perkins N, Winchester E, Spencer J, et al.: Large-scale identifi-cation, mapping, and genotyping of single-nucleotide poly-morphisms in the human genome.Science 1998, 280:1077-1082. 41. Warrington JA, Shah NA, Chen X, Janis M, Liu C, Kondapalli S, Reyes V, Savage MP, Zhang Z, Watts R, et al.: New developments in high-throughput resequencing and variation detection using high density microarrays.Hum Mutat 2002, 19:402-409. 42. Ewing B, Hillier L, Wendl MC, Green P: Base-calling of automated
sequencer traces using phred. I. Accuracy assessment. Genome Res 1998, 8:175-185.
43. Ewing B, Green P: Base-calling of automated sequencer traces using phred. II. Error probabilities.Genome Res 1998, 8:186-194. 44. Watterson GA: On the number of segregating sites in geneti-cal models without recombination. Theor Popul Biol 1975, 7:256-276.
45. Zwick ME, Cutler DJ, Chakravarti A: Patterns of genetic variation in Mendelian and complex traits.Annu Rev Genomics Hum Genet 2000, 1:387-407.
46. Internation Human Genome Sequencing Consortium: Initial sequencing and analysis of the human genome.Nature 2001, 409:860-921.
47. Venter JC, Adams MD, Myers EW, Li PW, Mural RJ, Sutton GG, Smith HO, Yandell M, Evans CA, Holt RA, et al.: The sequence of the human genome.Science 2001, 291:1304-1351.
48. Stephens JC, Schneider JA, Tanguay DA, Choi J, Acharya T, Stanley SE, Jiang R, Messer CJ, Chew A, Han JH, et al.: Haplotype variation and linkage disequilibrium in 313 human genes. Science 2001, 293:489-493.
49. Kimura M: The Neutral Theory of Molecular Evolution Cambridge: Cam-bridge University Press; 1983.
50. Tajima F: Statistical method for testing the neutral mutation hypothesis by DNA polymorphism.Genetics 1989, 123:585-595. 51. Helgason E, Okstad OA, Caugant DA, Johansen HA, Fouet A, Mock M, Hegna I, Kolsto : Bacillus anthracis, Bacillus cereus, and Bacil-lus thuringiensis - one species on the basis of genetic evidence. Appl Environ Microbiol 2000, 66:2627-2630.
52. Helgason E, Tourasse NJ, Meisal R, Caugant DA, Kolsto AB: Multilo-cus sequence typing scheme for bacteria of the Bacillus cereus group.Appl Environ Microbiol 2004, 70:191-201.
53. Hudson RR, Kaplan NL: Statistical properties of the number of recombination events in the history of a sample of DNA sequences.Genetics 1985, 111:147-164.
54. Lewontin RC: The interaction of selection and linkage I. General considerations, heterotic models. Genetics 1964, 49:49-67.
55. Priest FG, Barker M, Baillie LWJ, Holmes EC, Maiden MCJ: Popula-tion structure and evoluPopula-tion of the Bacillus cereus group.J Bacteriol 2004, 186:7959-7970.
56. Felsenstein J: PHYLIP (Phylogeny Inference Package) version 3.6 Seattle, WA: Department of Genome Sciences, University of Washington; 2004.
57. Ariel N, Zvi A, Grosfeld H, Gat O, Inbar Y, Velan B, Cohen S, Shaf-ferman A: Search for potential vaccine candidate open read-ing frames in the Bacillus anthracis virulence plasmid pXO1: in silico and in vitro screening.Infect Immun 2002, 70:6817-6827. 58. Vogler AJ, Busch JD, Percy-Fine S, Tipton-Hunton C, Smith KL, Keim
anthra-comm
en
t
re
v
ie
w
s
re
ports
refer
e
e
d
re
sear
ch
de
p
o
si
te
d r
e
se
a
rch
interacti
o
ns
inf
o
rmation
cis and Bacillus cereus. Antimicrob Agents Chemother 2002, 46:511-513.
59. Ariel N, Zvi A, Makarova KS, Chitlaru T, Elhanany E, Velan B, Cohen S, Friedlander AM, Shafferman A: Genome-based bioinformatic selection of chromosomal Bacillus anthracis putative vaccine candidates coupled with proteomic identification of surface-associated antigens.Infect Immun 2003, 71:4563-4579.
60. Weissman SJ, Moseley SL, Dykhuizen DE, Sokurenko EV: Entero-bacterial adhesins and the case for studying SNPs in bacteria.Trends Microbiol 2003, 11:115-117.
61. Feldgarden M, Byrd N, Cohan FM: Gradual evolution in bacteria: evidence from Bacillus systematics. Microbiology 2003, 149:3565-3573.
62. Liu H, Bergman NH, Thomason B, Shallom S, Hazen A, Crossno J, Rasko DA, Ravel J, Read TD, Peterson SN, et al.: Formation and composition of the Bacillus anthracis endospore. J Bacteriol 2004, 186:164-178.
63. Alland D, Whittam TS, Murray MB, Cave MD, Hazbon MH, Dix K, Kokoris M, Duesterhoeft A, Eisen JA, Fraser CM, Fleischmann RD: Modeling bacterial evolution with comparative-genome-based marker systems: application to Mycobacterium tuber-culosis evolution and pathogenesis. J Bacteriol 2003, 185:3392-3399.
64. Maiden MC, Bygraves JA, Feil E, Morelli G, Russell JE, Urwin R, Zhang Q, Zhou J, Zurth K, Caugant DA, et al.: Multilocus sequence typ-ing: a portable approach to the identification of clones within populations of pathogenic microorganisms.Proc Natl Acad Sci USA 1998, 95:3140-3145.
65. Kaplan NL, Hudson RR, Langley CH: The "hitchhiking effect" revisited.Genetics 1989, 123:887-899.
66. Charlesworth B: The effect of background selection against deleterious mutations on weakly selected, linked variants. Genet Res 1994, 63:213-227.
67. Charlesworth D, Charlesworth B, Morgan MT: The pattern of neu-tral molecular variation under the background selection model.Genetics 1995, 141:1619-1632.
68. Parsons JD: Miropeats: graphical DNA sequence comparisons. Comput Appl Biosci 1995, 11:615-619.
69. Weir BS: Genetic Data Analysis II Sunderland, MA: Sinauer Associates; 1996.