International Journal of Emerging Technology and Advanced Engineering
Website: www.ijetae.com (ISSN 2250-2459, ISO 9001:2008 Certified Journal, Volume 5, Issue 4, April 2015)
87
Optimization of Material Removal Rate and Surface Roughness
for WEDM of Titanium Alloy (Ti-4.5Al-2V) Using Taguchi
Method.
Subhash Chander
1, Jasvir
SinghTiwana
21,2Department of Mechanical Engineering, Giani Zail Singh PTU Campus, Bathinda (Punjab), India.
Abstract- In this paper, wire electric discharge machining (WEDM) of Titanium alloy (Ti-4.5Al-2V) is studied. In WEDM, the prime objective in cutting operation is to achieve the highest possible cutting speed along with desirable surface finish without sacrificing productivity. It is evident that a high material removal rate and a very good surface finish can never be achieved simultaneously in WEDM. Selection of optimal cutting parameters has a critical issue to achieve high-quality in the machining process. In this study Design of Experiment (DOE) method for selection of optimal cutting parameters during WEDM of Titanium alloy (Ti-4.5Al-2V) is experimentally study moreover, the behavior of five control parameters such as taper angle, peak current, pulse on time, pulse off time and the dielectric flow rate on the machining performance, included Metal Removal Rate (MRR) and Surface Roughness (SR) is studied using Taguchi method. The optimum condition has been determined with the help of main effect plot and ANOVA table to find out which
parameters have most affected the performance
characteristics. The mathematical modeling has been carried out using Minitab 15 software and different models have been
analyzed with the help of the Taguchi design using L18
orthogonal array.
Keywords- WEDM, ANOVA, Taguchi method, MRR, Titanium alloy (Ti-4.5Al-2V), MRR.
I. INTRODUCTION
However titanium alloys are difficult to machine using the traditional machining techniques due to their high spring-back characteristics, high chemical reactivity and low heat conduction coefficient, which lead to rapid tool wear during machining of titanium alloys, in turn increases the manufacturing cost. The high strength, low weight, and outstanding corrosion resistance possessed by titanium alloys have led to a wide range of successful applications in aerospace, automobile, chemical plant, power generation, surgical instruments and other major industries. Thus, machining of titanium alloy has been a topic of interest for industrial production and scientific research worldwide.
Again, the property like strong alloying tendency or chemical reactivity of Ti-4.5Al-2V with most tool materials, which causes rapid destruction of the cutting tool with galling, welding and smearing at the interacting surface, leads to excessive chipping or premature tool failure and poor surface finish. Therefore, many researchers have been searching for effective methods to machine titanium alloys by non-conventional machining processes. (Boyer and Gall, 1985; Donachie and Mattew, 2000)
WEDM is one of the most widely used non-traditional machining process. In WEDM, the prime objective in cutting operation is to achieve the highest possible cutting speed along with desirable surface finish without sacrificing productivity. It is evident that a high material removal rate and a very good surface finish can never be achieved simultaneously in WEDM. Selection of optimal cutting parameters has a critical issue to achieve high-quality in the machining process. WEDM process with a thin wire as an electrode transforms electrical energy to thermal energy for cutting materials. With this process, alloy steel, conductive ceramics and aerospace materials can be machined irrespective to their hardness and toughness. [H. K. Kansal, 2006]. Furthermore, WEDM is capable of producing a fine, precise, corrosion and wear resistant surface. WEDM is mainly used to machine exotic and high strength & temperature resisting material and eliminate the geometric change occurs due to the machining of heat treated steels. Alloys used in the aeronautics industry for example hard alloy, etc. the process is added advantage of being capable of machining complicated components. During the WEDM process, the material is eroded ahead of the wire and there is no direct contact between the work piece and the wire, eliminating the mechanical stresses during machining. (Rajurkar and Wang; 1993)
International Journal of Emerging Technology and Advanced Engineering
Website: www.ijetae.com (ISSN 2250-2459, ISO 9001:2008 Certified Journal, Volume 5, Issue 4, April 2015)
The breakdown of this plasma channel occurs because of acceleration of the electron toward the anode. Thus these are creating more positive ions electron which are accelerated toward the cathode and anode. The impact of these electron and positive ions to the anode and cathode produce heat energy. The sparks will generate between two closely spaced electrodes under the influence of dielectric liquid. Water is used as dielectric in WEDM, because of its low viscosity and rapid cooling rate [GAO Qing,].
[image:2.612.64.289.303.491.2]No conclusive theory has been established for the complex machining process. However, empirical evidence suggests that the applied voltage creates an ionized channel between the nearest points of the work piece and the wire electrodes in the initial stage.
Fig.1: Diagram of the Basic Principle of WEDM Process [Kamal Jangra, Sandeep Grover, 2011]
In the next stage the actual discharge takes place with heavy flow of current and the resistance of the ionized channel gradually decreases. The high intensity of current continues to further ionize the channel and a powerful magnetic field is generated. This magnetic field compresses the ionized channel and results in localized heating. Even with sparks of very short duration, the temperature of electrodes can locally rise to very high value which is more than the melting point of workpiece material due to transformation of the kinetic energy of electrons in to heat. The energy density erodes a part of material from both the wire and workpiece by locally melting and vaporizing and thus it is the dominant thermal erosion process (S.Sarkar, 2008).
The Taguchi method (Ross, (1996; Roy, 2001) is a systematic application of design and analysis of experiments for the purpose of designing and improving
However, the original Taguchi method was designed to optimize the single performance characteristics. According to Phadke (1989), it is difficult to optimize multi-response in complex process by Taguchi method and engineering judgment is primarily used to resolve such a complicated problem.
Taguchi technique for DOE has been the most widely used technique for the last two decades. One of the important steps involved in Taguchi‟s technique is selection of orthogonal array (OA). Which will further help to conduct experiments to determine the optimum level for each process parameters and establish the relative importance of individual process parameters An OA is a small set from all possibilities which helps to determine least no. of experiments. To obtain optimum process parameters settings, Taguchi proposed a statistical measure of performance called signal to noise ratio. This ratio consider both the mean and the variability. In addition to S/N ratio, ANOVA is used to indicate the influence of process parameters on performance measures. (M. Kaladhar et. al, 2011).
II. EXPERIMENTAL SET UP,DESIGN AND RESULTS
2.1 Experimental Set up
In this study a rectangular block of Titanium based alloy (Ti-4.5Al-2V, Composition, C = 0.028%, Ti = 93.15%, Al = 4.46%, V = 2.00%, N = 0.010%, Fe = 0.15%) of size 100 × 100 × 13 was taken. The hardness and density of material was measured as 15HRC and 4.4g/cc. The experiments were carried out on a WEDM machine (Electra Ultima 1F) Electronica Machine Tools Ltd., India as shown in figure 2
.
[image:2.612.325.569.507.683.2]International Journal of Emerging Technology and Advanced Engineering
Website: www.ijetae.com (ISSN 2250-2459, ISO 9001:2008 Certified Journal, Volume 5, Issue 4, April 2015)
89
The range of variable parameters in Elektra Ultima 1F machine tool were as follows: peak current, 100-130 amp.; pulse-on time, 100-131µs; pulse- off time 0-63µs; wire speed, 1-15m/min.; wire tension, 1-15unit; servo voltage, 10-99V; dielectric flow rate, 0-15Lt/min.; Zinc coated brass wire of diameter 0.25mm.was used as an electrode because of good capability to sustain high discharge energy.
2.2 Experimental Design
In the present work, five parameters namely taper angle, peak current, pulse-on time, pulse-off time and dielectric flow rate were selected as input variables of WEDM. The experiments were carried out with fixed values, wire tension 8 units, wire feed 7 m/min., spark gap set voltage 48 volt, and servo feed 2050 unit and flushing pressure 1 unit.
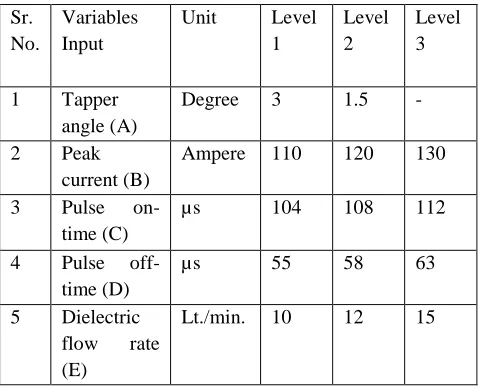
[image:3.612.49.288.437.633.2]Out of five input parameters, taper angle was kept at two levels while all four input parameters were assigned values of three levels. Taper angle was considered to provide some draft angle keeping in mind the concept of die and punch manufacturing. Preliminary experiments were conducted to select range and values of the machining parameters. Table II depicts the value of levels of the selected process variables.
Table 1:
Input variables parameters and their levels
Sr. No.
Variables Input
Unit Level
1
Level 2
Level 3
1 Tapper
angle (A)
Degree 3 1.5 -
2 Peak
current (B)
Ampere 110 120 130
3 Pulse
on-time (C)
µs 104 108 112
4 Pulse
off-time (D)
µs 55 58 63
5 Dielectric flow rate (E)
Lt./min. 10 12 15
The orthogonal array forms the basis for the experimental analysis in Taguchi method. The selection of orthogonal array is concerned with the total degree of freedom of process parameters. Total degree of freedom associated with five parameters is equal to 9 (1 × 1 + 4 × 2).
The degree of freedom for the orthogonal array should be greater than or at least equal to that of the process parameters. Thereby, a L18 orthogonal array having degrees of freedom equal to 17 has been selected. The Experimental layout is shown in Table 2.
2.3 Experimental Results
Based on the experimental layout depicted in Table 2, the experiments were performed in random order and each specific experiment was repeated two times. Two machining characteristics namely material removal rate (MRR) and surface roughness (SR) were measured. MRR was measured in mm/min. which was observed from machine tool monitor screen. SR value in µs was measured in terms of mean absolute deviation (Ra) using the digital surface tester Mitutoyo 201P. Observed machining characteristics are depicted in Table II.
III. OPTIMIZATION OF INDIVIDUAL MACHINING
CHARACTERISTICS
In this study, the Taguchi method, a powerful tool for parameter design of the performance characteristics was used to determine optimal machining parameters for maximization of cutting speed and surface roughness in WEDM. In this work, it is planned to study the behavior of five control factors viz., A, B, C, D, and E. The experimental observations are further transformed into a signal-to-noise (S/N) ratio. There are several S/N ratios available depending on the type of characteristics. The machining characteristic which has higher value represents better machining performance, such as cutting speed, is called „higher is better, HB‟.
Inversely, the characteristic that lower value represents better machining performance, such as surface roughness, is called „lower is better, LB‟. Therefore, „HB‟ for the cutting speed and „LB‟ for the SR were selected for obtaining optimum machining performance characteristics. The loss function (L) for objective of HB and LB is defined as follows:
)
1
...(
...
.
²
1
1
1
n i cs HBy
n
L
)
2
...(
...
.
²
1
1
n i sf LBy
n
L
International Journal of Emerging Technology and Advanced Engineering
Website: www.ijetae.com (ISSN 2250-2459, ISO 9001:2008 Certified Journal, Volume 5, Issue 4, April 2015)
The S/N ratio can be calculated as a logarithmic transformation of the loss function as shown below
. S / N ratio for cutting speed = -10 log10 (LHB) --- (3)
S/N ratio for Surface Roughness= -10 log10 (LLB) … (4).
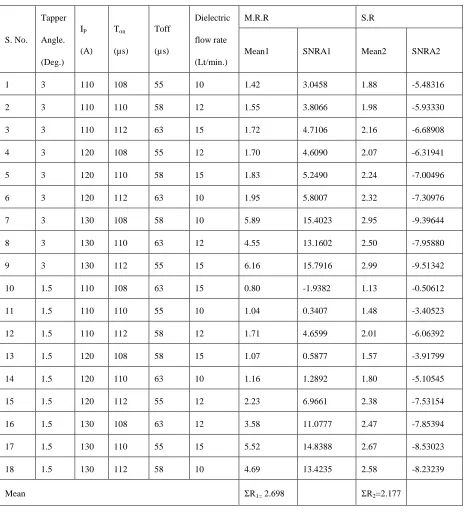
The array chooses L18 (35), which have 18 rows corresponding to the number of experiments with 5 columns at mixed levels.
[image:4.612.75.540.223.736.2]
Table II
Experimental Observations
S. No.
Tapper
Angle.
(Deg.) IP
(A) Ton
(µs)
Toff
(µs)
Dielectric
flow rate
(Lt/min.)
M.R.R S.R
Mean1 SNRA1 Mean2 SNRA2
1 3 110 108 55 10 1.42 3.0458 1.88 -5.48316
2 3 110 110 58 12 1.55 3.8066 1.98 -5.93330
3 3 110 112 63 15 1.72 4.7106 2.16 -6.68908
4 3 120 108 55 12 1.70 4.6090 2.07 -6.31941
5 3 120 110 58 15 1.83 5.2490 2.24 -7.00496
6 3 120 112 63 10 1.95 5.8007 2.32 -7.30976
7 3 130 108 58 10 5.89 15.4023 2.95 -9.39644
8 3 130 110 63 12 4.55 13.1602 2.50 -7.95880
9 3 130 112 55 15 6.16 15.7916 2.99 -9.51342
10 1.5 110 108 63 15 0.80 -1.9382 1.13 -0.50612
11 1.5 110 110 55 10 1.04 0.3407 1.48 -3.40523
12 1.5 110 112 58 12 1.71 4.6599 2.01 -6.06392
13 1.5 120 108 58 15 1.07 0.5877 1.57 -3.91799
14 1.5 120 110 63 10 1.16 1.2892 1.80 -5.10545
15 1.5 120 112 55 12 2.23 6.9661 2.38 -7.53154
16 1.5 130 108 63 12 3.58 11.0777 2.47 -7.85394
17 1.5 130 110 55 15 5.52 14.8388 2.67 -8.53023
18 1.5 130 112 58 10 4.69 13.4235 2.58 -8.23239
International Journal of Emerging Technology and Advanced Engineering
Website: www.ijetae.com (ISSN 2250-2459, ISO 9001:2008 Certified Journal, Volume 5, Issue 4, April 2015)
91
The response table using Taguchi method is employed here to calculate the effect of each level of process parameter on machining characteristics. It is done by sorting the mean values of machining characteristics corresponding to levels of the process parameter in each column of the orthogonal array, and taking an average on those with same level. For example, the average effect on MRR for parameters A and B at level 1 can be calculated as follows:
A1 = (1.42 + 1.55 + 1.72 + 1.70 + 1.83 + 1.95 + 5.89 + 4.55 + 6.16) = 26.77/9 = 2.97,
B1 = (1.42 + 1.70 + 5.89 + 0.80 + 1.07 + 3.58)
= 14.46/6 = 2.41,
Using the same method, calculations were performed for each process parameters level and the response tables were generated for MRR as shown in Table III and for SR as
[image:5.612.324.565.121.268.2]shown in Table IV.
Table III:
Response Table for mean cutting speed: (Larger is better).
Level A B C D E
1 2.974 1.373 2.410 3.012 2.692
2 2.422 1.657 2.608 2.790 2.553
3 - 5.065 3.077 2.293 2.850
Table IV:
Response Table for mean surface roughness: (Smaller is better).
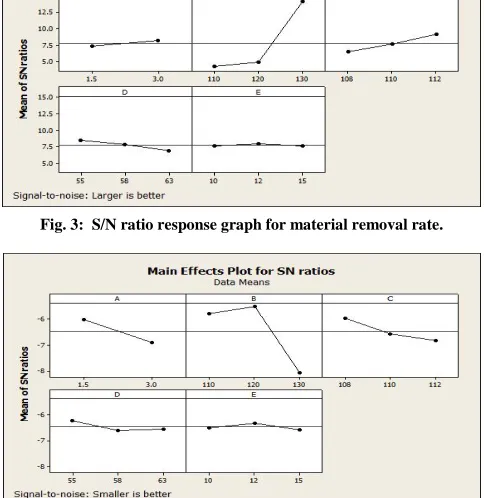
The optimum parameters combination for MRR and SR are A1B3C3D1E3 and A2B1C1D3E3 corresponding to the largest values of S/N ratio for all control parameters. Fig.3 and Fig. 4 shows the S/N ratio plots for MRR and SR.
Fig. 3: S/N ratio response graph for material removal rate.
Fig. 4: S/N ratio response graph for surface roughness.
3.1. Estimation of Optimum Response Characteristics
The optimal values of the response characteristics (material removal rate and surface roughness) along with their respective confidence intervals have been predicted in this section. The results of confirmation experiments are also presented to validate the predicted optimal results. The optimal value of each response characteristic is predicted considering the effect of the significant parameters only. The average values of the response characteristics obtained through the confirmation experiments must lie within the 95% confidence interval, CICE (confidence intervals of confirmation experiments). The Taguchi approach for predicting the mean of response characteristics and determination of confidence intervals for the predicted means has been presented in section.
Level A B C D E
1 2.343 1.773 2.012 2.245 2.168
2 2.010 2.063 2.112 2.222 2.235
[image:5.612.323.565.152.401.2] [image:5.612.48.289.367.488.2]International Journal of Emerging Technology and Advanced Engineering
[image:6.612.45.291.136.445.2]Website: www.ijetae.com (ISSN 2250-2459, ISO 9001:2008 Certified Journal, Volume 5, Issue 4, April 2015)
Table V:
Results of analysis of variance (ANOVA) for MRR
Source DF Sq SS Adj SS Adj MS
F-Value
P-Value
A 1 1.3727 1.3723 1.3723 6.18 0.038
B 2 50.6508 50.6508 25.3254 114.11 0.000
C 2 1.4062 1.4062 0.7031 3.17 0.097
D 2 1.6236 1.6236 0.8118 3.66 0.074
E 2 0.2644 0.2644 0.1322 0.60 0.574
Error 8 1.7754 1.7754 0.2219
Total 17 57.0928
[image:6.612.42.296.384.608.2]S=0.471095, R-sq=96.89%, R-sq (adj) =93.39%
Table VI
Results of analysis of variance (ANOVA) for SR:
S = 0.220221, R-Sq = 91.04%, R-Sq (adj) =80.96%s
The optimum value of material removal Rate (MRR) is predicted at the optimal levels of significant variables which have already been selected as taper angle (A1), peak current (B3), pulse on time (C3), pulse off time (D1) and dielectric flow rate (E3).
The estimated mean of the response characteristic (MRR) can be determined as:
µMRR = {(A1 + B3 + C3 + D1 + E3) - 4(μ)}
= {(2.974 + 5.065 + 3.077 + 3.012 + 2.850) - 4(2.698)}
= 16.978 - 10.792 = 6.186 mm/min
Where,
μ = overall mean of MRR = (ΣR)/18 = 2.698,
Similarly, The optimum value of surface roughness (SR) is predicted at the optimal levels of significant variables which have already been selected as taper angle (A2), peak current (B1), pulse on time (C1), pulse off time (D3) and dielectric flow rate (E3). The estimated mean of the response characteristic (MRR) can be determined as:
µSR = {(A2 + B1 + C1 + D3 + E3) - 4µ}
= (2.002 + 1.762 + 2.0 + 2.052 + 2.115) - (4 × 2.19)
= 9.931 - 9.74 = 1.17µm
Where µ = ΣR1 + ΣR2 /36 = 2.19,
And R1 and R2 values are taken from table 2 and A1, B1, C1, D3 and E3 from table IV.
The 95 % confidence intervals of confirmation experiments (CICE) are calculated as:
For MRR:
= 1.355
Where, f is found from the ANNOVA table
ηeff = 18 / (1 + 9) =1.8
Where, N = Total number of experiment = 18
Ve = Error of Adj MS = 0.2219 (Table V)
fe = Error DOF = 8 (Table V)
F0.05 (1, 8) = 5.32 (Tabulated F value
Research Methodology R Kothari)
So the confidence interval is 4.831≤ µMRR ≤ 7.541.
For SR:
= 0.379
Source DF Sq SS Adj SS Adj MS
F-Value
P-Value
A 1 0.5236 0.5236 0.5236 10.80 0.011
B 2 2.7118 2.7118 1.3559 27.96 0.000
C 2 0.5297 0.5297 0.2648 5.46 0.032
D 2 0.1336 0.1336 0.0668 1.38 0.306
E 2 0.0433 0.0433 0.0216 0.45 0.654
Error 8 0.3879 0.3879 0.0485
International Journal of Emerging Technology and Advanced Engineering
Website: www.ijetae.com (ISSN 2250-2459, ISO 9001:2008 Certified Journal, Volume 5, Issue 4, April 2015)
93
Where, f is found from the ANNOVA table
ηeff = 3.272
Where, N = total number of experiment,
Ve = error of Adj MS = 0.0485 (Table VI)
fe = Error DOF = 8 (Table VI)
F0.05 (1, 8) = 5.32 (Tabulated F value
Research Methodology R Kothari)
So the confidence interval is 0.791≤ µSR ≤ 1.549
IV. CONFIRMATION EXPERIMENT
[image:7.612.41.296.473.657.2]In order to validate the results obtained, three confirmation experiments were conducted for each of the response characteristics (MRR and SR) at optimal levels of the process variables. The average values of the characteristics were obtained and compared with the predicted values. The results are given in Table VII. The values of MRR & SR obtained through confirmation experiments are within the 95% of CICE of respective response characteristic. It is to be pointed out that these optimal values are within the specified range of process variables. Any extrapolation should be confirmed through additional experiments.
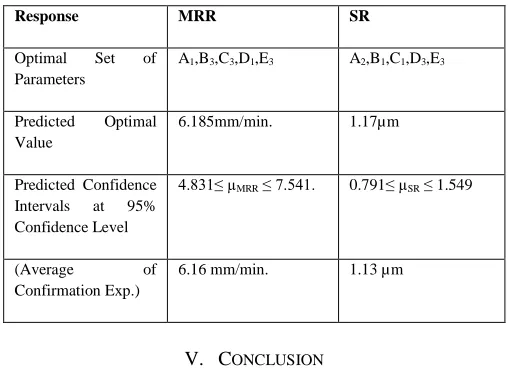
Table VII:
Predicted Optimal Values, Confidence Intervals and Results of Confirmation Experiments.
Response MRR SR
Optimal Set of Parameters
A1,B3,C3,D1,E3 A2,B1,C1,D3,E3
Predicted Optimal Value
6.185mm/min. 1.17µm
Predicted Confidence Intervals at 95% Confidence Level
4.831≤ µMRR ≤ 7.541. 0.791≤ µSR ≤ 1.549
(Average of
Confirmation Exp.)
6.16 mm/min. 1.13 µm
V. CONCLUSION
In the present work, wire electrical discharge machining (WEDM) of titanium alloy (Ti-4.5Al-2V) has been studied. Here Taguchi method has been used for single response optimization.
Taguchi methodology is employed to find out the main parameters that affect the different machining criteria, such as material removal rate, surface roughness and in the present set of study, five control factors have been studied simultaneously to establish the trend of variation of a few important machining criteria with these control factors. From present study, the following conclusions are drawn:
Based on the analysis of variance (ANOVA) results, the highly effective parameters on both the surface roughness and cutting speed were determined.
Using Taguchi method, MRR and SR were optimized individually. Two different optimal settings of process parameters were found for MRR (A1, B3, C3, D1 and E3) and Surface roughness (A2, B1, C1, D3 and E3).
The material removal rate (MRR) is mostly affected by the peak current, pulse-on time, pulse off-time, and taper angle.
The surface roughness values (SR) are influenced mostly by peak current, taper angle, pulse-on time, pulse off-time, and dielectric flow rate.
Acknowledgment
The author‟s acknowledgment Er. Jasvir Singh Tiwana Associate Prof. (Giani Zail Singh PTU, Bathinda, Punjab) for providing their technical advice and guidance during the research work. Also highly thankful to Branch Manager, Ganpati Fastener Pvt. Ltd., Rohtak, Haryana, India, for providing the necessary wire electric discharge machine set-up and other facilities during the research work.
REFERENCES
[1] Benedict, G.F. (1987), “Electrical discharge machining (EDM), nontraditional manufacturing process”, Marcel Dekker, Inc, New York & Basel, 231-232.
[2] Biing Hwa Yan, Hsien Chung Tsai and Fuang Yuan Huang(2005) The effect in EDM of a dielectric of a urea solution in water on modifying the surface of titanium, International Journal of Machine Tools and Manufacture, 2005; 45: 194–200.
[3] Bentley, S.A., Mantle, A.L., Aspin wall, D.K., (1995). The effect of machining on the fatigue strength of a gamma titanium aluminized inter metallic alloy, 1999; 7(8): 967–969.
[4] Danial Ghodsiya (2012) Optimization Material Removal Rate in WEDM Titanium Alloy using the Taguchi Method. Research Journal of Applied Sciences, Engineering & Technology.2012 4(17):3154-3161.
[5] GAO Qing(2008) Parameter optimization model in electrical discharge machining process, Journal of Zhejjan University Science A, 2008; 9(1): 101–108.
International Journal of Emerging Technology and Advanced Engineering
Website: www.ijetae.com (ISSN 2250-2459, ISO 9001:2008 Certified Journal, Volume 5, Issue 4, April 2015)
[7] Hasçalık A., Çaydaş U.(2008) Optimization of turning parameters for surface roughness and tool life based on the Taguchi method, Int. J. Adv. Manuf. Technol., 2008; 38: 896–903.
[8] Hewidy M.S. (2005) Modeling the machine parameters of WEDM of Inconel 601 using RMS, Journal of Material processing Tech.2005; 169,328-336.
[9] Ho, K.H., Newman, S.T., Rahimifard, S., Allen, R.D. (2004), “State of art in wire electrical discharge machining (WEDM)”, International Journal of Machine Tools and Manufacture, 44, 1247-1259.
[10] Jong Hyuk Jung and Won Tae Kwon(2007) Represented paper on optimization of EDM process for multiple performance characteristics using Taguchi method and Grey relational analysis, 2005; 169: 328–336.
[11] Jong Hyuk Jong Jung and Won Tae Kwon (2010) Optimization of EDM process for multiple performance characteristics using Taguchi method and Grey relational analysis. Journal of Mech. Science & Tech., 2010; 24(5): 1083–1090.
[12] Jangra K., Jain A., Grover S.(2010) Optimization of multiple machining characteristics wire electrical discharge machining (WEDM) punching die using Grey relation analysis, Journal of Science & Industrial Research, 2010; 69: 606–612.
[13] Jangra K., Grover S., Aggarwal A.(2011) Digraph and matrix method for the performance evaluation of carbide compacting die manufactured by wire EDM, Journal of Science & Industrial Research. 2011; 54(5-8): 579–591.
[14] Kumar Anish,Kumar Vinod(2012) Prediction of Surface Roughness in WEDM Process based on Response Surface Methodology; InterJ. Of Engg. & Tech.2012; 2049-3444.
[15] Liao, Y.S., Huang, J.T., Su, H.C. (1997), “A Study of machining-parameters Optimization of wire electrical discharge machining”, Journal of Material Processing Technology, 71 , 487-493.
[16] M. Kiyak and O. Çakır (2002) Examination of machining parameters on surface roughness in EDM of tool steel, Journal of Materials Processing Technology, 2007; 191(1-3): 141–144.
[17] Mahapatra S.S. (2007) Optimization of wire electrical discharge machining (WEDM) process parameters using Taguchi method, Int. J. Adv. Manuf. Technol., 2007; 34: 911–925.
[18] Puri, A.B., Bhattacharyya, B (2003). An analysis and optimization of the geometrical inaccuracy due to wire lag phenomenon in WEDM. Int. J. Mach. Tools Manuf., 2003; 43(2): 151–159.
[19] Puri, A.B., Bhattacharyya, B. (2003) Modeling and analysis of the wire tool vibration in wire-cut EDM. Int. J. Mater. Process. Technol. 2003; 143(3): 295–301.
[20] S. Sarkar(2008) Modeling and optimization of wire electrical discharge machining of γ_-TiAl in trim cutting operation, Journal of Materials Processing Technology, 2008; 205: 376–387.
[21] Shabagard M.R.(2009) Mathematical Modeling of Machining Parameters in Electrical Discharge Machining of FW4 Welded Steel, World academy of Science, Tech. & Engg., 2009; 52: 403-409 [22] XIE Bao-Cheng, Wang Yu-kui (2011) Numerical simulation of
![Fig.1: Diagram of the Basic Principle of WEDM Process [Kamal Jangra, Sandeep Grover, 2011]](https://thumb-us.123doks.com/thumbv2/123dok_us/8701376.879606/2.612.325.569.507.683/diagram-basic-principle-process-kamal-jangra-sandeep-grover.webp)