World Journal of Nano Science and Engineering, 2016, 6, 165-176 http://www.scirp.org/journal/wjnse
ISSN Online: 2161-4962 ISSN Print: 2161-4954
Preparation of Electrode of Copper-Nickel
Composite Material and Its Capacitance
Performance
Xiuxia Zhang
1,2*, Chaohui Li
1, Qianyu Ji
11School of Electrical and Information Engineering, Beifang University of Nationalities, Yinchuan, China 2Optoelectronic Information Engineering, Hefei University of Technology, Hefei, China
Abstract
Nickel oxide/copper oxide composites are prepared. Then the composites were trans- ferred into autoclave and thermal sinter under different temperature and different time. As-prepared composites were analyzed by XRD, and it was concluded that with the increase of hydrothermal time, content of NiO and Ni0.75Cu0.25O increases, but
particles become smaller; it would improve the electrochemical activity. By SEM im-ages directed lower crystallinity of composites, deeper porosity and rougher surface would have better electrochemical activity. The electrochemical performance was in-vestigated by cyclic voltametry, AC impedance and galvanostatic charge-discharge. All results show that under the condition of 150˚C 30 h, the electrochemical perfor-mance is the best. The specific capacitance was 225.67 F∙g−1 at the charge-discharge
current of 1 A∙g−1.
Keywords
Hydrothermal Method, Nickle Oxide, Copper Oxide, Composites, Capacitance
1. Introduction
Supercapacitor has higher power density compared with better battery, and has higher specific capacity and energy density compared with better conventional capacitor [1] [2], and mainly used in aerospace, computers, electric toys and other fields [3] [4]. Carbon materials, metal oxides and their composites, conductive polymers and other materials were used in ultracapacitors [5][6][7][8]. Meng prepared graphite oxide by Hummers, then synthesis grapheme-zinc oxide by solvothermal method; the specific capacity was only 9 F·g−1 at a current density of 1·g−1[9]. Using RuO2 in ultracapaci-How to cite this paper: Zhang, X.X., Li,
C.H. and Ji, Q.Y. (2016) Preparation of Electrode of Copper-Nickel Composite Ma- terial and Its Capacitance Performance. World Journal of Nano Science and Engi-neering, 6, 165-176.
http://dx.doi.org/10.4236/wjnse.2016.64015
Received: October 14, 2016 Accepted: December 20, 2016 Published: December 23, 2016
Copyright © 2016 by authors and Scientific Research Publishing Inc. This work is licensed under the Creative Commons Attribution International License (CC BY 4.0).
http://creativecommons.org/licenses/by/4.0/
tors, specific capacitance could reach 551 F/g. But the very expensive costs of RuO2
would limit its application and development. So, science researcher must seek low cost
metal oxides. Now, MnO2, NiO and CuO Metal oxide composites were used in making
ultracapacitors [7]-[12].
In this paper, copper-nickel oxide was successfully prepared by hydrothermal me-thod. In 6 mol/L KOH electrolyte, the specific capacitance was 225.67 F∙g−1 at the
charge-discharge current of 1 A∙g−1 and induced charge transfer resistance (Rct) and
diffusion impedance (Warburg impedance) [10][11] were relatively low.
2. Experiment
2.1. Preparation of Electrode
The amount of 0.5 mol/L CuCl2 solution 5 mL and 0.5 mol/L NiCl2 solution 15 mL
mixed in a beaker, then, weigh 1 mol/L NaOH solution 20 mL, at 60˚C water bath magnetic stirring the pot, titration 40 minutes, then transferred to the reaction vessel, the degree of filling is 80%. Under the condition of 150˚C, respectively reflect 10 h, 20 h, 30 h. Under the condition of 135˚C, 150˚C, reflect 30 h. The hydrothermal sample with distilled water and absolute ethanol washed six times, 90˚C in blast oven dried 6 hours, then the dried sample was placed in a muffle furnace 300˚C calcined 3 h, finally obtained the active material. The preparation of the active substance, acetylene black (AB), polyvinylidene fluoride (PVDF), the mass ratio of 80:15:5 placed in a beaker, grinding evenly, then added N-methyl-2-pyrrolidone network (NWP), stir into a paste- like. Then the mixture was uniformly coated on a foamed nickel, a coating area of 1 × 1 cm2, under the condition of 90˚C, dried for 12 hours, weighed its quality. Subtracting
the mass of the uncoated nickel foam, the quality of the active substance can be calcu-lated. Finally, under the 10 Mpa pressure, the sample was tablet and placed in 6 mol/L KOH solution and soaked about 24 hours.
2.2. Performance Testing
The test device is a Shimadzu SHIMADZU’s XRD-6000, test conditions: CuKα as a
radiation source target, the tube voltage 30 kV, tube current 50 mA, scanning speed
4˚/min, scanning range (2θ) 10˚ - 80˚. And used Shimadzu SHIMADZU’s SSX-550
scanning electron microscope (SEM) to observe the sample surface morphology, ob-served speed is 5000 times. In this study, the electrochemical analysis test was used Shanghai Chen Hua companies producing CHI604B/630B electrochemical workstation by three-electrode system, the working electrode was an electrode active materials which had prepared, the counter electrode was a platinum electrode, the reference elec-trode was a saturated calomel elecelec-trode.
3. The Analysis of Experimental Data
3.1. The SEM Characterization
X. X. Zhang et al.
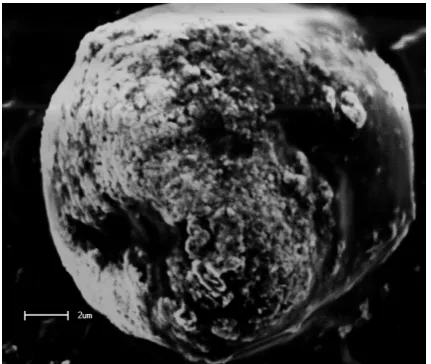
[image:3.595.265.481.294.476.2]Figure 1. SEM image of NiO/CuO composites under 120˚C 30 h.
Figure 2. SEM image of NiO/CuO composites under 135˚C 30 h.
[image:3.595.266.482.506.688.2]Figure 4. SEM image of NiO/CuO composites under 150˚C 10 h.
Figure 5. SEM image of NiO/CuO composites at 150˚C 30 h.
hydrothermal conditions (5000×). As can be seen from the figures, the samples have different degrees of agglomeration. In Figure 3, the sample has poor electrochemical performance, because it with smooth surface and without pores and gully, that may af-fect the embedding and extraction of the electrolyte ion. The agglomeration of Figure 3
is the most obvious among all figures. Compared to Figure 3, Figure 1 and Figure 4
have formed voids. The sample of Figure 5 has a deeper porosity, rougher surface, a relatively low degree of crystallinity. So, it would conclude that the sample in Figure 5
possess best capacitance performance among all samples.
3.2. The Analysis of XRD Phase
X. X. Zhang et al.
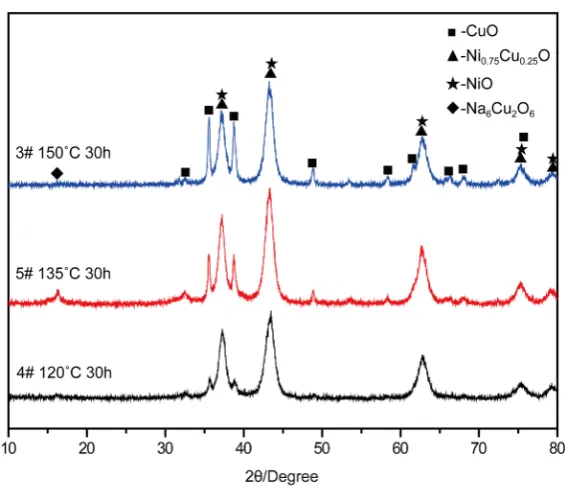
Figure 6. XRD patterns at different hydrothermal times under 150˚C.
Figure 7. XRD patterns at different hydrothermal temperatures in 30 h.
Figure 7 appears Na6Cu2O6, probably because the precipitation did not clean up. At
diffraction angle 2θ of 37.248˚, 43.286˚, 62.852˚, emerge diffraction peaks of NiO and Ni0.75Cu0.25O and at 35.571˚ and 38.726˚, as do CuO. At 150˚C, with the increase of
hy-drothermal time the diffraction peaks of NiO and Ni0.75Cu0.25O become more and more
[image:5.595.231.515.336.579.2]activity would improve [12]. From Figure 7, under the condition of same hydrothermal time (30 h), with the increase of hydrothermal temperature, the diffraction peaks of NiO and Ni0.75Cu0.25O become more and more obvious, and the width of the peak
broaden.
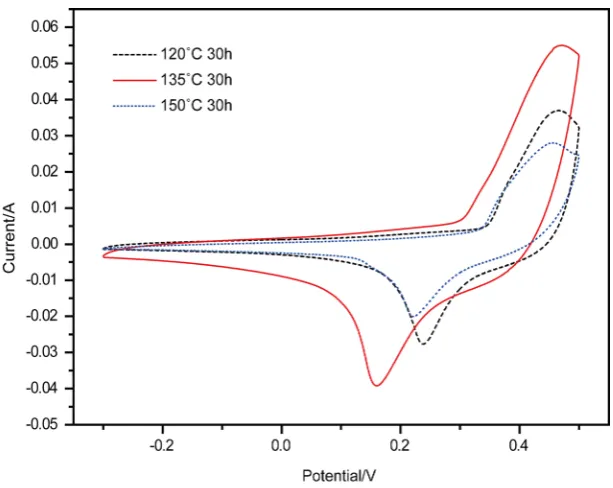
3.3. Cyclic Voltammetry
Cu:Ni = 1:3 30 h at different hydrothermal temperatures and different scanning rates from Figure 8 to Figure 10, at the scanning rate of 50 mv∙s−1, the edox peaks is not
ob-vious, just sweep the reduction peak, the current is the largest. With the reduce of the scanning rates, the redox peak of the three samples become more obvious. The CV curves of Cu:Ni = 1:3 150˚C at different hydrothermal times and different scanning rates. From Figure 11 to Figure 13, with the decrease of scanning rate, redox peaks of three samples become more obvious, and at the hydrothermal condition of 150˚C 30 h, have good electrochemical properties Equations.
3.4. AC Impedance
Figure 14, Figure 15 are the AC impedances of Cu:Ni = 1:3 at different hydrothermal times and different hydrothermal temperatures.
[image:6.595.223.529.459.688.2]AC impedance curve of the sample can be divided into two parts, the high-frequency and low-frequency region area. Intersection of curve and the real axis represent inner electrode impedance (equivalent to Rb), it concludes impedance of electrolyte ions, the intrinsic impedance of the electrode material and contact resistance of Electrically ac-tive material and the current collector. From Figure 9 and Figure 10, intersection value of five samples and the Z’ axis is very small, indicating that the internal impedance is small and almost the same. The semicircle of high frequency region represents induced
X. X. Zhang et al.
[image:7.595.220.530.326.585.2]Figure 9. CV curves of 10 mv∙s−1 scanning rates.
Figure 10. CV curves of 5 mv∙s−1 scanning rates.
charge transfer resistance, frequency image in the embedded thumbnail in Figure 13
Figure 11. CV curves of 50 mv∙s−1 scanning rates.
Figure 12. CV curves of 10 mv∙s−1 scanning rates.
[image:8.595.260.487.498.686.2]X. X. Zhang et al.
[image:9.595.233.519.326.549.2]Figure 14. AC impedance of Cu:Ni = 1:3 150˚C at different hydrothermal times.
Figure 15. AC impedance of Cu:Ni = 1:3, 30 h at different hydrothermal temperatures.
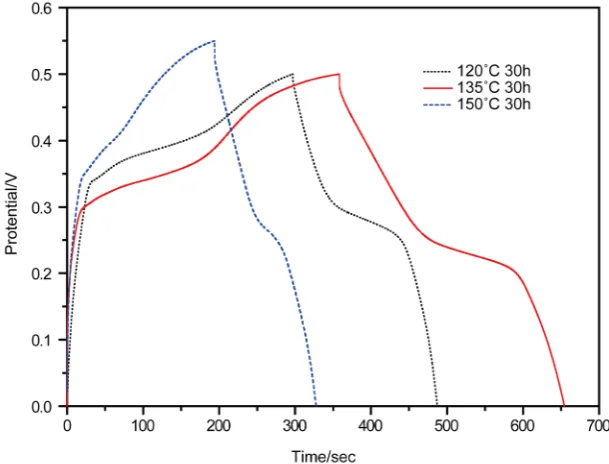
3.5. Constant Current Charge and Discharge Characteristics
Figure 16 to Figure 19 are the charge-discharge curves of Cu:Ni = 1:3 at different hy-drothermal times and different hyhy-drothermal temperatures. From Figure 16 and Fig-ure 17, at the 135˚C has longest charging and discharging time. In 1 A∙g−1 current
den-sity, three sets of samples of the discharge duration will remain at 100 s, while at 135˚C has maximum charging time. Compared to the condition of 1 A∙g−1 current density,
discharge time of 0.5 A∙g−1 current density is the twice. And under the condition of
Figure 16. Charge-discharge curves of Cu:Ni = 1:3 30 h at different hydrothermal temperatures in 1 A∙g−1.
Figure 17. Charge-discharge curves of Cu:Ni = 1:3 30 h at different hydrothermal temperatures in 0.5 A∙g−1.
From Figure 18, at 1 A∙g−1 current density, under the hydrothermal condition of
150˚C 30 h, the charge and discharge time is the longest. At 0.5 A∙g−1 current density,
under the hydrothermal condition of 150˚C 10 h, the charge and discharge time is the
longest, and under the hydrothermal condition of 150˚C 20 h, has the maximum
[image:10.595.221.526.352.584.2]X. X. Zhang et al.
Figure 18. Charge-discharge curves of Cu:Ni = 1:3 30 h at different hydrothermal times in 1 A∙g−1.
Figure 19. Charge-discharge curves of Cu:Ni = 1:3 30 h at different hydrothermal times in 0.5 A∙g−1.
4. Summary
[image:11.595.223.528.334.567.2]peaks are obvious; charge and discharge time is the longest. The specific capacitance was 225.67 F∙g−1 at the charge-discharge current of 1 A∙g−1. Different hydrothermal
time, hydrothermal temperature and heating rate are very important for the growth of sample particle morphology
Acknowledgements
The project was supported by the National Natural Science Foundation of China (51365001).
References
[1] Conway, B.E. (1991) Transition from “Supercapacitor” to “Battery” Behavior in Electro-chemical Energy Storage. Journal of the Electrochemical Society, 138, 1539-1548.
https://doi.org/10.1149/1.2085829
[2] Futaba, D.N., Hata, K., Yamada, T., Hiraoka, T., Hayamizu, Y., Kakudate, Y., Tanaike, O., Hatori, H., Yumura, M. and Iijima, S. (2006) Shape-Engineerable and Highly Densely Packed Single-Walled Carbon Nanotubes and Their Application as Super-Capacitor Elec-trodes. Nature Materials, 5, 987-994. https://doi.org/10.1038/nmat1782
[3] Faggiole, E., Rena, P., Danel, V. and Andrieuc, X. (1999) Supercapacitors for the Energy Management of Electric Vehicles. J. Power Sources, 84, 261-269.
https://doi.org/10.1016/S0378-7753(99)00326-2
[4] Zhang, Z.A. and Deng, M.G. (2003) Characteristics and Applications of Electrochemical Capacitors. Electronic Components & Materials, 22, 1.
[5] Zhang, B.L., Zhao, H., Zhang, X. and Qian, L.J. (2003) Application of Supercapacitor in Hybrid Electric Vehicle. Automobile Research & Development, 5, 48.
[6] Lam, L.T., Newnham, R.H., Ozgun, H. and Fleming, F.A. (2000) Advanced Design of Valve-Regulated Lead-Acid Battery for Hybrid Electric Vehicles. Journal of Power Sources, 88, 92-97. https://doi.org/10.1016/S0378-7753(99)00515-7
[7] Zhang, S.S., Xu, K. and Jow, T.R. (2004) Electrochemical Impedance Study on the Low Temperature of Li-Ion Batteries. Electrochimica Acta, 49, 1057-1061.
https://doi.org/10.1016/j.electacta.2003.10.016
[8] Xu, M.W., Bao, S.J. and Li, H.L. (2007) Synthesis and Characterization of Mesoporous Nickel Oxide for Electrochemical Capacitor. Journal of Solid State Electrochemistry, 11, 372-377. https://doi.org/10.1007/s10008-006-0155-6
[9] Kiani, M.A., Mousavi, M.F. and Ghasemi, S. (2010) Size Effect Investigation on Battery Performance: Comparison between Micro- and Nano-Particles of β-Ni(OH)2 as Nickel
Battery Cathode Material. Journal of Power Sources, 195, 5794-5800.
https://doi.org/10.1016/j.jpowsour.2010.03.080
[10] Wang, X.F. (2003) Preparation of Ultra-Fine Ruthenium Oxide as an Electrode Materials for Electrochemical Capacitors. Chinese Journal of Inorganic Chemistry, 19, 371-375. [11] Cai, T., Zhu, P. and Ren, Z. (2014) Preparation and Performances of RuO2 and Its
Compo-site Electrodes. Micronanoelectronic Technology, 8, 508-511.
[12] Gujar, T.P., Shinde, V.R., Lokhande, C.D., et al. (2007) Spray Deposited Amorphous RuO2
Submit or recommend next manuscript to SCIRP and we will provide best service for you:
Accepting pre-submission inquiries through Email, Facebook, LinkedIn, Twitter, etc. A wide selection of journals (inclusive of 9 subjects, more than 200 journals)
Providing 24-hour high-quality service User-friendly online submission system Fair and swift peer-review system
Efficient typesetting and proofreading procedure
Display of the result of downloads and visits, as well as the number of cited articles Maximum dissemination of your research work
Submit your manuscript at: http://papersubmission.scirp.org/