Report
Target Selection Signals Influence Perceptual
Decisions by Modulating the Onset and Rate of
Evidence Accumulation
Highlights
d Early contralateral and ipsilateral target selection signals are
isolated in human EEG
d Selection signals predict the onset and rate of neural
evidence accumulation
d Selection signals are present even when targets appear in
isolation
d These findings provide novel insights into the function of
the N2pc
Authors
Gerard M. Loughnane,
Daniel P. Newman, Mark A. Bellgrove, Edmund C. Lalor, Simon P. Kelly, Redmond G. O’Connell
Correspondence
In Brief
Loughnane et al. develop a novel EEG paradigm to investigate how the brain makes perceptual decisions in the face of uncertain timing and location of evidence onsets. They show that the brain employs target selection signals that modulate the onset and rate of neural evidence
accumulation and thereby the timing and accuracy of perceptual reports.
Loughnane et al., 2016, Current Biology26, 1–7
February 22, 2016ª2016 Elsevier Ltd All rights reserved
Current Biology
Report
Target Selection Signals Influence
Perceptual Decisions by Modulating
the Onset and Rate of Evidence Accumulation
Gerard M. Loughnane,1,2,*Daniel P. Newman,3Mark A. Bellgrove,3Edmund C. Lalor,1,2,4Simon P. Kelly,5
and Redmond G. O’Connell1,6
1Trinity College Institute of Neuroscience, Trinity College Dublin, Dublin 2, Ireland 2Trinity Centre for Bioengineering, Trinity College Dublin, Dublin 2, Ireland
3School of Psychological Sciences and Monash Institute for Cognitive and Clinical Neurosciences (MICCN), Monash University, Melbourne, VIC 3800, Australia
4School of Engineering, Trinity College Dublin, Dublin 2, Ireland
5School of Electrical and Electronic Engineering, University College Dublin, Dublin 4, Ireland 6School of Psychology, Trinity College Dublin, Dublin 2, Ireland
*Correspondence:[email protected] http://dx.doi.org/10.1016/j.cub.2015.12.049
SUMMARY
Computational and neurophysiological research has highlighted neural processes that accumulate sen-sory evidence for perceptual decisions [1]. These processes have been studied in the context of highly simplified perceptual discrimination paradigms in which the physical evidence appears at times and lo-cations that are either entirely predictable or exoge-nously cued (e.g., by the onset of the stimulus itself). Yet, we are rarely afforded such certainty in everyday life. For example, when driving along a busy motorway, we must continually monitor the move-ments of surrounding vehicles for events that call for a lane change. In such scenarios, it is unknown which of the continuously present information sour-ces will become relevant or when. Although it is well established that evidence integration provides an effective mechanism for countering the impact of noise [2], the question of how this mechanism is implemented in the face of uncertain evidence onsets has yet to be answered. Here, we show that when monitoring two potential sources of informa-tion for evidence occurring unpredictably in both time and space, the human brain employs discrete, early target selection signals that significantly modulate the onset and rate of neural evidence accu-mulation, and thereby the timing and accuracy of perceptual reports. These selection signals share many of the key characteristics of the N2pc compo-nent highlighted in the literature on visual search [3, 4] yet are present even in the absence of distrac-tors and under situations of low temporal and spatial uncertainty. These data provide novel insights into how target selection supports decision making in un-certain environments.
RESULTS AND DISCUSSION
We implemented a series of perceptual paradigms in which continuous visual stimuli were monitored for seamless changes in a single feature. The continuous stimulus presentation ensured that participants could not rely on stimulus appearance to cue evidence onset and also served to eliminate visual-evoked transients from the event-related electroencephalogram (EEG), providing a clear view of the neural dynamics that contribute to decision formation. This paradigm innovation pre-viously enabled us to identify an EEG signal representing a build-to-threshold decision variable (the centro-parietal positiv-ity, or ‘‘CPP’’) whose dynamics predict the timing and accuracy of perceptual reports [5, 6]. Here, we investigated whether early target selection signals play a role in modulating this neural evi-dence accumulation process.
In experiment 1, participants performed a variant of the random dot motion task (RDM; [6–8]) in which they monitored two periph-eral dot kinematograms for intermittent periods of coherent mo-tion occurring equally likely in either patch at unpredictable times (Figure 1A). Irrespective of which patch contained coherent mo-tion, participants indicated the motion direction as quickly as possible via a left-hand button press for upward motion and right-hand press for downward motion. Hit rate (98.3% ± 1.3%) and discrimination accuracy (98.8% ± 1.3%) were close to ceiling while reaction times (RTs) were long and variable (880 ± 102 ms). Higher coherence levels produced significantly faster RTs (845 ms versus 915 ms; t(33) = 20.72, p < 0.001, d = 0.68) but did not affect hit rate or discrimination accuracy.
The CPP decision signal was reliably elicited by coherent mo-tion in both hemifields, exhibiting a gradual, coherence-depen-dent buildup (t(33) =!2.3, p = 0.028, d = 0.22) that peaked at the time of response execution. Consistent with previous work [6, 9], we found that faster RTs were predicted by earlier CPP onset latency and steeper buildup rate (onset: F(3,90) = 6.3, p = 0.003,hp2= 0.17; buildup rate: F(3,99) = 17.6, p < 0.001,
hp2= 0.35;Figure 2A).
Prior to the onset of this decision process, we identified a pair of early negative deflections at lateral occipito-temporal sites,
Current Biology26, 1–7, February 22, 2016ª2016 Elsevier Ltd All rights reserved 1
one over each hemisphere (Figure 1). The earliest of these de-flections (hereafter labeled ‘‘N2c’’) was observed contralateral to the target location with an onset of 170 ms (182 ms before CPP onset). Its ipsilateral counterpart (hereafter ‘‘N2i’’) was smaller (p < 0.001) and had a later onset (308 ms). Analysis of cross-trial variation in N2c/N2i peak latencies indicated that they were significantly more closely aligned to coherent motion onset than response execution (N2c: F(1, 496) = 43.45, p < 0.001; N2i: F(1,524) = 95.72, p < 0.001;Figure 1C), whereas the reverse was the case for the CPP (F(1, 578) = 18.64, p <
0.001). The peak amplitudes of the N2c and N2i increased signif-icantly as a function of coherence (F(1,33) = 10.91, p = 0.002, hp2 = 0.25), while their peak latencies decreased (F(1,33) =
7.64, p = 0.009,hp2= 0.18).
[image:3.603.66.550.98.495.2]To examine whether the N2 signals specifically select for task-relevant information, we manipulated the target-defining stimulus feature in experiment 2. Participants who had never previously performed an RDM task monitored bilateral dot kine-matograms for subtle changes in color. In between these color changes, intermittent periods of coherent motion occurred at
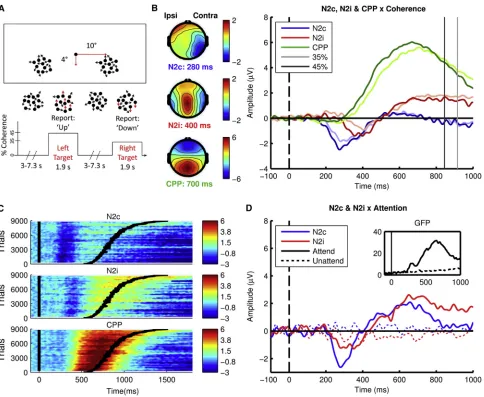
Figure 1. Unpredictable Task-Relevant Feature Changes Elicit a Temporo-occipital Selection Signal Prior to Neural Evidence Accumulation
(A) Experimental setup for the bilateral dots paradigm. Participants fixated on a central dot while monitoring two peripheral patches of randomly moving dots for intermittent periods of coherent motion that could occur in either patch at an unpredictable time.
(B) Topographies and time course of N2c (from contralateral electrodes P7/P8), N2i (from ipsilateral electrodes P7/P8), and CPP (from midline electrodes Pz/POz), locked to stimulus onset, plotted as a function of coherence. Vertical dark and light lines represent mean RT for high and low coherence, respectively. Topographies represent the average of the contralateral hemispheres projected onto the right hemisphere and ipsilateral onto the left hemisphere. See also
Figure S3.
(C) Surface plots of N2c, N2i, and CPP pooled across participants and sorted in ascending order according toZ-scored RT, smoothed using a Gaussian moving window of 100 trials. Curved black line represents RT.
(D) Waveforms from N2c and N2i electrodes elicited by task-relevant color target stimuli (‘‘Attend’’) and task-irrelevant coherent motion (‘‘Unattend’’). Inset is the global field power (GFP) to color targets and motion non-targets, demonstrating the absence of any response to coherent motion when unattended. See also
Figure S2.
2 Current Biology26, 1–7, February 22, 2016ª2016 Elsevier Ltd All rights reserved
the same rate and levels as in experiment 1 but were inci-dental to the task requirements, and participants later reported being unaware of them. Whereas the N2c, N2i, and CPP were not elicited by the task-irrelevant coherent motion, all three signals were elicited by task-relevant color changes (Figure 1D). Note that the polarity, topography, latency, contra-lateral dominance, and contingency on task relevance of these deflections are highly consistent with the ‘‘N2pc’’ compo-nent characterized in studies of visual search ([3, 4]; see discussion).
To probe the relationship between the N2 signals and behavior, trials were sorted by RT and divided into four equal-sized bins. N2c amplitude was significantly larger prior to faster RTs, but N2i amplitude was insensitive to RT (interaction: F(3,99) = 3.13, p = 0.03,hp2= 0.09, driven by a significant effect
of RT on N2c, F(3,99) = 8.19, p < 0.001,hp2 = 0.2, and not
N2i, p = 0.8). Within-subject regressions confirmed that these group-level trends were represented at the individual subject level (Figure S1). Thus, under bilateral viewing conditions, RT was most strongly predicted by the amplitude of the selection signal contralateral to the target location (N2c) in keeping with
the contralateral dominance effects reported in research on visuo-spatial orienting [10].
Next, we investigated whether the N2c’s impact on perfor-mance could be explained by its influence on evidence accumu-lation. We first examined whether the timing of the N2c predicted the CPP’s onset and hence RT. To limit the potential influence of volume conduction between relevant electrodes, we trans-formed all signals to current source density [11]. Single-trial CPP waveforms and RTs were sorted according to N2c peak latency and divided into two equal-sized bins. Comparisons across bins (Figure 2B) confirmed that an earlier N2c predicted earlier CPP onset (320 versus 353 ms; t(32) =!2.8, p = 0.008, d = 0.28) and faster RT (858 ms versus 897 ms; t(32) =!7.28, p < 0.001, d = 0.37).
[image:4.603.92.506.99.419.2]Mediation analysis of single-trial data further revealed that the effect of N2c amplitude on RT was partially mediated through changes in CPP buildup rate (Figure 2A). At the time points with strongest overall mediation effects, all constituent predic-tive relationships in the mediation model were significant (N2c predicts CPP buildup rate,a=!0.073, p < 0.001; CPP buildup rate predicts RT, b = !0.096, p < 0.001; N2c predicts RT
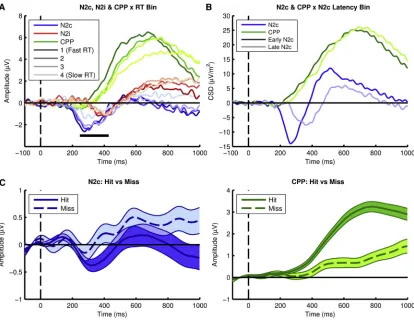
Figure 2. Early Target Selection Signals Predict Decision Time and Successful Detection by Modulating the Onset and Buildup Rate of the Neural Evidence Accumulation Process
(A) Stimulus-locked N2c, N2i, and CPP divided into fastest to slowest RT bins. The black horizontal marker beneath the waveforms represent the time points of the CPP at which the trial-by-trial effect of N2c peak amplitude on RT was significantly mediated by CPP slope, at a two-tailed permuted significance level of 0.01. Each time point represents the midpoint of a sliding 200-ms CPP slope measurement window. See alsoFigure S1.
(B) CPP and N2c waveforms plotted as a function of N2c latency demonstrating that earlier CPP onsets were preceded by earlier N2c peaks.
(C) N2c and CPP for detected (hit) versus undetected (miss) coherent motion. Shaded areas represent 1 SE around the mean waveform at each time point.
Current Biology26, 1–7, February 22, 2016ª2016 Elsevier Ltd All rights reserved 3
independent of CPP buildup rate,c= 0.049, p < 0.001). An addi-tional mediation analysis using response-aligned CPP buildup measurements indicated that the effect persisted beyond the time interval for N2c measurement ("610 ms).The same relation-ships were observed for color targets (experiment 2;Figure S2). We previously showed that undetected targets are associated with a lower-amplitude CPP, reflecting failure to reach a decision threshold [5]. If the N2 does indeed influence decision formation via its influence on CPP buildup, then failure to detect motion tar-gets at all (let alone report direction correctly) should be associ-ated also with reduced N2 amplitude. Experiment 3 tested for such a relationship using another RDM variant where partici-pants simply detected downward-motion targets. Coherence levels were individually titrated to maintain performance at an average hit rate of 81%. N2c amplitude was significantly greater (t(42) =!2.33, p = 0.024, d = 0.4), and CPP buildup faster (t(42) = 6.27, p < 0.001, d = 1.37), prior to successful target detection (Figure 2C). Having established these relationships, we conduct-ed further experiments to investigate the function of the N2.
Explanatory models of previously reported target selection signals, such as the N2pc, disagree on whether these signals are involved in the suppression of distractors or the selection of task-relevant information [3, 12–14]. This question could be readily addressed here by manipulating the requirement to simultaneously monitor two competing stimuli. In experiment 4, a new group of participants performed the RDM under two blocked conditions, involving either two peripheral patches or a single patch in either the left or right hemifield.
There was no significant difference between the bilateral versus unilateral conditions in RT (637 ms versus 647 ms, t(14) = !1.05, p = 0.3) or hit rate (99% versus 99%, t(14) = 0.74, p = 0.48), likely due to the high coherence level employed (45%). Despite the certainty regarding evidence location and the absence of any distracting stimuli, the N2c and N2i were reli-ably elicited in the unilateral condition, albeit with a 20% smaller amplitude (F(1,14) = 4.9, p = 0.044,hp2= 0.26) and an earlier N2i
peak latency (interaction: F(1,14) = 5.07, p = 0.041,hp2= 0.27;
driven by N2i latency difference: t(14) =!3.4, p = 0.004, d = 0.84;Figure 3A).
Given that the primary function of target selection signals is generally regarded to be the localization of relevant peripheral stimuli, it is noteworthy that they were strongly present in this experiment despite there being no apparent need for spatial localization. However, since participants were centrally fixating, the presentation of a peripheral stimulus may still have encour-aged the orienting of spatial attention to that object, and it has been suggested that suppression might be required even for vi-sual locations known not to contain distracting objects [15]. We therefore tested for the presence of target selection signals in a task where the incentive to orient attention in space was fully removed. In experiment 5, we re-examined data from a study in which participants monitored a single kinematogram at fixa-tion for leftward versus rightward mofixa-tion [6]. Consistent with the preceding experiments, CPP onset was accompanied by N2 signals over both hemispheres, although in this case their onset was simultaneous (Figure 3B). The amplitude and latency of this bi-hemispheric N2 (hereafter ‘‘N2b’’) varied with coher-ence (amplitude: F(3,54) = 12.33, p < 0.001,hp2= 0.41; latency:
F(3,54) = 8.57, p < 0.001,hp2= 0.32) and predicted RT
(ampli-tude: F(3,54) = 4.33, p = 0.008, hp2 = 0.19; latency: F(3,54) =
5.01, p = 0.004,hp2= 0.22). A mediation analysis again indicated
that the effect of N2b amplitude on RT was partially mediated by CPP buildup rate (Figure 3C), while all other model paths were significant. Earlier N2b peak latency also predicted both faster RTs (680 ms versus 732 ms; t(17) =!7.7, p < 0.001, d = 0.58) and earlier CPP onsets (249 versus 286 ms; t(17) =!3.98, p = 0.001, d = 0.64; see Figure 3D). Thus, the N2 predicted RT even in the absence of distractor stimuli and spatial orienting requirements.
The foregoing findings suggest a primary role for target selection signals in marking the onset of relevant evidence. One might intuit that such a function could only be useful in situations of either great spatial or temporal uncertainty. In experiment 6, we sought to test whether the N2 is invoked in a task with minimal uncertainty regarding sensory evidence on-sets. Participants here performed an RDM in which coherent motion occurred at a fixed time following stimulus onset, with pre-cues specifying the location of the forthcoming evidence. Again, the contralateral and ipsilateral N2 components were clearly observed (Figure 3E).
Our results reveal that whether monitoring multiple information sources or a single stimulus at fixation, early target selection sig-nals influence the timing and accuracy of perceptual reports by modulating the onset and rate of the neural evidence accumula-tion process. Our study builds on an extensive literature exam-ining the role of target selection signals in the context of visual search [12, 16–18]. Although this previous work has demon-strated that selection signals facilitate the localization of target stimuli among interfering distractors, efforts to account for perceptual decisions based on multiple continuously present in-formation streams have tended to invoke alternative mecha-nisms, such as a continuous division of processing resources [19]. However, the present study reveals that target selection mechanisms play a far more general role in decision formation than previously thought.
Our use of seamless sensory transitions was critical in establishing these relationships since it allowed us to isolate a discrete neural signal for target selection that could be measured at the single-trial level alongside an independent accumulation-to-bound decision process. Direct relationships with behavior have never before been established for human target selection signals, including the N2pc, possibly due to the reliance on cross-condition subtractions (e.g., target-present versus target-absent trials) to distinguish target-selective signals from those evoked by the sudden array onsets. We have gone further than establishing that target selection signals affect behavior by also uncovering how they do so, in terms of their in-fluence on the onset and rate of decision variable buildup. Further investigation will be required to establish whether selec-tion signals influence evidence accumulaselec-tion rate by modulating early sensory processing [20] and/or by re-weighting task-rele-vant sensory signals at the decision level [21].
Our data call for explicit inclusion of target selection mecha-nisms in models that, beyond providing quantitative accounts of RT data, are intended to accurately describe physiological mechanisms, especially as the behavioral contexts under study shift toward real life scenarios. While some model variants [22] within the sequential sampling framework assume that the
4 Current Biology26, 1–7, February 22, 2016ª2016 Elsevier Ltd All rights reserved
mean rate of accumulation (‘‘drift rate’’) on a given trial is deter-mined purely by the evidence strength itself, others allow for additional, ‘‘extra-stimulus’’ influences of unknown origin (e.g., drift rate variability; [23, 24]). The current results support the ex-istence of such extra-stimulus influences, although direct links between the N2 and specific model parameters remain to be explored. Our neurophysiological results appear broadly consis-tent with recently proposed computational models that invoke multiple processing stages for decision making [25, 26]. For example, one prominent model proposes that a first stage
accu-mulates noisy sensory evidence for detection and provides the input to a subsequent linear rise-to-threshold decision stage [26]. However, the coherence-dependent buildup rate of the CPP is at odds with the evidence-independent rise of this model’s second stage. The question of whether the N2 is itself an evidence accumulation process, similar to the first stage of the two-stage model, awaits further investigation.
[image:6.603.87.508.96.541.2]The N2 signals reported here bear many similarities to the classic ‘‘N2pc’’ component, which has been the subject of inten-sive investigation in human and non-human primate studies of
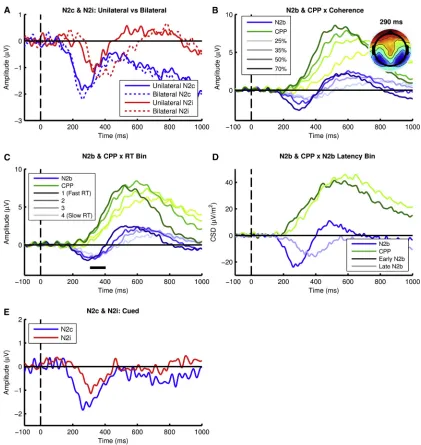
Figure 3. Target Selection Signals Are Not Contingent on the Spatial or Temporal Uncertainty of Sensory Evidence Onsets
(A) N2c and N2i signals elicited by coherent motion when participants monitored a unilateral stimulus versus bilateral stimuli. (B) N2b and CPP plotted by coherence. Inset: scalp topography of the N2b at peak.
(C) N2b plotted as a function of RT bin. Black marker beneath the waveforms represents the time points over which the trial-by-trial effect of N2b peak amplitude on RT was significantly mediated by CPP slope, at a two-tailed permuted significance level of 0.01.
(D) N2b and CPP signals plotted as a function of N2b peak latency demonstrating earlier CPP onset for earlier N2b peak.
(E) N2c and N2i components were observed even when the timing of coherent motion was fixed and its location indicated by a preceding cue.
Current Biology26, 1–7, February 22, 2016ª2016 Elsevier Ltd All rights reserved 5
visual search. Both the N2 and N2pc have a temporo-occipital topography, are elicited by goal-relevant events, scale with the salience of the target event [17, 27], are maximal over scalp re-gions contralateral to the target stimulus, and share a similar latency [12, 15, 17]. Consistent with the sensitivity of the N2pc to set size [13], we also found that the N2 signals were larger in amplitude when participants monitored more than one stimulus. Indeed, application of the same cross-condition subtraction used classically to measure the N2pc revealed a time course very similar to the N2pc and again highlighted the novel finding of its scaling with RT (Figure S3).
Our ability to measure neural signals for target selection in isolation and at the single-trial level allowed us to gain novel in-sights into their much-debated functional significance. Due to the presence of overlaid visual responses, past studies have not been able to determine whether the N2pc represents a func-tionally discrete selection signal or a modulation of early sensory components. Here, we show for the first time that the character-istic dynamics of the N2pc difference wave reflect the activity of two discrete neural signals, one generated in each hemisphere with a relative ipsilateral delay. This observation has important implications for future research investigating the impact of abnormal target selection on perceptual and cognitive function [10, 28–30].The N2i, like the N2c, was sensitive to coherence and was observed even under unilateral monitoring conditions. This points to the ipsilateral hemisphere also playing a role in target selection but one that was not sufficiently prominent to drive a statistically significant relationship with behavior. Although it is difficult at present to surmise the origins of this ipsilateral component, single-unit recordings have identified extrastriate and parietal visual neurons that are responsive to ipsilateral space [31–33]. With the capability to isolate ipsilateral from contralateral components of target selection, future work may be able to delve deeper into the many interesting effects previously observed for the N2pc, particularly those related to the salience, proximity, numerosity, and target similarity of distractors.
Current explanatory accounts disagree regarding whether the N2pc facilitates target localization by inhibiting processing of distractor stimuli [3] or by enhancing target processing [4, 13], and our findings provide strong evidence in favor of the latter interpretation. At the same time, we show that this role is not limited to scenarios that require target localization but general-izes to the processing of isolated goal-relevant sensory events. To conclude, our data demonstrate that target selection mechanisms contribute critically to human decision making. That these selection mechanisms operate irrespective of tempo-ral or spatial uncertainty may help to explain the remarkable hu-man capacity for decision making in inherently complex and noisy environments.
EXPERIMENTAL PROCEDURES
A description of the essential experimental and data analytical procedures is presented in theResults and Discussion. A complete description can be found in theSupplemental Experimental Procedures. All participants gave written informed consent, and all procedures were approved by the ethical review boards at the site of data collection for each task—either the School of Psy-chology in Trinity College Dublin (experiments 1, 2, 5, and 6) or the School of Psychological Sciences in Monash University Melbourne (experiments 1, 3,
4, and 6). Ethical guidelines were in accordance with the Declaration of Helsinki.
SUPPLEMENTAL INFORMATION
Supplemental Information includes Supplemental Experimental Procedures and three figures and can be found with this article online athttp://dx.doi. org/10.1016/j.cub.2015.12.049.
AUTHOR CONTRIBUTIONS
The studies were conceived and the experiments were designed by G.M.L., D.P.N., S.P.K., and R.G.O. S.P.K. programmed the original task, and amend-ments for other tasks were made by G.M.L. and D.P.N. G.M.L. and R.G.O. analyzed the data. G.M.L., D.P.N., M.A.B., E.C.L., S.P.K., and R.G.O. wrote the manuscript.
ACKNOWLEDGMENTS
This study was supported by grants from the United States National Science Foundation (BCS-1358955 to S.P.K. and R.G.O.), European Research Council (63829 to R.G.O.), Science Foundation Ireland (09-RFP-NES2382 to E.C.L.), and the Australian Research Council (FT130101488; DP 150100986 to M.A.B.). The authors thank Fiona Desmond, Roisin White, Ana Carina Pamplona, Rafael Abe, and Marco Tulio Ramalho Zoratti for help with data collection.
Received: September 10, 2015 Revised: November 6, 2015 Accepted: December 14, 2015 Published: February 4, 2016
REFERENCES
1.Shadlen, M.N., and Kiani, R. (2013). Decision making as a window on cognition. Neuron80, 791–806.
2.Bogacz, R., Brown, E., Moehlis, J., Holmes, P., and Cohen, J.D. (2006). The physics of optimal decision making: a formal analysis of models of performance in two-alternative forced-choice tasks. Psychol. Rev.113, 700–765.
3.Luck, S. (2012). Electrophysiological correlates of the focusing of attention within complex visual scenes: N2pc and related ERP components. In The Oxford Handbook of Event-Related Potential Components, S. Luck, and E. Kappenman, eds. (Oxford University Press), pp. 329–360.
4.Eimer, M. (2014). The time course of spatial attention: insights from event-related brain potentials. In The Oxford Handbook of Attention, 1 Edition, A. Nobre, and S. Kastner, eds. (Oxford University Press), pp. 289–317. 5.O’Connell, R.G., Dockree, P.M., and Kelly, S.P. (2012). A supramodal
accumulation-to-bound signal that determines perceptual decisions in hu-mans. Nat. Neurosci.15, 1729–1735.
6.Kelly, S.P., and O’Connell, R.G. (2013). Internal and external influences on the rate of sensory evidence accumulation in the human brain. J. Neurosci.
33, 19434–19441.
7.Newsome, W.T., Britten, K.H., and Movshon, J.A. (1989). Neuronal corre-lates of a perceptual decision. Nature341, 52–54.
8.Britten, K.H., Newsome, W.T., and Saunders, R.C. (1992). Effects of infe-rotemporal cortex lesions on form-from-motion discrimination in mon-keys. Exp. Brain Res.88, 292–302.
9.Twomey, D.M., Murphy, P.R., Kelly, S.P., and O’Connell, R.G. (2015). The classic P300 encodes a build-to-threshold decision variable. Eur. J. Neurosci.42, 1636–1643.
10.Corbetta, M., and Shulman, G.L. (2011). Spatial neglect and attention net-works. Annu. Rev. Neurosci.34, 569–599.
11.Kayser, J., and Tenke, C.E. (2006). Principal components analysis of Laplacian waveforms as a generic method for identifying ERP generator
6 Current Biology26, 1–7, February 22, 2016ª2016 Elsevier Ltd All rights reserved
patterns: I. Evaluation with auditory oddball tasks. Clin. Neurophysiol.117, 348–368.
12.Eimer, M. (1996). The N2pc component as an indicator of attentional selectivity. Electroencephalogr. Clin. Neurophysiol.99, 225–234. 13.Mazza, V., Turatto, M., and Caramazza, A. (2009). Attention selection,
dis-tractor suppression and N2pc. Cortex45, 879–890.
14.Hickey, C., McDonald, J.J., and Theeuwes, J. (2006). Electrophysiological evidence of the capture of visual attention. J. Cogn. Neurosci. 18, 604–613.
15.Luck, S.J., and Hillyard, S.A. (1994). Spatial filtering during visual search: evidence from human electrophysiology. J. Exp. Psychol. Hum. Percept. Perform.20, 1000–1014.
16.Schall, J.D., and Hanes, D.P. (1993). Neural basis of saccade target selec-tion in frontal eye field during visual search. Nature366, 467–469. 17.Luck, S.J., and Hillyard, S.A. (1994). Electrophysiological correlates of
feature analysis during visual search. Psychophysiology31, 291–308. 18.Schall, J.D. (2013). Macrocircuits: decision networks. Curr. Opin.
Neurobiol.23, 269–274.
19.Wyart, V., Myers, N.E., and Summerfield, C. (2015). Neural mechanisms of human perceptual choice under focused and divided attention. J. Neurosci.35, 3485–3498.
20.Treue, S., and Maunsell, J.H. (1996). Attentional modulation of visual mo-tion processing in cortical areas MT and MST. Nature382, 539–541. 21.Law, C.T., and Gold, J.I. (2008). Neural correlates of perceptual learning in
a sensory-motor, but not a sensory, cortical area. Nat. Neurosci.11, 505–513.
22.Palmer, J., Huk, A.C., and Shadlen, M.N. (2005). The effect of stimulus strength on the speed and accuracy of a perceptual decision. J. Vis.5, 376–404.
23.Ratcliff, R., Van Zandt, T., and McKoon, G. (1999). Connectionist and diffu-sion models of reaction time. Psychol. Rev.106, 261–300.
24.Brown, S.D., and Heathcote, A. (2008). The simplest complete model of choice response time: linear ballistic accumulation. Cognit. Psychol.57, 153–178.
25.Purcell, B.A., Schall, J.D., Logan, G.D., and Palmeri, T.J. (2012). From salience to saccades: multiple-alternative gated stochastic accumulator model of visual search. J. Neurosci.32, 3433–3446.
26.Carpenter, R.H.S., Reddi, B.A.J., and Anderson, A.J. (2009). A simple two-stage model predicts response time distributions. J. Physiol.587, 4051– 4062.
27.To¨llner, T., Zehetleitner, M., Gramann, K., and Mu¨ller, H.J. (2011). Stimulus saliency modulates pre-attentive processing speed in human visual cor-tex. PLoS ONE6, e16276.
28.Lorenzo-Lo´pez, L., Amenedo, E., and Cadaveira, F. (2008). Feature pro-cessing during visual search in normal aging: electrophysiological evi-dence. Neurobiol. Aging29, 1101–1110.
29.Schiff, S., Mapelli, D., Vallesi, A., Orsato, R., Gatta, A., Umilta`, C., and Amodio, P. (2006). Top-down and bottom-up processes in the extrastriate cortex of cirrhotic patients: an ERP study. Clin. Neurophysiol.117, 1728– 1736.
30.Robertson, I.H. (2001). Do we need the ‘‘lateral’’ in unilateral neglect? Spatially nonselective attention deficits in unilateral neglect and their impli-cations for rehabilitation. Neuroimage14, S85–S90.
31.Desimone, R., Moran, J., Schein, S.J., and Mishkin, M. (1993). A role for the corpus callosum in visual area V4 of the macaque. Vis. Neurosci.10, 159–171.
32.Tootell, R.B., Mendola, J.D., Hadjikhani, N.K., Liu, A.K., and Dale, A.M. (1998). The representation of the ipsilateral visual field in human cerebral cortex. Proc. Natl. Acad. Sci. USA95, 818–824.
33.Ben Hamed, S., Duhamel, J.-R., Bremmer, F., and Graf, W. (2001). Representation of the visual field in the lateral intraparietal area of ma-caque monkeys: a quantitative receptive field analysis. Exp. Brain Res.
140, 127–144.
Current Biology26, 1–7, February 22, 2016ª2016 Elsevier Ltd All rights reserved 7
CURBIO, Volume
26
Supplemental Information
Target Selection Signals In
fl
uence
Perceptual Decisions by Modulating
the Onset and Rate of Evidence Accumulation
Supplemental Figures
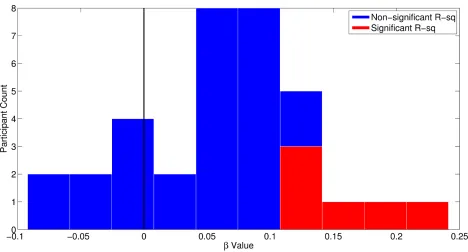
Figure S1. Related to Figure 2A: Histogram of beta coefficients generated from within-subjects single-trial
regressions of N2c amplitude onto RT. Unsurprisingly, given the noisy nature of single-trial EEG data only a minority
of participants showed statistically significant regression equations but the histogram confirms that the overwhelming
majority had beta coefficients in the same direction as the group level effect. This pattern was formally confirmed by
[image:10.612.72.540.114.366.2]Figure S2. Related to Figure 1D: N2c and CPP waveforms elicited by colour changes in Experiment 2 plotted
separately for fast and slow RT bins. Given the N2c’s sensitivity to coherent motion, it is possible that the apparently
evidence-independent variation in its amplitude is in fact driven by random fluctuations in motion energy. To examine
this possibility we conducted an additional single-trial mediation analysis on the data from Experiment 2 in which
participants were responding to changes in stimulus colour. The analysis confirmed the same patterns reported for
Experiment 1 - N2c amplitude predicted RT and this relationship was mediated by CPP build-up rate (ab=0.0097,
p=0.048). The other three mediation paths were also significant: N2c predicted CPP build-up rate, a=-0.106, p=0.002;
CPP build-up rate predicted RT, b=-0.092, p=0.007; N2c predicted RT independent of CPP build-up rate, c=0.073,
[image:11.612.71.538.92.340.2]Figure S3. Related to Figure 1B: On the left, N2 signals in Experiment 1 plotted separately for left and right cerebral
hemispheres as a function of target hemifield. Irrespective of hemisphere, the amplitude of the N2c was greater than
that of the N2i (F(1, 33)=12.49, p<0.001, ηp2=0.27) while both N2c and N2i amplitudes were larger over right
hemisphere electrodes regardless of target side (F(1, 33)=4.44, p=0.04, ηp2=0.12). On the right, contralateral minus
ipsilateral double subtraction waveforms summed for left and right hemifield targets and divided into fast to slow RT
bins. These subtraction waveforms show a signal that closely resembles the N2pc, a target selection signal that has
been intensively studied in the visual search literature (Luck, 2012). Binning the waveforms as a function of RT
highlights that the amplitude of the N2pc scales with RT in the same manner as the N2 (F(3, 99)=6.62, p<0.001,
ηp2=0.17). Note the effect of RT bin here is largest for the slowest RT bin, which is also the case to a lesser extent in
the RT binning of the N2c in Figure 2A. This is most likely due to the fact that the RT distribution for this task was
Supplemental Experimental Procedures
Participants
All participants gave written informed consent, and all procedures were approved by the ethical review boards at the
site of data collection for each task: either the School of Psychology in Trinity College Dublin (experiments 1, 2, 5
and 6) or the School of Psychological Sciences in Monash University Melbourne (experiments 1, 3, 4 and 6). Ethical
guidelines were in accordance with the Declaration of Helsinki. All participants were right handed, over the age of
18, had normal or corrected-to-normal vision and had no history of psychiatric diagnosis, sensitivity to flickering
light, or head injury resulting in loss of consciousness.
After participant rejection (see Data Exclusion), there was a sample size of 34 (13 males, aged 19 – 48 years) in
Experiment 1, 5 (3 males, aged 20 – 26 years) in Experiment 2, 43 (26 males, aged 20 – 28 years) in Experiment 3,
15 (6 males, aged 21 – 32 years) in Experiment 4, 19 (11 males, aged 21 – 35 years) in Experiment 5, and 32 (12
males), aged 19 – 48 years in Experiment 6.
Materials and task procedures
All tasks were performed in a darkened room with participants seated 56cm from a 21 inch CRT (85Hz, 1024 x 768
resolution). Visual stimuli were presented on a dark grey background. Participants were instructed to fixate on a
central 5 x 5 pixel white square at all times. For experiments 1, 2, 3, 5 and 6 which had lateralised targets, an SR
Research Eyelink eye tracker (EyeLink version 2.04, SR Research Ltd/SMI) recorded eye movements which were
later analysed to ensure that participants maintained fixation.
Experiment 1: Motion Discrimination with Temporal and Spatial Uncertainty
Participants performed a continuous version of the random dot motion task (RDM) [6-8] in which they monitored
two peripheral patches of randomly moving dots for intermittent targets defined by a seamless transition from
random to coherent motion (35% or 45%), lasting 1.9s (Figure 1a). Targets were separated by intervals of 3.06, 5.17,
or 7.29s (randomised throughout each block). Participants were asked to indicate upward motion with a speeded left
in the left or right hemifield. Seven blocks consisting of 48 targets were performed, each block lasting approx. 6
minutes. Participants were given a break of approx. 30s in between each block.
The centre of each dot motion patch was at a visual angle 10° either side and 4° below the fixation square; each
patch covered 8° visual angle and consisted of 150 6 x 6 pixel white dots. The dots stimuli were flickered on and off
screen every 23.5ms, resulting in a flicker rate of 21.25 frames/s (each “frame” representing two screen refreshes).
During incoherent motion, these dots were placed randomly throughout the patch on each frame. During coherent
motion, a proportion of the dots were randomly selected on each frame to be displaced in either the upward or
downward direction on the following frame, with a motion speed of 6° per second.
Experiment 2: Manipulating Goal-Relevance of Dot Motion
Participants monitored the same RDM stimuli as were employed in Experiment 1. This time however, participants
were instructed to monitor the patches for a subtle change in the colour of all the dots in one patch. If the colour
changed to red, they were asked to click the left mouse button with the left hand, if it changed to blue, to click the
right button with the right hand. Task-irrelevant periods of coherent motion (35% and 45%) were introduced at
random intervals between each colour target but participants reported no awareness of coherent motion intervals
when questioned after testing. Participants completed 4 to 5 blocks of 48 trials of the task, each trial representing a
colour target and a coherent motion non-target.
Experiment 3: Relationship between N2 and target detection performance
We analyzed data collected as part of a previously reported experiment [S1] in which coherence levels were titrated
to below ceiling performance, allowing the comparison of hits and misses. The procedure was similar to Experiment
1 such that there was spatial and temporal uncertainty of target onset, but here involved discrete trial presentations.
In both the titration and experimental blocks, each trial consisted of a pre-target period of incoherent motion lasting
1.82, 2.22 or 2.62s followed by a downward coherent motion target which could come up in either the left or right
hemifield, upon which participants were instructed to simultaneously press both the left and right mouse buttons as
quickly as possible. Coherence levels were determined for each participant in the titration block using a four-down,
approximately an 85% hit rate [S2]. In the titration block 25% of trials were catch trials which contained no target
and participants received visual feedback after each trial as to whether they were correct, incorrect, or pressed the
button before the target had onset. The resulting individualised coherence level then remained constant throughout
the experimental block. The average of the individualised coherence levels was 19.5 +- 6.7%. The experimental
block included 10% catch trials of which the participant was informed before the task began while they also
received negative feedback if they responded before target onset. Participants completed one block of 330 trials in
total. After trial and participant rejection (see below), the average hit rate of analysable trials during the
experimental block was 81 +- 8.8%. For catch trials the false alarm rate was 12 +- 10.5% and correct rejection rate
88 +- 10.5%.
Experiment 4: Motion discrimination when monitoring two versus one stimuli
We presented participants with two conditions: one with two lateralized patches of dots, similar to Experiment 1;
and another where only one patch was presented (either in the left or right hemifield with location counterbalanced
across blocks). Only downward motion targets were presented, for which a right hand button press was required. All
participants performed 4 blocks of 48 trials of each condition, with coherent motion targets fixed at a constant level
– 45%. As in previous experiments, the periods of coherent motion occurred at random time intervals. The order of
unilateral and bilateral trials was counterbalanced across participants.
Experiment 5: Existence of N2 in response to a stimulus at central fixation
We re-examined data from a study in which participants monitored a single dot kinematogram at fixation [6].
Participants performed 7 – 10 blocks of 48 trials of the task, which was similar to the bilateral task in Experiment 1
except (i) only one dot motion patch was presented at fixation; (ii) the target dot motion coherence levels were 25%,
35%, 50% and 70%; and (iii) participants were instructed to press with the left hand for leftward motion and right
hand for rightward motion.
Experiment 6: Motion discrimination with spatial and temporal certainty
The paradigm was the same as Experiment 1, except performed in discrete trials and participants were cued with
right of the fixation square which lasted 600ms. Each trial consisted of a period of incoherent motion with seamless
transition into coherent motion. This setup ensured the participants knew exactly where and when the target would
occur. Two blocks of 48 trials were performed.
EEG Acquisition and Preprocessing
In Experiments 1, 2, 3, 4 and 6 continuous EEG was acquired from 64 scalp electrodes using an ActiveTwo Biosemi
system digitized at 512Hz, and using a Brain Products system digitized at 500Hz. In Experiment 5 EEG was
acquired from 128 scalp electrodes using an ActiveTwo Biosemi system digitized at 512Hz. All data were analysed
using a combination of custom scripts and EEGLAB routines [S3] in MATLAB (MathWorks). No high-pass filter
was applied online or offline, except in Experiment 6 where a 0.5Hz high-pass 4th order Butterworth filter was
applied due to the low trial count to diminish the influence of slow drifts on certain trials (this did not impact the
result of the experiment). All EEG data were low-pass filtered to 35Hz using a 4th order Butterworth filter. Noisy
channels were interpolated (spherical spline) and the data were re-referenced to the average reference. Data from
Trinity College Dublin and Monash University were combined in Experiments 1 and 6 by resampling the TCD data
to 500Hz. In all experiments, target epochs were extracted from the continuous data using a window of -100ms to
1000ms around target onset and baseline corrected with respect to -100 to 0ms before target onset.
Data Exclusion
For all experiments, trials were excluded from all analyses if they fulfilled either of the following criteria: (a)
reaction times slower than coherent motion offset (1900ms); (b) EEG from any channel exceeded +- 100μV during
the interval between 100ms before target onset and 100ms after response. For experiments 1, 4 and 6 trials were also
excluded if central fixation was broken by blinking or eye movement >3° left or right of centre, during the interval
between 100ms before target onset and 100ms after response. In Experiment 2, where periods of task-irrelevant
coherent motion were analysed, and Experiment 3, where miss trials were analysed, the artifact rejection timeframe
was 100ms pre and 1000ms post-stimulus onset. In all experiments, participants were excluded if more than half of
from Experiment 4, and 5 participants rejected from Experiment 6. In Experiment 3 a further exclusion criteria was
that participants should have more than 20 miss trials for analysis, leading to the exclusion of 12 participants.
Data Analysis
In experiments 1, 2, 3, 4 and 6 (64-electrode montage) the contralateral N2c and ipsilateral N2i components were
measured contralateral and ipsilateral to the target location, respectively, at electrodes P7 and P8. The bihemispheric
N2b to the fixation targets of Experiment 5 (128-electrode montage) exhibited the same timing over the left and
right hemispheres and was measured by averaging across left and right hemisphere electrodes slightly more anterior
than P7 and P8. The CPP was measured at peak electrodes Pz and POz in Experiments 1, 3, and 4; and at an
electrode just anterior to Pz in Experiment 5.
The degree to which N2c, N2i and CPP were locked to the task-relevant sensory change (switch from random to
coherent motion) onset versus the perceptual report (i.e. RT) was probed first visually via a surface plot which
plotted single trials pooled across participants, with a Gaussian moving window of 100 trials, and sorted in
ascending order according to z-scored RT along the y-axis, with time on the x-axis. In order to confirm these
observations single-trial data were low-pass filtered to 8Hz, then trials were pooled across participants and the peak
of the N2c and CPP signals on each trial was identified as the global minimum/maximum within a search window
extending from coherent motion onset to 100ms past RT. We then recorded the peak latency with respect to coherent
motion onset and RT separately. Any trial in which the most negative amplitude value was observed in either the
very first or very last window of the search timeframe was eliminated, as were trials where values exceeded +-3 SDs
of the mean. A homogeneity of variance test (Brown-Forsythe) was then performed on the two sets of latency
values. The results as reported in the text were statistically significant. In a further step, we repeated the same
analysis but this time trials were sorted according to within-subject z-scored RT and averaged across bins of
increasing size (2:60) in order to give a more accurate reflection of the true effect size than could be obtained from
noisy single-trial data. The effect size increased monotonically with bin size for both signals and the values reported
in the text were taken from a representative bin size (30-trial bin).
To determine the relative onsets of the N2 and CPP, we performed running sample-point by sample-point t-tests
the difference reached significance at the 0.05 level for 10 or more consecutive points, beginning at that point [S4,
S5].Using the data of Experiments 1 and 5 we examined the influence of sensory evidence strength (i.e. %
coherence) on N2 peak amplitude and latency. For each subject, peak amplitude for each coherence level was
measured as the mean amplitude inside a 100ms window centred on the grand average peak (N2c: 280ms; N2i:
400ms; N2b: 290ms). Peak latency was calculated by measuring N2 amplitude in overlapping 100ms windows that
spanned the entire signal time-frame in the grand average (N2c: 150 to 500ms; N2i: 300 to 550 ms; N2b: 150 to
500ms) and identifying the centre timepoint of the window with the most negative average amplitude value. We also
examined the influence of evidence strength on the onset and build-up rate of the CPP. CPP build-up was defined as
the slope of a straight line fitted to the response-locked waveform at -500 to -100ms. To determine the influence of
evidence strength on the time of CPP onset each participant’s data was subjected to a t-test against zero run
separately at each time-point (comparing the mean amplitude of a sliding window of 100ms against 0) and for each
coherence level. Signal onset was defined as the centre of the first time window at which the difference reached
significance at the 0.05 level for 10 or more consecutive windows, beginning at that window. The CPP did not rise
significantly above zero in one or both coherence bins for three participants who were therefore excluded from this
particular analysis.
In addition to analysing the effect of evidence strength on the CPP and N2 signals, we sorted trials according to
reaction time and divided them into four equal-sized bins. Importantly, RT binning was done within each stimulus
condition (i.e. coherence level, ITI, target side, motion direction), thus eliminating confounding factors known to
have an influence on RT. Analysis of the effect of both coherence and RT binning on the N2 and CPP components
were conducted using the same measurement methods and the same structure of repeated-measures ANOVA, with
factors of Component (contralateral, ipsilateral) and Coherence Level/RT Bin. Target Hemifield (Left, Right) was a
further factor when considering lateralised targets in Experiment 1.
In Experiments 1 and 5, we investigated interactions between the time-course of the N2 and that of the CPP. In order
to counter potential volume conduction between the relevant electrodes, all signals were subjected to a current
source density transformation using the CSD Toolbox for Matlab [11]. After transformation, topographies of the
First, we analysed the effect of N2 (N2c/N2b) latency on CPP onset and RT. Single-trial CPP values were sorted
according to N2 peak latency and divided into two bins that included an equal number of trials for each stimulus
condition. CPP onset was then compared across bins (early vs late N2) using a paired-samples t-test. Trial-by-trial
N2 peak latency was identified using the same approach that was previously applied to the average waveforms. Any
trial in which the most negative amplitude value was observed in either the very first or very last window of the
search timeframe was eliminated. CPP onsets were measured within each bin for each participant, according to the
same method described for the average waveforms in the binning analyses above. No significant CPP onset was
observed in the case of one participant who was therefore excluded from these particular analyses.
Second, the relationship between N2 (N2c/N2b) peak amplitude, CPP build-up and RT was evaluated on a
trial-by-trial basis using mediation analysis based on linear regression [S6]. We assessed the plausibility of a causal model
whereby N2 amplitude (predictor variable X) predicted RT (outcome variable Y) via the rate of CPP build-up
(mediator variable M), across the evolution of the CPP. Trial-by-trial N2 amplitude was measured as the mean
amplitude from a 100ms window centred on the grand average peak and then, along with trial-by-trial RT, was
z-scored inside each participant and each combination of stimulus conditions then pooled across participants,
providing X and Y in the mediation model. Stimulus-locked CPP slope was measured in contiguous 200ms
windows moving in steps of 2ms as far as the grand average CPP peak, z-scored and pooled, providing the mediator
variable M across time. The mediation analysis was then performed for each time window of the CPP slope,
calculating the indirect effect ab, i.e. the degree to which the effect of N2 amplitude on RT was mediated by the
CPP slope of that time window. Mean CPP amplitude was also measured in a 100ms window centred on the peak of
the N2, z-scored, pooled and entered into the mediation model as a covariate to rule out the influence of volume
conduction.
To account for multiple comparisons across the mediation time-series a non-parametric permutation method, similar
to that used by Cheadle and colleagues [S7], was employed to calculate a conservative significance threshold. The
pooled N2 values were randomly shuffled and entered into the mediation model for each time-point and this process
was repeated over 10,000 iterations. At each iteration the most extreme ab value (i.e. the mediation effect) in the
significance threshold. Once the time window of greatest mediation effect of CPP slope was identified, the four
criteria for establishing partial mediation [S6] were evaluated in that time window.
Four follow-up analyses were also conducted. First, the same N2c-CPP-RT relationship was probed with
response-locked CPP slope as the mediating variable. Second, the same mediation analysis was performed on the data from
Experiment 2 in which participants were detecting changes in the colour of the dot stimuli. Here, N2c amplitude was
measured in a smaller window of 50ms around its peak to take account of its briefer time-course (Figure S2) in
comparison to that observed in Experiment 1. CPP slope was measured from 280 to 480ms. The mediation analyses
were performed using the Mediation Toolbox for Matlab (M3 Matlab toolbox; http://wagerlab.colorado.edu/tools).
Third, to demonstrate that group-level effects are represented at the individual subject level we performed
within-subject single-trial regressions examining one of the key reported relationships - RT is predicted by N2c amplitude.
A one-sample t-test against zero was then performed on the resultant individual beta coefficients (Figure S1).
Fourth, contralateral minus ipsilateral double-subtraction waveforms were calculated from the data in Experiment 1.
The waveforms from N2i electrodes were subtracted from those of N2c electrodes on a trial-by-trial basis. These
waveforms were then binned by RT in the same manner as the main analysis in Experiment 1 and averaged across
target side (Figure S3).
In Experiment 3, we analysed the N2c/N2i and CPP for hits vs misses. We first equalised the number of hit and miss
trials for each participant by randomly selecting from their hit trials. We then performed a repeated-measures t-test
on N2c mean amplitude between 250 and 450ms. This process was repeated 10000 times with different random
hit-selection and the resulting mean t-value was compared to the critical t-value (p<0.05) for the appropriate degrees of
freedom. The results also held when a t-test was performed on hits vs misses N2c amplitude with all trials included.
CPP slope was likewise compared, measured from 450 to 650ms. For display purposes, waveforms in Figure 2c
Supplemental References
S1. Newman, D.P., Loughnane, G.M., Abe, R., Zoratti, M.T., Martins, A.C., van den Bogert, P.C., Kelly, S.P.,
O’Connell, R.G., and Bellgrove, M.A. (2014). Differential shift in spatial bias over time depends on observers׳
initial bias: Observer subtypes, or regression to the mean? Neuropsychologia 64, 33-40.
S2. Garcı́a-Pérez, M.A. (1998). Forced-choice staircases with fixed step sizes: asymptotic and small-sample properties. Vision research 38, 1861-1881.
S3. Delorme, A., and Makeig, S. (2004). EEGLAB: an open source toolbox for analysis of single-trial EEG dynamics including independent component analysis. Journal of neuroscience methods 134, 9-21.
S4. Foxe, J., and Simpson, G. (2002). Flow of activation from V1 to frontal cortex in humans. A framework for defining "early" visual processing. Experimental brain research.
S5. Kelly, S.P., Gomez-Ramirez, M., and Foxe, J.J. (2008). Spatial attention modulates initial afferent activity in human primary visual cortex. Cerebral cortex 18, 2629-2636.
S6. Baron, R.M., and Kenny, D.A. (1986). The moderator–mediator variable distinction in social psychological research: Conceptual, strategic, and statistical considerations. Journal of personality and social psychology 51, 1173.