Improvement of Dynamic Performance of LFC of the
Two Area Power System: An Analysis using MATLAB
K.P. Singh Parmar
National Power Training Institute,
Faridabad, India
S. Majhi
Indian Institute of Technology,
Guwahati, India
D.P. Kothari
Formerly with I.I.T. Delhi
currently with RAISONI Group of
Institutions, Nagpur, India
ABSTRACT
This paper presents the MATLAB simulink dynamic model of the load frequency control (LFC) of a realistic two area power system having diverse sources of power generation. The DC link is used in parallel with AC tie line for the interconnection of power system. The power system simulation is done using MATLAB simulink and control problem is solved using MATLAB programming. An optimal output feedback controller with pragmatic viewpoint is presented. Optimal Gain settings of the output feedback controller with and without DC tie line are obtained following a step load disturbance in either area by minimizing the quadratic performance index. The performance of the controller is compared for the power system with and without DC tie line. Simulation results show that the system with AC-DC parallel tie line achieves better performance in the presence of plant parameter changes and system nonlinearities. Further, results show that the output feedback method is the most rational technique with the good dynamic response when the power demands change.
Keywords
DC tie line, Load frequency control, MATLAB simulink, Output feedback.
1.
INTRODUCTION
Electric power systems are interconnected to make the systems more reliable. In a multi-area system, generations and loads are coordinated with each other through the tie lines among the areas [1] [2]. An electrical power system consists of many generating units and many loads while its total power demand varies continuously throughout the day. Smaller, but faster, load changes are dealt with by LFC so as to maintain frequency at the scheduled value (frequency control) and maintain the net power interchanges with neighboring control areas at their scheduled values (tie line control) [3]-[7]. Literature survey shows that mostly AC tie lines are used for the interconnection of multi-area power systems and lesser attention is given to AC-DC parallel tie lines [1]-[10]. HVDC transmission has emerged due to its various techno-economical advantages. One of the major applications of HVDC transmission is operating a DC link in parallel with an AC link interconnecting two control areas to get an improved system dynamic performance with greater stability margins under small disturbances in the system [11] [12]. Little research has been carried out on LFC of interconnected power systems connected via HVDC link in parallel with AC link [5]. The idea of LFC of an interconnected power system with a DC tie line in parallel with an AC tie line [11]-[15] is extended for the study of LFC of the more realistic power system as shown in Figures 1 and 2.
Mostly researchers considered hydro and thermal generators in control areas whereas in real situation, control area may have variety of sources of generations such as Hydro, Thermal, Gas, Nuclear, Solar, wind etc and such control areas represented by an equivalent of thermal or hydro unit dynamics only may not result in a realistic design of LFC control [7]. The concept of power system with multi-source power generation in each area as presented by the author Hassan Bevrani [6] [7] is taken for the simulation of this interconnected power system. In this paper, a two area interconnected power system model comprising Hydro, Thermal with Reheat turbine and Gas units in each area with AC-DC parallel tie line as shown in Figure 2 is presented. HVDC link is connected in parallel with the existing AC link for stabilizing the frequency oscillations of AC system. The linearized models of governors, reheat turbines, Hydro turbines and Gas turbines are used for simulation of the proposed power system [1] [2] [16]-[19].
In this paper, the dynamical response of the LFC problem is improved with a practical point of view. Practically, access to all of the state variables of a system is limited and measurement of all of them is not feasible and also costly. An output feedback control design is presented in this paper to overcome this problem. Literature survey shows that most of the researchers applied optimal control theory on thermal- thermal power systems with AC tie lines only [9] [20] [21]. To the best of authors’ knowledge, no work has been reported in the literature of LFC for design of the optimal output feedback controller for the realistic power system considered in this study. Optimal controllers have been used in LFC as secondary controllers, but surprisingly there is hardly any literature that compares performances of optimal controllers for the power system with and without DC tie lines [5].The main contributions of the present work are:
(a). Simulation of a realistic power system using MATLAB Simulink tool and MATLAB coding for solving the controller design problem.
(b). Improving the dynamic response of LFC system in a realistic two area interconnected power system considering parallel AC-DC tie lines.
(c). Comparing the dynamic responses of the LFC of the power system considering AC tie lines and parallel AC-DC tie lines.
2.
CONTROLLER DESIGN
The key equations and design steps of optimal output feedback controller [22] are presented in this section. The interconnected power system considered for study can be described in state space form [1] [9] [23] [24] as
xAx Bu (1) and
yCx (2) Where; x=[x1 x2...x27 ]T is a state vector
u= [u1 u2...u6 ]T is a control vector
y= [y1 y2 y3 y4 ]T is an output vector
A,B and C are constant matrices with the dimensions of 27×27, 27×6 and 4×27, respectively.
Let the output feedback control law [22] be given as
u Ky (3) Where Kis an output feedback gain matrix of dimension 6×4. The cost function (J) is
0
1 2
T T
J x Qx u Ru dt
(4) In equation (4), Q is a 27×27 positive semi-definite symmetric state cost weighting matrix and R is a 6×6 positive semi-definite symmetric control cost weighting matrix. For stability, all the Eigen values of the matrix
A BKC
should have negative real parts [22]. The optimal output feedback controller of designer’s choice is obtained by minimizing the cost function [22]-[24] and the controller design is carried out through an efficient MATLAB code [25] [26].3.
SIMULATION
OF
REALISTIC
POWER
SYSTEM
MODEL
WITH
PARALLEL AC-DC TIE LINE
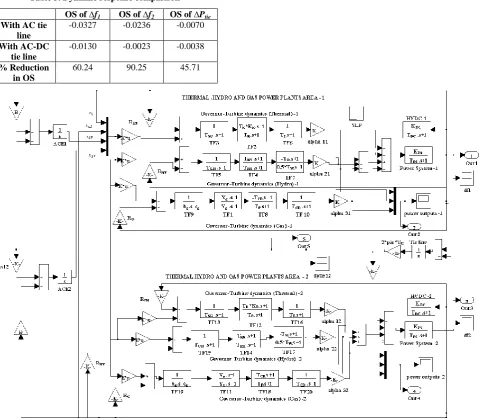
The two area interconnected power system model with AC-DC tie lines is shown in Figure 1. The realistic two area interconnected power system with parallel AC-DC tie lines which comprises more practical combination of generating units in each area is simulated using MATLAB Simulink [25]. The MATLAB simulink model is shown in Figure 2. As shown in Figure 2, each area comprises Reheat thermal, Hydro and Gas generating units and the two equal areas are interconnected by AC-DC tie lines. The simulation of this interconnected power system in a new power system environment is based on the concepts of considering variety of generators with their corresponding participation rates in each area [7] and parallel AC-DC tie lines [11]-[15]. The governor turbine dynamic models of Reheat thermal, Hydro and Gas generating units taken for simulation are described in [2] [16]-[19].
Furthermore, in the new environment, generators may or may not participate in the LFC task and participation rates are not the same for all participant generators. Let the participation factor of kth generator unit and ith area beki. In a given
control area, the sum of participation factors [6] [7] is equal to 1. The system parameter values are given in Appendix. The nominal loading of each area is taken 1740 MW with the power generation scheduling and generator participation factors as given in Table 1.
The power system has 27 state variables. Incremental DC power flow is considered as an additional state variable in the LFC strategy. State variables x1, x12, x26 and x27 are taken as output feedback states. The optimum gains of optimal output
[image:2.595.326.530.412.719.2]feedback controller are obtained by running the MATLAB codes generated on the basis of method described in section 2. The computer simulations are carried out with the optimum controller gain settings. MATLAB control system toolbox [25] is used to simulate the power system and to obtain dynamic responses of the system for 1% step load perturbations (SLPs) in the area-1.
Figure 1: Two equal area power system interconnected through AC-DC parallel tie lines
Table 1. Power generation scheduling to match the nominal load of the individual area
Total area load (MW)
Thermal contribution
(MW)
Gas contribution
(MW)
Hydro contribution
(MW)
1740 1000 240 500
Participation factor
0.5747 0.1380 0.2873
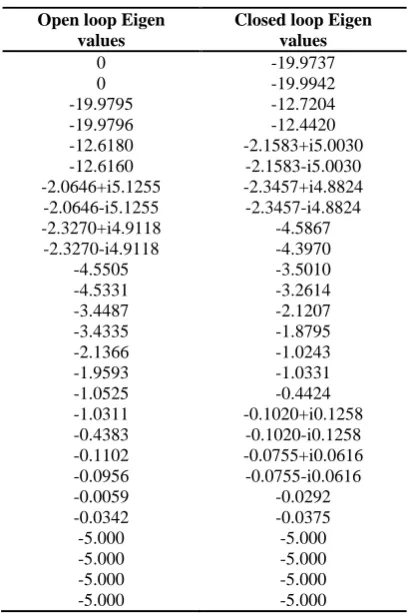
Table 2. Eigen values with open and closed secondary loop of the system
Open loop Eigen values
Closed loop Eigen values
0 -19.9737
0 -19.9942
-19.9795 -12.7204
-19.9796 -12.4420
-12.6180 -2.1583+i5.0030 -12.6160 -2.1583-i5.0030 -2.0646+i5.1255 -2.3457+i4.8824 -2.0646-i5.1255 -2.3457-i4.8824 -2.3270+i4.9118 -4.5867
-2.3270-i4.9118 -4.3970
-4.5505 -3.5010
-4.5331 -3.2614
-3.4487 -2.1207
-3.4335 -1.8795
-2.1366 -1.0243
-1.9593 -1.0331
-1.0525 -0.4424
-1.0311 -0.1020+i0.1258 -0.4383 -0.1020-i0.1258 -0.1102 -0.0755+i0.0616 -0.0956 -0.0755-i0.0616
-0.0059 -0.0292
-0.0342 -0.0375
-5.000 -5.000
-5.000 -5.000
-5.000 -5.000
-5.000 -5.000
Control area-1 Thermal, Hydro and Gas
Control area-2 Thermal, Hydro and Gas
Rectifier Unit
Table 3. Dynamic response comparison
OS of ∆f1 OS of ∆f2 OS of∆Ptie
With AC tie line
-0.0327 -0.0236 -0.0070
With AC-DC tie line
-0.0130 -0.0023 -0.0038
% Reduction in OS
[image:3.595.353.503.529.599.2]60.24 90.25 45.71
Figure 2: MATLAB simulink model of the two equal area interconnected power system with parallel AC-DC tie lines
4.
SIMULATION
RESULTS
AND
ANALYSIS
The optimum values of the K for the output feedback controller by minimizing the cost function for the power system with AC tie line corresponding to nominal system parameters is
0.4124 0.1142 0.3102 0.0654
0.1745 0.0092 0.0427 0.0586
0.1500 0.0685 0.1212 0.0117
0.0748 0.8409 0.1760 0.3707
0.0560 0.7015 0.1194 0.4405
0.0480 0.3509 0.0151 0.1883
K
and for the power system with AC-DC parallel tie line is
0.1800 0.5520 0.5738 0.2111
0.0661 0.1103 0.0954 0.0603
0.0991 0.2254 0.2568 0.0611
0.4506 0.0416 0.2344 0.2903
0.2441 0.1472 0.0630 0.3267
0.1884 0.0762 0.0758 0.1752
K
Dynamic responses of the system are obtained for 1% step load perturbation (SLP) in the area-1. The Eigen values of the system with open and closed secondary loop are given in Table 2. The closed loop Eigen values have negative real parts and satisfy the system stability conditions. The frequency deviation responses of area-1 and area-2 are shown in Figures 3 and 4. The tie line power deviation response is shown in Figure 5. It is observed that the output feedback controller considering parallel AC-DC tie lines in power system gives better dynamic responses having relatively smaller peak overshoot and lesser settling time with zero steady state error as compared to the power system with AC tie lines only. The quantitative comparison is made in Table 3 where percentage reduction in the overshoot (OS) of ∆f1, ∆f2and ∆Ptie is 60.24,
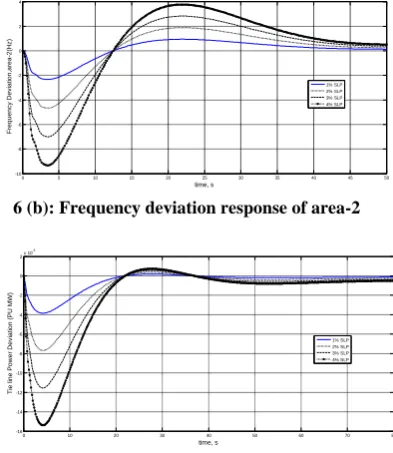
[image:3.595.94.242.616.688.2]varying from 1% to 4% in either area. Further, frequency deviation responses for different SLPs are shown in Figure 6. It is apparent that for SLP varying from 1% to 4%, the first peak overshoot increases with increase in the level of SLP and settling time remains approximately same with zero steady state error. Thus, the proposed controller satisfies the LFC problem requirement for wide variation of load disturbance.
[image:4.595.59.281.159.535.2]Figure 3: Frequency deviation response of area-1 with AC tie line and AC-DC parallel tie line
[image:4.595.64.278.162.267.2]Figure 4: Frequency deviation response of area-2 with AC tie line and AC-DC parallel tie line
Figure 5: Tie line power deviation response with AC tie line and AC-DC parallel tie line
6 (a): Frequency deviation response of area-1
6 (b): Frequency deviation response of area-2
6 (c): Tie line power deviation response of area-2
Figure 6: (a)-(c) Dynamic responses for step load perturbations varying from 1% to 4%
5.
CONCLUSION
An attempt is made in this paper to improve the dynamic performance of LFC of the interconnected power system by considering DC tie line. A simple but practical controller is presented to improve the dynamic response of LFC system in a realistic power system environment considering DC tie lines in parallel with AC tie lines. The output feedback controller for the power system with DC link gives better dynamic response having relatively smaller peak overshoot and lesser settling time with zero steady state error as compared to the power system considering AC tie lines. The dynamic response of the system with DC link is improved significantly with the percentage reduction in the overshoot (OS) of ∆f1, ∆f2and
∆Ptie becoming 60.24, 90.25 and 45.71, respectively. Dynamic
responses are obtained for wide range of variation in load disturbance from 1% to 4% which satisfy the LFC requirements. Hence for all practical purposes, the controller is quite robust. The simulation results show that proposed control strategy considering parallel AC-DC tie line is very effective and guarantees good performance.
0 5 10 15 20 25 30 35 40 45 50
-0.035 -0.03 -0.025 -0.02 -0.015 -0.01 -0.005 0 0.005 time, s F re q u e n c y D e v ia ti o n ,a re a -1 (H z )
AC Tie line AC-DC Tie line
0 5 10 15 20 25 30 35 40 45 50
-0.025 -0.02 -0.015 -0.01 -0.005 0 0.005 time, s F re q u e n c y D e v ia ti o n ,a re a -2 (H z )
AC Tie line AC-DC Tie line
0 10 20 30 40 50 60 70 80
-8 -6 -4 -2 0 2 4x 10
-3 time, s T ie l in e P o w e r D e v ia ti o n ( P U M W)
AC Tie line AC-DC Tie line
0 5 10 15 20 25 30
-0.06 -0.05 -0.04 -0.03 -0.02 -0.01 0 0.01 time, s F re q u e n c y D e v ia ti o n ,a re a -1 (H z ) 1% SLP 2% SLP 3% SLP 4% SLP
0 5 10 15 20 25 30 35 40 45 50
-10 -8 -6 -4 -2 0 2 4x 10
-3 time, s F re q u e n c y D e v ia ti o n ,a re a -2 (H z ) 1% SLP 2% SLP 3% SLP 4% SLP
0 10 20 30 40 50 60 70 80
-16 -14 -12 -10 -8 -6 -4 -2 0 2x 10
[image:4.595.73.277.563.663.2]6.
APPENDIX
0
12
2000 (Rated capacity of each area)
1740 MW (Nominal load of each area)
60 Hz, 5 MWsec/MVA
0.0145 pu MW/Hz,
68.9655 Hz/pu MW, 11.49 sec, 0.06 sec, 0.3 sec, 0.0433
rt
L
PS PS
SG T
TH
P MW
P
f H
D
K T
T T T
R R
12
2.4 / ,
0.4312, 1, 0.3 , 10.2sec,
1.1sec, 4.9sec, 28.749sec,
0.2 sec, 0.6 sec, 1.1sec
1, 0.049sec, 0.239sec,
0.01sec, 0.2sec
DC Link parameters
1, 0
HY G
R R
W RS RH
GH G G
g g F
CR CD
DC DC
R Hz puMW
B a K T
T T T
T X Y
c b T
T T
K T
.2sec
7.
REFERENCES
[1] D.P. Kothari and I.J. Nagrath. Modern Power System Analysis. 4th ed. New Delhi: McGraw Hill; 2011. [2] P. Kundur. Power System Stability and Control. Fifth
reprint. New Delhi: Tata McGraw Hill; 2008.
[3] Jan Machowski, Jan Machowski and James R. Bumby. Power System Dynamics Stability and Control. 2nd ed. Chichester, West Sussex, United Kingdom, John Wiley and Sons Ltd; 2008
[4] D.P. Kothari and J.S.Dhillon. Power System Optimization. 2nd ed. New Delhi: Prentice Hall; 2010 [5] Ibraheem, P. Kumar and D.P. Kothari, Recent
philosophies of automatic generation control strategies in power systems, IEEE Trans Power Syst. 20 (1), 2005, pp.346-357.
[6] Hassan Bevrani, Takashi Hiyama. Intelligent Automatic Generation Control. New York: CRC Press Taylor and Francis; 2011.
[7] Hassan Bevrani. Robust Power System Frequency Control. New York: Springer; 2009, pp.15-31.
[8] O.I. Elgerd. Electric Energy System Theory: an introduction. 2nd ed. New York: McGraw-Hill; 1983. [9] C.E. Fosha and O.I. Elgerd. The megawatt frequency
control problem: a new approach via optimal control theory. IEEE Trans Power Appl Syst. 89(4), 1970, pp. 563-577.
[10]H. Golpira H. Bevrani and H. Golpira. Application of GA optimization for automatic generation control design in an interconnected power system. Energy Conversion and Management. 52, 2011, pp. 2247-2255.
[11]S.Ganapathy and S.Velusami. Design of MOEA based Decentralized Load-Frequency Controllers for Interconnected Power Systems with ACDC Parallel Tie-lines. International Journal of Recent Trends in Engineering. Vol 2, No. 5, 2009, pp. 357-361
[12]P. Kumar, and Ibraheem. Dynamic performance evaluation of 2-area interconnected power systems: a comparative study. J. Institution of Engineers (India):
Electrical Engineering Division. Vol. 78, 1998, pp. 199-209.
[13] C.Srinivasa Rao, S.Siva Nagaraju and P.Sangameswara Raju. Improvement of Dynamic Performance of AGC under Open Market Scenario Employing TCPS and A.C-D.C Parallel Tie Line. International Journal of Recent Trends in Engineering. Vol 1, No. 3, 2009
[14]H.D. Mathur and H.V. Manjunath. Study of Dynamic Performance of Thermal Units with Asynchronous Tie lines using Fuzzy Based Controller. J. Electrical Systems. Vol 3, No. 3, 2007, pp. 124-130
[15]S.Ramesh and A.Krishnan. Fuzzy Rule Based Load Frequency Control in a Parallel AC DC Interconnected Power Systems through HVDC Link. International Journal of Computer Applications. Vol. 1, No. 4, 2010 [16]IEEE power engineering systems committee report.
Dynamic models for steam and hydro turbines for power systems studies. IEEE Trans. Power App. Syst., vol. PAS-92, 1973.
[17]IEEE power engineering systems committee report. Hydraulic turbine and turbine control models for system dynamics. IEEE Trans. Power. Syst. vol. PWRS-7, 1992.
[18]Hajagos, L. M. and Berube, G. R. Utility experience with gas turbine testing and modeling. Proceedings of IEEE Power Engineering Society Winter Meeting, Columbus, OH, USA, vol. 2, issue 2, 2001, pp. 671-677.
[19]Working group on prime mover and energy supply models for system dynamic performance studies. Dynamic models for combined cycle plants in power system studies. IEEE Trans. Power Syst., 9(3), 1994, pp.1698-1708.
[20]M. Aldeen and H. Trinh. Load frequency control of interconnected power systems via constrained feedback control schemes. Int J Comput Elect Eng. 20 (1), 1994, pp. 71-88.
[21]O.I. Elgerd and C. Fosha. Optimum megawatt frequency control of multi-area electric energy systems. IEEE Trans Power Appl. Syst. 89 (4), 1970, pp. 556-563.
[22]F.Llewis and V.L.Syrmos. Optimal Control. New Jersy: Prentice hall, Englewood cliffs; 1995.
[23]K. P. Singh Parmar, S. Majhi and D. P. Kothari. Automatic Generation Control of an Interconnected Hydrothermal Power System. IEEE Conf. proceedings. INDICON 2010, Kolkata,India.
[24]K. P. Singh Parmar, S. Majhi and D. P. Kothari. Multi-Area Load Frequency Control in a Power System Using Optimal Output Feedback Method. IEEE Conf. proceedings. PEDES 2010, New Delhi, India.
[25]MathWoks. Inc. MATLAB. Control Toolbox. Version 7.13 (R2011b), MATLAB Software.