1
Retraction Notice
Title of retracted article: A Simplified Thermal Modelling of Cooling Tower for Optimization of HVAC Systems to Enhance Energy Efficiency
Authors: Rishabh Agrawal, Subhash Chand Kaushik, Trilochan Singh Bhatti
* Corresponding author. Email: [email protected]
Journal: Open Journal of Applied Sciences (OJAppS)
Year: 2015
Volume: 5
Number: 7
Pages (from - to): 335 - 343
DOI (to PDF): http://dx.doi.org/10.4236/ojapps.2015.57034
Paper ID at SCIRP: 2310449
Article page: http://www.scirp.org/Journal/PaperInformation.aspx?PaperID=57974
Retraction date: 2016-06-02
Retraction initiative (multiple responses allowed; mark with X): All authors
XSome of the authors:
Editor with hints from Journal owner Xpublisher) Institution:
Reader:
Other:
Date initiative is launched: 2016-06-01
Retraction type (multiple responses allowed): Unreliable findings
Lab error Inconsistent data Analytical error Biased interpretation Other:
Irreproducible results
Failure to disclose a major competing interest likely to influence interpretations or recommendations Unethical research
Fraud
Data fabrication Fake publication Other:
X Plagiarism Self plagiarism Overlap Redundant publication *
Copyright infringement Other legal concern:
Editorial reasons
Handling error Unreliable review(s) Decision error Other:
Other:
Results of publication (only one response allowed): are still valid.
Xwere found to be overall invalid.
Author's conduct (only one response allowed): honest error
Xacademic misconduct
none (not applicable in this case – e.g. in case of editorial reasons)
History
Expression of Concern: yes, date: yyyy-mm-dd Xno
Correction:
yes, date: yyyy-mm-dd Xno
Comment:
The paper does not meet the standards of "Open Journal of Applied Sciences".
This article has been retracted to straighten the academic record. In making this decision the Editorial Board follows COPE's Retraction Guidelines. Aim is to promote the circulation of scientific research by offering an ideal research publication platform with due consideration of internationally accepted standards on publication ethics. The Editorial Board would like to extend its sincere apologies for any inconvenience this retraction may have caused.
Open Journal of Applied Sciences, 2015, 5, 335-343
Published Online July 2015 in SciRes. http://www.scirp.org/journal/ojapps http://dx.doi.org/10.4236/ojapps.2015.57034
How to cite this paper: Agrawal, R., Kaushik, S.C. and Bhatti, T.S. (2015) A Simplified Thermal Modelling of Cooling Tower for Optimization of HVAC Systems to Enhance Energy Efficiency. Open Journal of Applied Sciences, 5, 335-343.
http://dx.doi.org/10.4236/ojapps.2015.57034
A Simplified Thermal Modelling of Cooling
Tower for Optimization of HVAC Systems to
Enhance Energy Efficiency
Rishabh Agrawal*, Subhash Chand Kaushik, Trilochan Singh Bhatti
Centre for Energy Studies, Indian Institute of Technology, Delhi, India Email: *[email protected], [email protected], [email protected]
Received 19 June 2015; accepted 12 July 2015; published 15 July 2015
Copyright © 2015 by authors and Scientific Research Publishing Inc.
This work is licensed under the Creative Commons Attribution International License (CC BY). http://creativecommons.org/licenses/by/4.0/
Abstract
This paper presents a simplified model to analyze the heat flow in Closed Wet Cooling Tower (CWCT). Based on the existing research results and some suitable assumed conditions, we develop a model to simplify the handling of the heat rejection rates under four different input parameters and variable ambient wet-bulb temperatures. The analytical results of the data from different sources demonstrate that the model with the new parameters is accurate enough for the control and optimization of CWCT operation. After validating the accuracy of the model, we also describe the extension of the model for analyzing the energy flows of a CWCT. When the model in combina-tion with the input power model, it may represent the quantitative relacombina-tionship between energy flow rates and principal input-output variables of the CWCT.
Keywords
Closed Wet Cooling Tower, Cooling Capacity, Thermal Modeling, Simplified Analysis
1. Introduction
In order to reduce energy consumptions for building and efficient use of energy, continuous energy audit and performance monitoring of the operating parameters in installed systems are essential. The building sector alone represents about 33% of electricity consumption of the total electricity consumption in India, with commercial sectors and residential sectors accounting for 8% and 25% respectively [1]. Studies indicate that air-conditioning is responsible for 10% to 60% of the total building energy consumption, depending on the building type [2]. In developed countries, HVAC systems are the most energy consuming devices, accounting for about 10% - 20% of final energy use [3]. As one of the two basic types of evaporative cooling devices, CWCT is essentially
com-*
Corresponding author.
R. Agrawal et al.
bining a heat exchanger and direct-contact evaporative cooling tower into one device [4]. With the advantages of better thermal performance and lower energy consumption than traditional cooling towers, CWCTs plays an important role in the heat rejection of residential and commercial buildings. Many literatures which are related to the modeling and experiment of CWCT can be found. The mass and heat process cooling tower has always been received much attention. In order to obtain experimental correlations for mass and heat transfer coefficients of a new CWCT, Facao and Oliveira [5] present different thermal models to predict the performance of CWCT. As is shown in Ref. [6], a detailed analysis of the mass transfer coefficient and spray heat transfer coefficient correlations is made experimentally, including the effects of the errors in their evaluation on tower efficiency. Beside the experimental method, the numerical simulation method is often used for the same purpose. A numer-ical simulation of a CWCT with novel design is presented for the determination of heat and mass transfer coef-ficients and the influence of Lewis number on the cooling tower performance [7]. To investigate the thermal performance, a program is coded for the heat and mass transfer in CWCT whether the outlet air is supersaturated or not [8].
As part of the heat and mass transfer characteristics, cooling capacity of CWCT has also got the same atten-tion. The results of a theoretical investigation show that the highest fall of serpentine water temperature and losses of spray water are observed for the lowest value of inlet wet bulb temperature [9]. From the experimental study, cooling capacity and pressure drop of CWCT have been studied with respect to variable air inlet parame-ters, cooling water inlet temperatures and air to cooling water volume flow rate ratio [10]. The results of other experimental measurements for performance of a prototype CWCT show that tower flow rates and number of tubes and rows are optimized for the required cooling load to achieve a high coefficient of performance (COP) [11]. Based on Number of Transfer Units-effectiveness (NTU-ɛ) models by simplification of heat and mass bal-ance and transfer equations, a simple model for indirect-contact evaporative cooling-tower behavior has been developed [12].
Although there is a large amount of researches on the heat and mass transfer characteristics of the CWCT, few of them are reported on the simplified analysis of its cooling capacity prediction. As part of a project to analyze the energy flows in a typical cooling system, this paper describes a simplified model to analyze the heat flow in CWCT. Based on some additional assumptions, this model is derived from an existing model. The accuracy of the models with new parameters is validated by using experimental data from different sources. After this, fur-ther analysis of the predictions of these models is made under specific operational conditions. In the end, we analyze the model’s significance on practice and relative further researches.
2. Mathematical Modeling
Some approaches are adopted for modeling the heat and mass transfer processes of CWCT, such as the Merkel method, the Poppe method and the NTU-ɛ method [7] [8] [12]. By applying these methods to get the expected results, we generally consume considerable computational time. The CWCT mathematical model to be used for analyzing the energy flows in air-conditioning system must be simplified enough with acceptable accuracy. For obtaining experimental correlations between mass and heat transfer coefficients of a new CWCT, simpler mod-els could give as good, or even better, consequences as modmod-els based on finite difference techniques [5]. In this work, the performance model of CWCT is derived from an existing model, as described below, and its main in-put variables include ambient wet bulb temperature (Twb, ˚C), dry air flow rate (ma, kg/s), spray water flow rate
(msw, kg/s), and inlet parameters of cooling water such as the temperature (Tw, ˚C) and the mass flow rate (mw,
kg/s). The main assumptions of the modeling process are detailed in Refs. [7]-[9] [12]. Two CWCTs from two different sources are selected for the verification of the model. Figure 1 and Figure 2 indicates the schematic diagram of the three fluids in a cross-flow CWCT unit and a counter-flow CWCT unit, respectively.
The model for CWCT behavior adopted in this paper is the one developed by Stabat and Marchio [12]. In this model, two undetermined coefficients could be determined by the analysis of input-output parameters from only two operating conditions. Once parameterized, the model can be used for calculating the heat rejection rate of the CWCT. The total heat rejection rate (Q, kW) is determined under the following conditions 1200 ≤ Rea ≤
14000, 50 ≤ Resw ≤ 240, 12 ≤ dext ≤ 40mm, 2500 ≤ Rew ≤ 10000 and 3 ≤ Pr ≤ 8 (15 ≤ Tw ≤ 60˚C), expressed as
follows (see detailed in Ref. [12]):
(
, ,)
(
, ,)
(
, ,)
w w w o w i a wb o wb i a psat wb o wb i
Q= −c m T −T =m h −h ≅m c T −T (1)
LM
R. Agrawal et al.
[image:5.595.86.539.89.594.2]337
Figure 1. Schematic diagrams of the three fluids in a cross-flow CWCT unit.
with,
0.5 0.8 0.8
1 sw
ext psat a int sw I
UA c m m
µ
β β
= + (3)
(
, ,) (
, ,)
, , , ,
ln
w o wb i w i wb o LM
w o wb i w i wb o
T T T T
T T T T T − − − ∆ = − − (4)
where, Re is Reynolds number; Pr is Prandtl number; dextis tube diameter (m); cwis specific heat of cooling
wa-ter at constant pressure (kJ·kg−1·˚C−1); cpsat is fictitious specific heat of moist air at constant pressure
(kJ·kg−1·˚C−1); m is flow rate (kg/s); Tis temperature (˚C); h is enthalpy of moist air (kJ·kg−1); U is heat transfer coefficient (kW·m−2·˚C−1); A is area (m2); μ is dynamic viscosity coefficient of spray water (kg·m−1·s−1); ∆TLM is
logarithmic mean temperature difference (˚C); βint is a constant which is influenced by the coil’s geometry and
constant water-properties; βext is a constant which depends on the thermal properties of air and on the coil’s
geometry; Subscripts w, sw, and a mean cooling water, spray water and dry air, respectively; Subscript wb
represents ambient wet-bulb temperature, Subscripts i, o stand for inlet and outlet.
Under typical operating conditions of air-conditioning systems, the enthalpy of moist air is a single function of wet-bulb temperature and can be approximated by the following relation [13]:
( )
0.06482(
)
1.01 3.99431 e Twb 2.5 0.00184
a wb wb wb
h T = ×T + × × × + ×T (5)
Based on the regression analysis of Equation (5), liner equation may be ideally established between the en-thalpies of moist air and ambient wet-bulb temperatures. When ambient wet bulb temperature is varied from 15.0˚C to 30.0˚C, Equation (5) can be then simplified as follows:
( )
3.9496 20.475a wb wb
h T ≅ ×T − (6)
When ha (Twb) from Equation (6) is substituted to Equation (1), the fictitious specific heat of moist air (cpsat) is
given as:
, , , ,
3.9496 a o a i
psat
wb o wb i
h h
c
T T
−
≅ ≅
− (7)
When ∆Tmax/∆Tmin <2, Equation (3) is modified and can be shown that [14] [15]:
(
, ,) (
, ,)
max min
2 2
w o wb i w i wb o LM
T T T T
T T
T ∆ + ∆ − + −
∆ = = (8)
Assuming the dynamic viscosity coefficient of spray water is constant over small ranges of temperature, one simplifies Equation (4) as:
R. Agrawal et al. 0 1 0.8 0.8 1 a sw a a
UA=m +m (9)
where, a0, a1 indicate two undetermined coefficients.
By substituting Equations (7)-(9) into Equation (2), we obtain the performance model of the CWCT (Equation (10)): , , 0 1 0.8 0.8 1 1 2 2
w i wb i
psat a w w
a sw
T T Q
a a
c m c m
m m
− =
+ + + (10)
In this section, a simplified model for the heat rejection rate of the CWCT is described based on relevant re-search results and additional assumptions. The relation between its main input-output variables can be deter-mined using Equation (10).
3. Model Verification
CWCT can be classified by the movement of spray water and air as counter-flow and cross-flow types. In order to confirm the proposed model, these two types of CWCTs have been selected to provide the associated experi-mental data obtained under quasi-steady state conditions. Levenberg-Marquardt method is implemented to de-termine undede-termined coefficients of the model.
The model is validated experimentally on the studied of heat rejection rates, at different inlet conditions and variable ambient wet-bulb temperature. In addition, the predicted cooling loads using the mathematical model described in Section 2 are obtained based on the well-established sets of test data. In order to visually describe and quantitatively show the heat rejection rates of the model prediction, an error index, Root-Mean-Square of Relative Error (RMSRE), is adopted [16]:
2 calculated predicted 1 calculated RMSRE n i Q Q Q n = −
=
∑
(11) [image:6.595.245.382.158.202.2]3.1. Validation Using a Cross-Flow CWCT
Figure 1 indicates the sketch of a cross-flow CWCT unit [17]. The size of the CWCT is 570 mm (Height) × 310 mm (Width) × 180 mm (Length). As shown in the figure, the spray water flow is in cross flow with the air flow and process water flow. In the tower, fin-tube structure is employed to effectively enhance the heat transfer be-tween the spray water and the process water. The finned tubes are made of stainless steel.
Table 1 lists the designed parameters of the cooling tower. The parameters of CWCT structure and the sche-matic diagram of the testing configuration are detailed in Ref. [17].
The tests for obtaining relevant data of the cross-flow CWCT unit were performed in an environmental chamber. In order to study the cooling capacity of the CWCT, 11 operating conditions and 46 sets were pro-vided from the perfect experiment platform. As listed in Table 2, the main parameters are the inlet parameters of process water and the ambient wet-bulb temperature etc. To verify the accuracy of the model, the experimental data were adopted. The undetermined coefficients of the model is determined as a0 = 0.350 and a1 = 0.098 by using the proposed method above. The relatively errors of the calculated and predicted heat rejection rate gener-ally were within ±10% and expressed in Table 2. The RMSRE for the model validation of 11 data points was 0.062, which means the model is reliable.
3.2. Validation Using a Counter-Flow CWCT
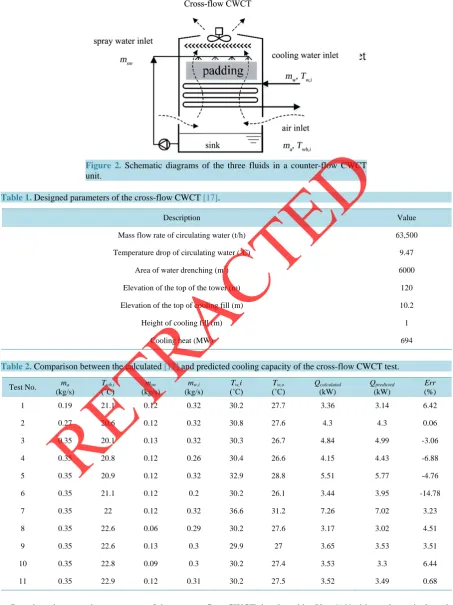
A counter-flow CWCT is selected from Ref. [18]. The size of the CWCT is 270 mm (Height) × 225 mm (Width) × 550 mm (Length). As shown in Figure 2, the spray water flow is in counter flow with the air flow. In this tower, padding upon the un-finned coil is employed to strengthen the heat and mass transfer between the spray water and air. The coil is made of stainless steel to facilitate heat exchange between the spray water and the process water.
[image:6.595.87.535.247.659.2]R. Agrawal et al.
339
Figure 2. Schematic diagrams of the three fluids in a counter-flow CWCT
[image:7.595.86.540.91.697.2]unit.
Table 1. Designed parameters of the cross-flow CWCT [17].
Description Value
Mass flow rate of circulating water (t/h) 63,500 Temperature drop of circulating water (˚C) 9.47
Area of water drenching (m2) 6000
Elevation of the top of the tower (m) 120
Elevation of the top of cooling fill (m) 10.2
Height of cooling fill (m) 1
Cooling heat (MW) 694
Table 2. Comparison between the calculated [17] and predicted cooling capacity of the cross-flow CWCT test.
Test No. ma (kg/s)
Twb,i
(˚C) (kg/s)msw
mw,i (kg/s)
Tw,i
(˚C) (˚C)Tw,o Q(kW)calculated
Qpredicted (kW)
Err
(%) 1 0.19 21.1 0.12 0.32 30.2 27.7 3.36 3.14 6.42
2 0.27 20.6 0.12 0.32 30.8 27.6 4.3 4.3 0.06
3 0.35 20.1 0.13 0.32 30.3 26.7 4.84 4.99 -3.06
4 0.35 20.8 0.12 0.26 30.4 26.6 4.15 4.43 -6.88
5 0.35 20.9 0.12 0.32 32.9 28.8 5.51 5.77 -4.76
6 0.35 21.1 0.12 0.2 30.2 26.1 3.44 3.95 -14.78
7 0.35 22 0.12 0.32 36.6 31.2 7.26 7.02 3.23
8 0.35 22.6 0.06 0.29 30.2 27.6 3.17 3.02 4.51
9 0.35 22.6 0.13 0.3 29.9 27 3.65 3.53 3.51
10 0.35 22.8 0.09 0.3 30.2 27.4 3.53 3.3 6.44
11 0.35 22.9 0.12 0.31 30.2 27.5 3.52 3.49 0.68
Based on the operating processes of the counter-flow CWCT developed by You [18], this mathematical mod-el has been validated with the rmod-elevant experimental data. Table 3 summarizes a set of 24 test data sets. The
R. Agrawal et al.
[image:8.595.119.474.282.586.2]RMSRE is estimated as 0.040 (a0 = 0.321; a1 = 0.119) for the counter-flow CWCT and these are acceptable for the purposes of control and optimization.
Figure 3 shows the result of a comparison between predicted and calculated results for heat rejection rates of the CWCT. Three lines are showed in the figure to indicate cooling capacities. The middle line means the model exactly predicts the calculation of cooling capacities. If the data points are located in the area under the line, it means that the model under-predicts the cooling capacities. Conversely, the model over-predicts the cooling ca-pacities. The model leads to a maximum relatively error in heat rejection rates of 7.9%, which means the predic-tive model, is accurate.
4. Results and Discussion
4.1. Effect of Inlet Flow Rates
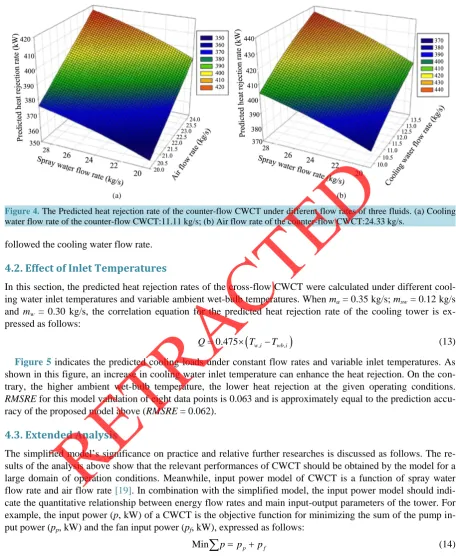
Two specific operating conditions of the counter-flow CWCT are selected for analyzing the cooling capacities under different flow rates of three fluids, such as cooling water, spray water and dry air. When Tw,i = 37.0˚C, Twb,i = 16.6˚C, the predicted cooling load is expressed as follows:
0.8 0.8
20.4
0.321 0.119 0.127 0.119
a w
a sw
Q
m m
m m
=
+ + + (12)
As shown in Figure 4, the cooling performance curves of the counter-flow CWCT under constant cooling water flow rater (mw = 11.11 kg/s) and invariable dry air flow rate (ma = 24.3 kg/s) can be displayed,
[image:8.595.89.540.617.719.2]respective-ly. Obviously, a trend of increase in cooling capacity is consistent with the increase of substances mass flow rate at the same operating conditions. Changes of spray water flow rate have minimal impact on cooling capacity,
Figure 3. Comparison of the Predicted heat rejection rate
against experimental data of the counter-flow CWCT.
Table 3. The experimental data of the counter-flow CWCT test [17].
Test no.
ma (kg/s)
msw (kg/s)
mw,i (kg/s)
Tw,i
(˚C) (˚C)Tw,o (˚C)Twb,i Q(kW)calculated
1 - 4 24.33 9.72 37.09 ± 0.01 28.20 ± 0.06 17.34 ± 0.05 362.70 ± 2.55
5 - 12 20.00; 24.33 19.44; 22.78; 11.11 37.20 ± 0.15 28.49 ± 0.28 15.55 ± 1.41 406.70 ± 19.83
13 - 16 24.33 25.56; 28.89 12.5 37.14 ± 0.11 29.20 ± 0.24 16.18 ± 0.46 418.69 ± 8.66
R. Agrawal et al.
341
[image:9.595.82.539.82.641.2](a) (b)
Figure 4. The Predicted heat rejection rate of the counter-flow CWCT under different flow rates of three fluids. (a) Cooling
water flow rate of the counter-flow CWCT:11.11 kg/s; (b) Air flow rate of the counter-flow CWCT:24.33 kg/s.
followed the cooling water flow rate.
4.2. Effect of Inlet Temperatures
In this section, the predicted heat rejection rates of the cross-flow CWCT were calculated under different cool-ing water inlet temperatures and variable ambient wet-bulb temperatures. When ma = 0.35 kg/s; msw = 0.12 kg/s
and mw = 0.30 kg/s, the correlation equation for the predicted heat rejection rate of the cooling tower is
ex-pressed as follows:
(
, ,)
0.475 w i wb i
Q= × T −T (13)
Figure 5 indicates the predicted cooling loads under constant flow rates and variable inlet temperatures. As shown in this figure, an increase in cooling water inlet temperature can enhance the heat rejection. On the con-trary, the higher ambient wet-bulb temperature, the lower heat rejection at the given operating conditions.
RMSRE for this model validation of eight data points is 0.063 and is approximately equal to the prediction accu-racy of the proposed model above (RMSRE = 0.062).
4.3. Extended Analysis
The simplified model’s significance on practice and relative further researches is discussed as follows. The re-sults of the analysis above show that the relevant performances of CWCT should be obtained by the model for a large domain of operation conditions. Meanwhile, input power model of CWCT is a function of spray water flow rate and air flow rate [19]. In combination with the simplified model, the input power model should indi-cate the quantitative relationship between energy flow rates and main input-output parameters of the tower. For example, the input power (p, kW) of a CWCT is the objective function for minimizing the sum of the pump in-put power (pp, kW) and the fan input power (pf, kW), expressed as follows:
Min
∑
p= pp+pf (14)with the constraints:
,min ,max
p p p
p ≤ p ≤p (15)
,min ,max
f f f
p ≤ p ≤p (16)
( ) (
)
(
wb i,, w i,, w, sw p , a f, p)
R. Agrawal et al.
Figure 5. The predicted heat rejection rate of the cross-flow CWCT under
constant flow rates of three fluids.
5. Conclusion
The significance of this study is to promote CWCT for water -cooled chillers under the climate change. A sim-plified model for the cooling load of CWCT operating, adapted from an existing model, has been developed based on the assumed suitable conditions. The model has been validated on data from CWCT tests for some given conditions (cooling water inlet parameters, wet-bulb temperatures, spray water flow rates and air flow rates). The parameterization is obtained by the Levenberg-Marquardt method. Assuming the dynamic viscosity coefficient of spray water is constant over small ranges of temperature, the heat rejection rates of the calculated and predicted results are in good agreement with each other. The results of the model verification show that the models with new parameters are accurate enough (RMSRE < 0.1)for the control and optimization of CWCT operation. As time goes on, the characteristic parameters of the tower should be updated periodically because of the effect of negative factors, such as spray water pollution. The quantitative relationships between power con-sumption and main input-output variables of CWCT should be determined by the combination of the model and input power model.
Acknowledgements
The author Rishabh Agrawal, wishes to express his gratitudes and sincere appreciations to all the faculty and staff members of Centre for Energy Studies, Indian Institute of Technology, Delhi for his unconditional support and constructive suggestions.
References
[1] Bureau of Energy Efficiency, Ministry of Power, Government of India (2009) Energy Conservation Building Code (ECBC). Bureau of Energy Efficiency, Ministry of Power, Government of India, New Delhi.
[2] (2011) CO2 Emissions from Fuel Combustion Highlights. 2011 Edition, International Energy Agency, France. [3] (2012) Natural Gas—Proved Reserves. CIA World Fact Book.
[4] ASHRAE (2008) ASHRAE Handbook—2008 HVAC Systems and Equipment: American Society of Heating,
Refri-gerating, and Air-Conditioning Engineers.
R. Agrawal et al.
343
Applied Thermal Engineering, 20, 1225-1236.http://dx.doi.org/10.1016/S1359-4311(99)00096-4
[6] Facão, J. and Oliveira, A. (2004) Heat and Mass Transfer Correlations for the Design of Small Indirect Contact Cool-ing Towers. Applied Thermal Engineering, 24, 1969-1978.http://dx.doi.org/10.1016/j.applthermaleng.2004.02.007 [7] Xia, Z.Z., Chen, C.J. and Wang, R.Z. (2011) Numerical Simulation of a Closed Wet Cooling Tower with Novel Design.
International Journal of Heat and Mass Transfer, 54, 2367-2374. http://dx.doi.org/10.1016/j.ijheatmasstransfer.2011.02.025
[8] Zheng, W.Y., Zhu, D.S., Zhou, G.Y., Wu, J.F. and Shi, Y.Y. (2012) Thermal Performance Analysis of Closed Wet Cooling Towers under both Unsaturated and Supersaturated Conditions. International Journal of Heat and Mass Transfer, 55, 7803-7811. http://dx.doi.org/10.1016/j.ijheatmasstransfer.2012.08.006
[9] Papaefthimiou, V.D., Rogdakis, E.D., Koronaki, I.P. and Zannis, T.C. (2012) Thermodynamic Study of the Effects of Ambient Air Conditions on the Thermal Performance Characteristics of a Closed Wet Cooling Tower. Applied Ther-mal Engineering, 33-34, 199-207. http://dx.doi.org/10.1016/j.applthermaleng.2011.09.035
[10] Sarker, M.M.A., Kim, E., Moon, C.G. and Yoon, J.I. (2008) Performance Characteristics of the Hybrid Closed Circuit Cooling Tower. Energy and Buildings, 40, 1529-1535. http://dx.doi.org/10.1016/j.enbuild.2008.02.010
[11] Hasan, A. and Sirén, K. (2002) Theoretical and Computational Analysis of Closed Wet Cooling Towers and Its Appli-cations in Cooling of Buildings. Energy and Buildings, 34, 477-486. http://dx.doi.org/10.1016/S0378-7788(01)00131-1 [12] Stabat, P. and Marchio, D. (2004) Simplified Model for Indirect-Contact Evaporative Cooling-Tower Behaviour.
Ap-plied Energy, 78, 433-451. http://dx.doi.org/10.1016/j.apenergy.2003.09.004
[13] Li, Y.A. (2008) Closed-Circuit Cooling Tower for Air Conditioning. China Architecture & Building Press, Beijing. (In Chinese)
[14] Lian, Z.W., Zhang, Y.P., Chen, B.M. and Cao, D.X. (2005) Heat and Mass Transfer Principles and Equipment. China Architecture & Building Press, Beijing. (In Chinese)
[15] Jin, G.Y., Cai, W.J., Lu, L., Lee, E.L. and Chiang, A. (2007) A Simplified Modeling of Mechanical Cooling Tower for Control and Optimization of HVAC Systems. Energy Conversion and Management, 48, 355-365.
http://dx.doi.org/10.1016/j.enconman.2006.07.010
[16] Jiang, J.J., Liu, X.H. and Jiang, Y. (2013) Experimental and Numerical Analysis of a Cross-Flow Closed Wet Cooling Tower. Applied Thermal Engineering, 61, 678-689. http://dx.doi.org/10.1016/j.applthermaleng.2013.08.043
[17] You, J. (2010) Numerical Simulation and Optimization of Closed-Wet Cooling Tower. Master Thesis, School of Envi-ronmental Science and Engineering, Donghua University, Shanghai. (In Chinese)
[18] Cortinovis, G.F., Paiva, J.L., Song, T.W. and Pinto, J.M. (2009) A Systemic Approach for Optimal Cooling Tower Operation. Energy Conversion and Management, 50, 2200-2209. http://dx.doi.org/10.1016/j.enconman.2009.04.033 [19] Al-Bassam, E. and Alasseri, R. (2013) Measurable Energy Savings of Installing Variable Frequency Drives for
Cool-ing Towers’ Fans, Compared to Dual Speed Motors. Energy and Buildings, 67, 261-266. http://dx.doi.org/10.1016/j.enbuild.2013.07.081

![Figure 1 mm (Width) × 180 mm (Length). As shown in the figure, the spray water flow is in cross flow with the air flow RETRACTEDindicates the sketch of a cross-flow CWCT unit [17]](https://thumb-us.123doks.com/thumbv2/123dok_us/8099791.787420/6.595.87.535.247.659/figure-width-length-figure-retractedindicates-sketch-cross-cwct.webp)
![Table 3. The experimental data of the counter-flow CWCT test [17].](https://thumb-us.123doks.com/thumbv2/123dok_us/8099791.787420/8.595.119.474.282.586/table-experimental-data-counter-flow-cwct-test.webp)