2017 International Conference on Computer Science and Application Engineering (CSAE 2017) ISBN: 978-1-60595-505-6
Using Convolutional Layer Features for Indoor Human Activity
Recognition based on Spatial Location Information
Jun Li, Jiaxiang Zhao, Jing Li and Yingdong Ma*
IT Academy, Inner Mongolia University, 010021 Inner Mongolia, China
ABSTRACT
Identifying human actions has great importance for various applications, especially in the smart home, fitness tracking and health monitoring domains. However, human activity recognition still remains a challenging task. This is mainly due to the broad range of human activities as well as the rich variation of a given activity can be performed. In this paper, we dealt with the problem by making use of spatial location information of three different parts of a human body, which are derived via three UWB (ultrawide band) tags and an Ubisense positioning system. In order to improve the accuracy, we proposed a recognition method: convolutional layer features plus SVM (Support Vector Machine). We pre-process the raw spatial location data and transfer them into motion feature, frequency feature and statistic feature. These features are input into the CNN (Convolutional Neural Network) to generate the convolutional layer features, and then we use SVM to classify these features. By comparing the experimental results, the best recognition rate of different experimenters is 89.75%, which shows its feasibility.
INTRODUCTION
In recent years, the rapid spread of devices with sensing capabilities has created a huge demand for human activity recognition (AR). Applications that can benefit from AR include smart home, smart healthcare, senior care, personal fitness, etc. [1, 2]. Nowadays, many approaches with different features were proposed to recognize a wide range of activities. Most of these approaches rely on the statistic features, such as mean, variance, entropy or correlation coefficient. In general, existing approaches can be divided into two classes: vision-based methods and sensor-based methods [3]. With the rapid development of MEMS (Micro Electro Mechanical Systems) and sensing technologies, the sensor-based category is becoming more popular, and the method proposed in this work belongs to the second category. Different from the existing sensor-based approaches that strongly depend on various sensors, this paper focuses on the issue of recognizing indoor human actions via spatial location information.
more, the Ubisense system presents the following advantages: firstly, it is a non-line-of-sight technology with a range in free space of a few tens of meters, which makes it practical to cover large indoor areas; secondly, it is easy to filter the signal to minimize the multipath distortions which are the main cause of inaccuracy in RF indoor location systems; and finally, it has low power consumption, fine safety, high reliability and utility value. Then, we use the convolutional layer features of Convolutional Neural Networks (CNN) [5] to recognize activities over the Ubisense system.
RRLATED WORK
AR can be considered as a classification problem, where the input is time series signal and the output is corresponding class label of the activity. In general, the process over activity recognition is divided into two phases: to begin with, we extract features from the raw time series data; next these features with the labels are used to train a classification model.
Feature extraction for AR is one of the key components. Generally, statistic features such as mean, standard deviation, entropy and correlation coefficients are the traditional hand-deigned features in AR. In addition, Fourier transforms [6], wavelet transforms [7] and discrete cosine transforms (DCT) [8, 9] are the other three commonly used hand-crafted features.
In recent years, some approaches such as principal component analysis (PCA) [10] and restricted Boltzmann machine (RBM) [11] were also applied to adapt the feature extraction over the dataset. The mapping from raw signals to features is not predefined, but automatically learned from the training dataset. In addition, with the rising popularity of machine learning DNN (Deep Neural Network)[12] has made some breakthroughs in many research areas as well. The deep architectures can represent complex function compactly, which have been demonstrated to outperform most of the algorithms in many applications.
However, the fully connected DNN models, they do not capture local dependencies of the time series signals. Thus, some methods utilized the Convolution Neural Network (CNN) [13, 14, 15] which consists of one or more pairs of convolution and pooling layers. Since the convolutional layer with a set of local filters are able to capture the small local parts of the input, and the pooling layer can preserve the invariant features. This hierarchical organization often presents competitive results in image processing and speech recognition tasks.
METHOD
Data Collection
The UWB tags, part of the Ubisense positioning platform, are used to collecting the spatial location information when the experimenters are performing actions. In the scene of our experiment, three UWB-RFID tags are attached in the right wrist, right waist and right ankle of every experimenter. The Ubisense positioning platform continuously reports location information of each UWB-RFID tags at the frequency of 10Hz and then synchronously returns the data structure in the format of (ID, T, X, Y, Z), where ID denotes the unique tag ID, T denotes the positioning time, and X, Y, Z are the three-dimensional coordinate of the tag location.
Data Preprocessing
The data preprocessing is routinely including two steps: firstly, all the location data sequences have to be segmented into a certain number of samples by one time sliding window which is set as 0.972 second, 1.118 second, 1.404 second and 1.620 second. In our experiment, the best result, 89.75% recognition rate, was obtained when the time sliding window is set as 1.620 second. Secondly, a median filter with window size of 3 is applied to weaken the effect of environment noise.
Feature Extraction
Ideally, features that input to the system for learning should be independent of the location. As a result, three kinds of features: motion features, frequency features and statistic features are considered in this work.
Firstly, the motion features consist of two parts: the first part includes speed, acceleration, displacement distance, and height of one UWB-RFID tag. The second part involves the relative speed, relative acceleration, and relative displacement distance of any two UWB-RFID tags in one data sequence segment. Secondly, the frequency features was obtained by performing the fast Fourier transform method on the speed, acceleration and the height. Finally, the statistic feature was calculated by the standard deviation and mean value of each tag’s displacement distance and the relative displacement distance of two tags for each data sequence segment motion feature. Consequently, for the 0.972-second setting, the dimension of the feature is 255. The dimension increases to 303 over the 1.118-second setting. For the 1.404-second setting and the 1.620-second setting, the dimensions are 339 and 375, respectively.
CNN-SVM Model
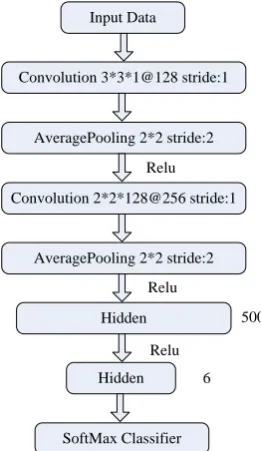
As shown in Figure 1, our model is composed by concatenating two individual components, the pre-trained CNN [16] feature extraction part and the SVM part.
pre-trained by the same training dataset as we used in our model. As is shown in the figure, the pre-trained model consists of two pairs of convolutional layer with pooling layer and the kernel size over each convolutional layer is 3*3 which is small enough to capture the more distinguish features over the time series signal. The more details about the pre-trained CNN are described in [16]. In our paper, we try to collect convolutional layer features from both of the convolutional layers for comparisons.
Figure 1. The pipeline of our model, which is a concatenation of low-level feature extraction of
pre-trained CNN model and SVM classifier learned with respect to diverse task.
Input Data
Convolution 3*3*1@128 stride:1
AveragePooling 2*2 stride:2
Convolution 2*2*128@256 stride:1
AveragePooling 2*2 stride:2
Hidden
Hidden
SoftMax Classifier Relu
Relu
Relu
6 500
Figure 2. The structure of our trained CNN model.
RESULTS Dataset
We collect data from ten different experimenters in our lab. Every
Input Data
Convolutional Layer
Pooling Layer
Convolutional layer feature
SVM classifier Convolutional Layer
[image:4.595.217.348.431.657.2]experimenter is required to repeat one single action within 2 minutes. Since the time sliding windows are set into 4 scales, the training dataset and the testing data set are divided into 4 groups. One group is for one time sliding window, and for each time sliding window, the training data and the testing data was randomly selected, the details are listed in TABLE I and TABLE II.
TABLE I. TRAINING DATASET.
Time sliding
window(s) Group Walking Sitting Lying Standing Jumping Jogging Total
0.972 1 1041 1102 1206 1133 1084 1070 6636
1.118 2 853 904 984 924 906 869 5440
1.404 3 717 753 843 795 747 732 4587
1.620 4 649 668 744 687 664 636 4048
TABLE II. TESTING DATASET.
Time sliding
window(s) Group Walking Sitting Lying Standing Jumping Jogging Total
0.972 1 86 67 90 87 90 80 500
1.118 2 86 70 93 91 70 90 500
1.404 3 86 80 82 75 88 89 500
1.620 4 54 60 89 75 94 81 453
FEATURE ANALYSIS
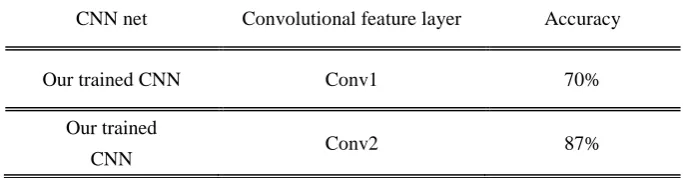
[image:5.595.117.459.606.695.2]In this section we want to analyze the correlation between the convolutional layer features and the performance. We use a straightforward way to determine how much significance each convolutional layer feature accounts for the SVM model. The TABLE III presents the final accuracy of each convolutional layer feature over the Data group 1 of testing data set. For we just intend to verify the relative performance of the convolutional features over each layer on the pre-trained CNN model, we just run the experiments on the Data group 1 of testing and training dataset.
TABLE III. FINAL ACCURACY OF THE DATA GROUP 1OF TESTING DATASET.
CNN net Convolutional feature layer Accuracy
Our trained CNN Conv1 70%
Our trained
CNN Conv2 87%
the Conv2 is much better than that over Con1. Thus, we choose the Conv2 over our trained CNN model as one of the key component of our final model while the other important component is SVM.
Experiment Results
Finally, to validate the efficiency of the proposed method, we conduct experiments over our model as shown in Figure 1 and all the experiments are conducted on our final model. We also compare the results with the other traditional methods: RBM, DNN and the stand-alone CNN model. The testing results are listed in TABLE IV. As we can see, the new approach outperforms the rest of the models, and the best result was obtained on group-4. Especially, our model is better than the sand-alone CNN mode. In my view, the main reason is as below: firstly, the top fully connected layer in stand-alone CNN model would compromise the distinguish ability of the feature generated by the convolutional layer in our experiments while our model just did not take account into the effect caused by the top fully connected layer. Secondly, it seems that the SVM classifier is more appropriate than the CNN classifier for our topic. The further reason will be discussed in future work.
TABLE IV. TESTING ACCURACY OVER EACH CONVOLUTIONAL LAYER FEATURE.
Group input dimension RBM DNN CNN accuracy(%) Our accuracy(%)
1 16*16 79.4 80.6 84.6 86.9
2 18*18 81.3 82.1 85.2 87.2
3 19*19 78.4 80.6 82.6 85.7
4 20*20 82.4 82.4 87.6 89.75
TABLE V. THE CONFUSION MATRIX OF THE TEST
RESULT OF GROUP-4 ON OUR MODEL.
Predict Class
Accuracy
(%)
Label Running Jumping Standing Sitting Jogging Lying
Actual
Class
Running 66 1 0 1 9 4 82.7
Jumping 2 60 4 1 0 0 89.5
Standing 1 3 70 0 0 1 93.3
Sitting 2 0 0 58 0 0 96.7
Jogging 9 1 1 0 41 2 75.9
Lying 7 0 0 0 5 77 86.5
of every action are different. Our experiment shows that the best result was achieved when the time sliding window is set as 1.62 second. It demonstrates the feasibility of our model.
CONCLUSIONS
In this paper, we presented the system for recognizing six ordinary human actions by using spatial information obtained from the Ubisense positioning system. This system is based on the CNN model and SVM that extracts the local dependency and scale invariant features of the raw data, and the experimental results confirmed the efficiency of the proposed system.
For future work, experiments with larger dataset are needed to further study the robustness of our model. Further improvements may be achieved by using unsupervised pre-training and then extracting the features over them.
ACKNOWLEDGEMENT
This research was supported by the National Natural Science Foundation of China under Grant 61461039 and 2017 innovation program in Inner Mongolia autonomous region under Grant 10000-16010109.
REFERENCES
1. Chennuru, Snehal, et al. 2010. "Mobile Lifelogger–Recording, Indexing, and Understanding a Mobile User’s Life," International Conference on Mobile Computing, Applications, and Services. Springer, Berlin, Heidelberg, 2010.
2. Wu, Pang, et al. 2011. "Senscare: Semi-automatic activity summarization system for elderly
care," International Conference on Mobile Computing, Applications, and Services. Springer,
Berlin, Heidelberg, 2011.
3. Yang, Qiang. 2009. "Activity Recognition: Linking Low-level Sensors to High-level
Intelligence," IJCAI, 2009, 9.
4. Steggles, Pete, and Stephan Gschwind. 2005. "The Ubisense smart space platform," 2005, pp.
73-76.
5. Krizhevsky, Alex, Ilya Sutskever, and Geoffrey E. Hinton. 2012. "Imagenet classification with
deep convolutional neural networks," Advances in neural information processing systems,
2012.
6. Sabes, Philip N., and Michael I. Jordan. 1995. "Advances in neural information processing
systems," in G. Tesauro & D. Touretzky & T. Leed (Eds.), Advances in Neural Information
Processing Systems, 1995.
7. Mannini, Andrea, et al. 2013. "Activity recognition using a single accelerometer placed at the
8. Khelalef, Aziz, Fakhreddine Ababsa, and Nabil Benoudjit. 2016. "A simple human activity
recognition technique using DCT," International Conference on Advanced Concepts for
Intelligent Vision Systems, Springer International Publishing, 2016.
9. Lara, Oscar D., and Miguel A. Labrador. 2013. "A survey on human activity recognition using
wearable sensors," IEEE Communications Surveys and Tutorials, 15(3): 1192-1209.
10. Bugdol, Marcin D., et al. 2016. "Human Activity Recognition Using Smartphone
Sensors," Information Technologies in Medicine. Springer, Cham, 2016, pp. 41-47.
11. Plötz, Thomas, Nils Y. Hammerla, and Patrick Olivier. 2011. "Feature learning for activity
recognition in ubiquitous computing," IJCAI Proceedings-International Joint Conference on
Artificial Intelligence, 22(1).
12. Ronao, Charissa Ann, and Sung-Bae Cho. 2016. "Human activity recognition with smartphone
sensors using deep learning neural networks," Expert Systems with Applications, 59: 235-244.
13. Yang, Jianbo, et al. 2015. "Deep Convolutional Neural Networks on Multichannel Time Series
for Human Activity Recognition," IJCAI. 2015.
14. Hammerla, Nils Y., Shane Halloran, and Thomas Ploetz. 2016. "Deep, convolutional, and
recurrent models for human activity recognition using wearables," arXiv preprint
arXiv:1604.08880.
15. Wang, Keze, et al. 2014. "3D human activity recognition with reconfigurable convolutional
neural networks," Proceedings of the 22nd ACM international conference on Multimedia.
ACM, 2014.
16. Jun, et al. 2017. "Convolutional neural networks (CNN) for indoor human activity recognition
using Ubisense system," Control And Decision Conference (CCDC), 2017 29th Chinese, IEEE,