Abdulrasool, Salah Mahdi and Mishra, Rakesh
Computer Assisted Laboratory Instructions: Learning Outcomes Analysis
Original Citation
Abdulrasool, Salah Mahdi and Mishra, Rakesh (2006) Computer Assisted Laboratory Instructions: Learning Outcomes Analysis. In: Proceedings of IV international conference on multimedia and information and communication technologies in communication. mICTE, Seville, Spain, pp. 330 341. ISBN 8469024698
This version is available at http://eprints.hud.ac.uk/id/eprint/7683/
The University Repository is a digital collection of the research output of the University, available on Open Access. Copyright and Moral Rights for the items on this site are retained by the individual author and/or other copyright owners. Users may access full items free of charge; copies of full text items generally can be reproduced, displayed or performed and given to third parties in any format or medium for personal research or study, educational or notforprofit purposes without prior permission or charge, provided:
• The authors, title and full bibliographic details is credited in any copy; • A hyperlink and/or URL is included for the original metadata page; and • The content is not changed in any way.
For more information, including our policy and submission procedure, please contact the Repository Team at: [email protected].
Page 1
Computer Assisted Laboratory Instructions: Learning Outcomes Analysis
Dr R.Mishra ,
-2 Salah Abdulrasool ,
-1
University of Huddersfield, Queensgate, Huddersfield, HD1 3DH, UK
This paper presents results of a case study undertaken to understand the effect of computer assisted teaching methodology on learning effectiveness in a laboratory environment. The effects of computer assisted instructions on different levels of cognition of individual learners, as described by Bloom’s Taxonomy have been evaluated.
For this students in mechanical engineering subject area were exposed to computer assisted instructions to satisfy following learning outcomes in computer aided design/computer aided manufacturing module.
i- Creation of drawing and design using Computer aided design ii- Using data exchange format (DXF) to create numerical control file iii- Final setup check of computerised numerical control machine iv- Final manufacturing of the product using CNC
v- valuation
The teaching and learning methodology consisted of a teacher delivering a lecture on the basics of the operation and then explaining entire operation with the help of a software coupled to the CNC machine. This enabled students to carry out repeated tests on the software till they felt confident in carrying out the above operations. At the end all students were examined for knowledge, comprehension, application, analysis, synthesis and evaluation. A typical flow chart explaining the above operations is shown below.
The results indicated that computer assisted instructions help students achieve learning out comes at all levels of cognitive domains. A correlation was seen between the pre test ability of students and the levels of cognition most affected. High pre test ability students gained both in high and low levels of cognition where as low ability students gained primarily in low levels of cognition namely knowledge acquisition and routine application.
Page 2
1- Introduction
The engineering education and practices being adopted therein are changing at a very fast rate. The visual and simulation capabilities of computer added teaching materials and inherent flexibility in their use have forced educators to develop computer assisted instructions to assist in teaching learning process [1, 2, 3]. The specific advantages offered by computing resources to traditional teaching are quick calculations, data storage and dynamic simulations. It has been shown the availability of computing resources can result in dramatic improvement in learning experience of students if integrated properly with existing teaching methods [4, 5, 6]. A lot of literature is currently being published on making e learning more effective to widen its base and acceptability. At the same time traditional teaching techniques are being modified to satisfy stringent quantitative quality requirements.
In engineering education especially in CAD/CAM area there is a need to understand the mechanics of learning process from learner’s point of view, [1, 5] to satisfy learning outcomes requirements. The aims and objectives of such modules are defined carefully to enable students to satisfy workforce requirements in the industry after they gain qualifications.
Through this proposal it is proposed to investigate how individual learners learn the above operations in a group setting and how computer assisted instructions affect various learning outcomes as compared to traditional teaching instruction.
To investigate the above two student groups were formed each having 15 students with almost similar average marks in pre class examination as shown in table 1.
Table 1: Pre-test ability
The group 1 students (having low standard deviation in marks indicating an almost homogeneous group) were exposed to traditional teaching where as group 2 students (having high standard deviation indicating heterogeneous group) were exposed to computer assisted instructions.
Teaching methods No of students
Level of student Marks
Average Marks Standard Deviation
Traditional Teaching 15 67 5.84
Computer Assisted
Page 3
2- Learning activities
To learn skills required to satisfy outcomes as shown pictorially in figure 1, various learning activities were formulated in a modular pattern. The required learning activities have been catagorised under six modules as explained below. Students were required to acquire skills in all the learning activities. The time allocated for each activity has also been shown in the table 2. Out of these six, four sections are for computer sketching which require 5 hours each and one section is for prototyping which requires 15 hours of lecturing and demonstration. The last section requires 25 hours within which project, analysis, and evaluation of student’s skills is carried out.
Table 2: Activities and learning outcomes
Activities and learning outcomes/Modules and time
computer sketching creation of design & drawing): Time (5 hours)
Set up the sketch plane units and grid parameters; demonstrate all 2-D sketching primitives; demonstrate all line editing features; make simple extrusions and revolutions to get 3-D geometry Demonstrate the creation and editing of dimensions; set geometric constraints; make simple extrusion and revolution to get 3-D; render the parts.
computer sketching modeling utilities): Time (5hours)
Create 3-Dparts; add feature-based, parametric design features; use advanced sweep operations; edit the geometry in 3-D; render the part.
computer sketching assembly modeling and mating):Time (5hours)
Create individual 3-D parts; assemble parts as mechanical assembly; mate features as appropriate; check for clearance and interference of parts; create color rendering of assembly.
computer sketching engineering drawing): Time (5 hours)
Create section views in 3- D and 2-D; create individual 3-D parts; make different 3-D section views of the parts; export acceptable color image files of 3-D section views for presentation purpose. Project 2-D section views of model; incorporate the 2-D section views into a technical drawing.
Generate and dimensioning three-view drawing on a suitable drawing sheet style; add centerlines where appropriate; dimension the drawing; add a title block and appropriate notes.
Save each part as DXF file.
Rapid prototyping using data exchange format- DXF and setup check and final manufacturing): Time (15 hours).
Create cutting parameter for each part (cutting tool, tool size, tool materials, and work materials).
Generate tool paths for different layers for each part (X, Y, Z direction, cutting loop, and depth of cut, feed and speed).
Save each part as numerical control (NC) file and send the file to the prototyping machine.
Set the work piece; set the tool at zero position; check direction of rotation for the chuck and the cutter; check the work piece and the cutting tool is securely
clamped; verify the NC program for any shaft and any gear, and simulate the motion of assembly file of the shaft and gear ); run the machine and then the program.
Project and Analysis (manufacturing): Time (25 hours).
Generate final checklist for prototype (dimensions, assembly, motion, tolerance and fit).
Page 4
All the above modules were incorporated in teaching design and manufacture of a Ratchet braes assembly as shown below (figure 1). This Ratchet Braes assembly consists of different parts and students were taught computer aided design of individual components, assembly and manufacture using two different teaching methodologies described below.
Figure 1
Table 3: Activities covered
Part No Part Name Module Covered Activities Covered
1 Driving plate 1, 2, 3, 4, 5, 6 Drawing and manufacturing on (CNC)
2 Handle 1, 2, 3, 4, 6 Drawing
3 Plate screws 1, 2, 3, 4, 6 Drawing
4 Supporting plate 1, 2, 3, 4, 5, 6 Drawing and manufacturing on (CNC)
5 Cam lock 1, 2, 3, 4, 6 Drawing
6 Cam screw 1, 2, 3, 4, 6 Drawing 7 Came spring 1, 2, 3, 4, 6 Drawing 8 Spring screws 1, 2, 3, 4, 6 Drawing
9 Driving gear 1, 2, 3, 4, 5, 6 Drawing and manufacturing on (CNC) 10 Stationary bearing 1, 2, 3, 4, 5, 6 Drawing and manufacturing ( Traditional Machine) 11 Driving spindle 1, 2, 3, 4, 5, 6 Drawing and manufacturing on (CNC) 12 Supporting bevel 1, 2, 3, 4, 5, 6 Drawing and manufacturing (Traditional Machine) 13 Connection 1, 2, 3, 4, 5, 6 Drawing and manufacturing ( Traditional Machine)
Part 1 , 2 , 3 , 4 , 5 , 6
Page 5
3- Teaching and learning process
3-1 Group 1: Traditional classroom teaching
Various features of traditional classroom teaching are shown in the (figure 2) the important features of this process are given below
a) The instructor delivers the lecture with the use of computer interface of spectra light linked with projector.
b) The students were given manual, hand book and access to computers to work with teacher.
c) Teacher helped them in case of any difficulty.
d) The above steps (a) to (c) were used in teaching of CAD, CAM and CNC applications.
Knowledge Transfer
Analysis Module 6
Students perfecting their skills with computers and handouts
Page 6
3.2 Group2 Computer assisted instructions
Various features of computer assisted instructions are shown in figure3. Various important features of this teaching methodology are as given below.
a. The instructor delivers the lecture with the use of computer interface of spectra light linked with projector.
b. The students were given manual, hand book and access to computers to work with teacher. Along with these computers simulation software is provided to students which describe step by step procedure dynamically.
c. Teacher helped them incase of any difficulty.
d. The above steps (a) to (c) were used in teaching of CAD, CAM and CNC applications.
Page 7
4. Evaluation
At the end of two different teaching learning processes learning outcomes analyses of the two groups were carried out. Following five learning outcomes were evaluated.
a) Creation of drawing and design using Computer aided design software b) Using data exchange format (DXF) to create numerical control file c) Final setup check of computerised numerical control machine d) Final manufacturing of the product using CNC.
e) Quality evaluation.
The effects of computer assisted instructions on different levels of cognition of individual learners, as described by Bloom’s Taxonomy have been evaluated in knowledge, comprehension, application, analysis, synthesis and evaluation. As shown below in table4.
Table 4; Description of various activities associated with various cognition levels
High
level Level Elements Tasks
6 Evaluations
Judges the value of information
Example (attached assembly drawing with the engineering drawing to judge final shape of the drawing with given dimension also to judge final products fitness, shape, movements and quality.
5 Synthesis
Builds a pattern from divers elements
Example (arrange the view of the engineering drawing 1st angle and 3rd angle, assemble different parts to create project in final shape, design anew shape and modify the shape to anther shape, arranging machine tools, materials and instruments for final manufacturing.
4 Analysis
Separates information into part for better understanding Example (analyzing drawing parts during assembly drawing and using program facilities to calculate missing dimensions of engineering drawing analyzing verifying the manufacturing operations.
3 Application
Applying knowledge to anew situation
Example (sketching, applying, demonstrating, modeling, assembly, demonstrating and verifying the manufacturing operations.
2 Comprehension
Understanding information
Example (select program feature, locate design and drawing geometry, select and locate cutting parameters, setting the tools and the work piece.
Low level
1 Knowledge
Recall of data
Page 8
[image:9.595.41.556.121.308.2]Comparisons were made between traditional teaching method and teaching with computer assisted instructions. The students in both groups were assigned tasks to design and manufacture four different parts) as show in figure 4.
Figure 4: Tasks used in evaluation
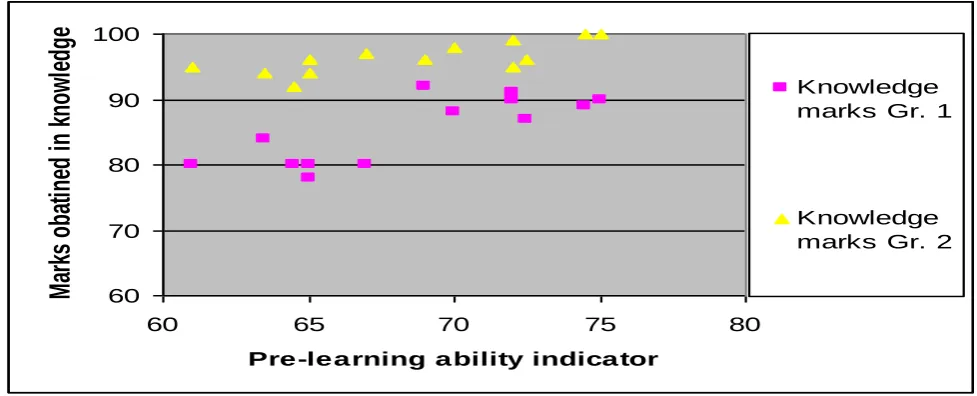
The students were then marked out of 100 for each cognition level namely knowledge, comprehension, application, analysis, synthesis and evaluation.
Figure 5 shows correlation between pre-test ability indicators with the marks obtained for the two groups in the knowledge cognition level. It can be seen that both groups show considerable improvement in knowledge. The distribution of marks for group2 students indicates that the difference between high achievers and low achievers is quite small. The distribution of marks for group 1 students however indicates that although overall learning is satisfactory low pre-ability students do not benefit as mush as high pre-ability students. This indicates that for heterogeneous group of student's computer assisted instructions help in satisfactory achievement of learning outcomes.
60 70 80 90 100
60 65 70 75 80
Pre-learning ability indicator
M
ar
ks
o
ba
tin
ed
in
k
no
w
le
dg
e
Knowledge marks Gr. 1
[image:9.595.44.533.555.753.2]Knowledge marks Gr. 2
Figure 5: Variation of marks obtained in knowledge cognition level
Page 9
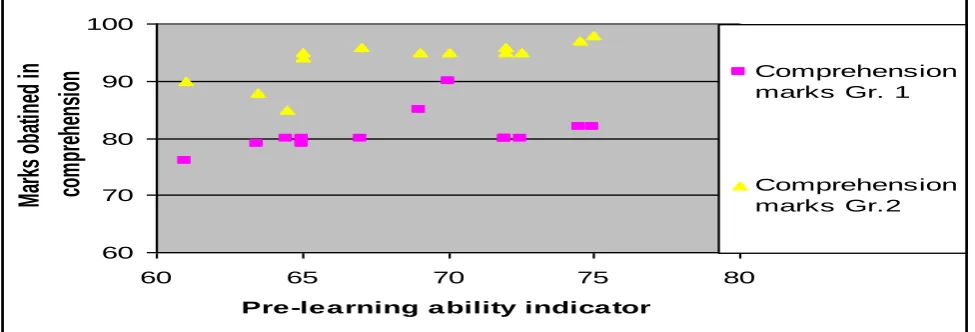
Figure 6 shows variation of marks obtained in comprehension cognition level for the two groups. In the comprehension level students were required to understand the information like drawing geometry, selecting and locating cutting parameters, setting the tools and the work piece. The figure indicates that the overall trends are similar to that seen in knowledge cognition level although the scatter in the marks has increased for both the groups.
60 70 80 90 100
60 65 70 75 80
Pre -le a rning a bility indica tor
M
ar
ks
o
ba
tin
ed
in
co
m
pr
eh
en
si
on
Comprehension marks Gr. 1 [image:10.595.47.535.188.354.2]Comprehension marks Gr.2
Figure 6: Variation of marks obtained in comprehension cognition level
Figure 7 shows the variation of marks in application cognition level. This level evaluates students’ ability to sketch, apply, demonstrate, model, assemble as well as demonstrate and verify the manufacturing operations. Again in this cognition level group 2 students did better than group 1 students although the scatter in marks is almost similar.
60 70 80 90 100
60 65 70 75 80
Pre -le a rning a bility indica tor
M
ar
ks
o
ba
tin
ed
in
a
pp
lic
at
io
n
Application marks Gr. 1 [image:10.595.46.536.460.630.2]Application marks Gr.2
Page 10
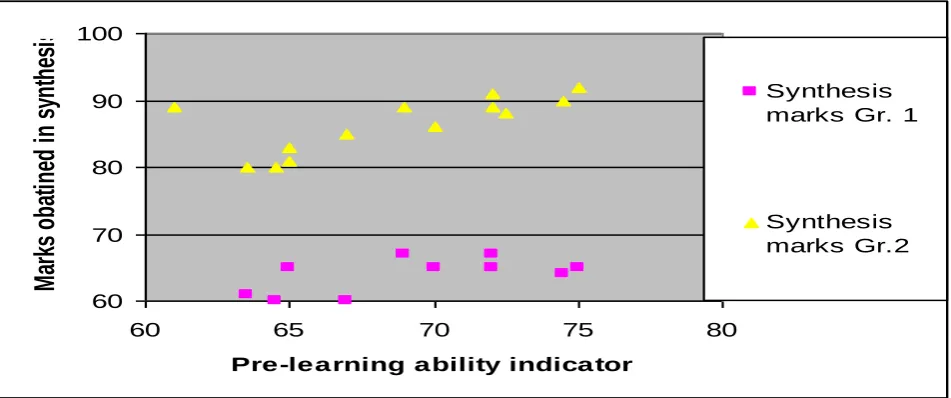
Figures 8 and 9 show variation of marks obtained in the analysis and synthesis cognition levels for the two groups. These figures again shows effectiveness of computer assisted instruction as compared to the traditional teaching
60 70 80 90 100
60 65 70 75 80
Pre -le a rning a bility indica tor
Ma
rk
s o
ba
tin
ed
in
an
aly
sis
Analysis marks Gr. 1
[image:11.595.51.527.334.533.2]Analysis marks Gr.2
Figure 8: Variation of marks obtained in analysis cognition level
60 70 80 90 100
60 65 70 75 80
Pre-learning ability indicator
M
ar
ks
o
ba
tin
ed
in
s
yn
th
es
is
Synthesis marks Gr. 1Synthesis marks Gr.2
Figure 9: Variation of marks obtained in synthesis cognition level
In these cognition levels students were evaluated for their abilities in analyzing drawing parts during assembly drawing and using program facilities to calculate missing dimensions of engineering drawing. This also requires students to be capable in analyzing and verifying the manufacturing operations, assembling different parts to create prototype in final shape, designing a new shape and modifying one shape to another shape, arranging machine tools, materials and instruments for final manufacture.
Page 11
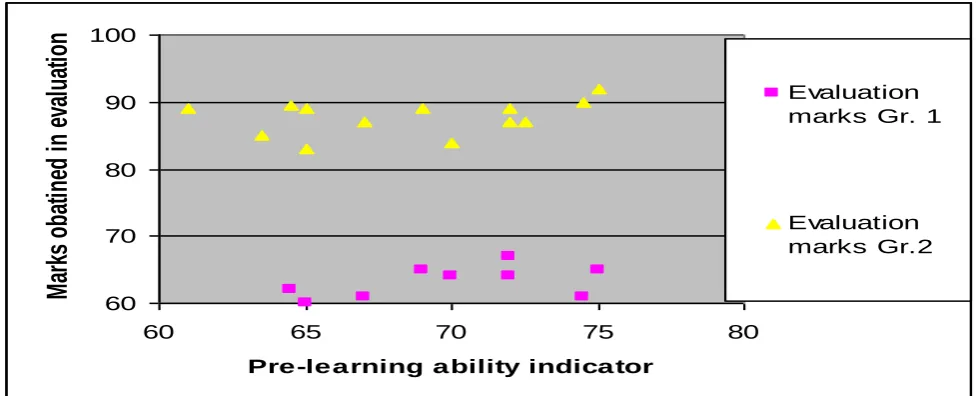
The performance of the two groups in the evaluation cognition domain has been depicted in figure 10.
60 70 80 90 100
60 65 70 75 80
Pre-learning ability indicator
M
ar
ks
o
ba
tin
ed
in
e
va
lu
at
io
n
Evaluation marks Gr. 1
[image:12.595.45.535.116.314.2]Evaluation marks Gr.2
Figure 10: Variation of marks obtained in eveluation cognition level
This cognition level tests students’ ability to judge the value of the information with regard final products fitness, shape, movements and quality.
This figure shows that group students have performed much better as compared to group 1 students. It can be further seen that although group 2 has students with widely varying pre-abilities, the computer assisted instruction helped them achieve all the learning outcomes in a satisfactory manner and the difference between high achievers and low achievers is very small. This indicates that computer assisted instructions are much better in handling a heterogeneous group of students.
5- Conclusion
This study has clearly demonstrated the effectiveness of computer assisted instructions in a heterogeneous group learning activity. It has been seen that the group exposed to computer assisted instructions performed much better than the group exposed to traditional teaching. Further computer assisted instruction helped students widely differing pre-learning abilities to satisfy various learning outcomes CAD/CAM subject area.
Acknowledgement
Page 12
References
- Marcy J.Wang, M.A , Paul B.Contino,M.A , Edwin S. Ramirez, B.S Gustave L, and Janet W.Levy. 2000. Implementing cognitive learning strategies in computer-based educational technology. New York, New York.
2- Caroline Baillie & Ivan Moore. 2004. Effective learning & teaching in engineering USA, Canada
3- J.Bourne, A Brodersen, M.Daw. 2000. The influence of technology on Engineering Education. NewYork, London, Tokyo
4- James E.Gall. 2001-2002. rethinking the computer in education. J, Educational Technology systems, 30(4), 379-388.
5- Suresh K. Bhavnani and Bonnie E. John - Carnegie Mellon University, 2000.The strategic use of complex computer systems. Human-Computer interaction,15,107-137.
6- Ton de Jony and Luigi Sarti. 1994. Design and Production of Multimedia and Simulation-Based Learning Material. Netherlands
7- Heather Fry. Steve ketterdge, Stephanie Marshall. 2003. A hand Book for teaching &learning in higher Education- Enhancing academic practice