University of Huddersfield Repository
Li, TukunSoftgauges for surface texture
Original Citation
Li, Tukun (2011) Softgauges for surface texture. Doctoral thesis, University of Huddersfield.
This version is available at http://eprints.hud.ac.uk/id/eprint/11357/
The University Repository is a digital collection of the research output of the University, available on Open Access. Copyright and Moral Rights for the items on this site are retained by the individual author and/or other copyright owners. Users may access full items free of charge; copies of full text items generally can be reproduced, displayed or performed and given to third parties in any format or medium for personal research or study, educational or notforprofit purposes without prior permission or charge, provided:
• The authors, title and full bibliographic details is credited in any copy; • A hyperlink and/or URL is included for the original metadata page; and • The content is not changed in any way.
For more information, including our policy and submission procedure, please contact the Repository Team at: [email protected].
SOFTGAUGES
FOR
SURFACE
TEXTURE
By
Tukun Li
A thesis submitted to The University of Huddersfield in partial fulfilment of the requirements for
the degree of Doctor of Philosophy
School of Computing & Engineering The University of Huddersfield
1
Abstract
Surface texture plays an important role in the specification of a precision workpiece. However, the route of traceability for surface texture measurements is not well developed. One of the main technical obstacles is the lack of tools to check traceability of the software of surface measuring instruments and to estimate uncertainty contributed by the software. To this end, the concept of softgauges (i.e. software measurement standards) for surface texture has been introduced into the international standards.
The presented thesis documents the realisation of softgauges for surface texture, which is a part of the National Measurement System in the UK. These standards, in the form of the reference dataset with reference results, have been developed by both simulation and experimental methods. The analysis of software uncertainty has been undertaken. These measurement standards have been used to verify both reference software (developed by the National Measurement Institutes) and commercial packages (developed by instrument manufacturers). In addition, the evaluation of the measurement uncertainty in workshop level has been carried on.
2
Acknowledgements
The author would like to express his profound gratitude to his supervisor Professor Xiangqian (Jane) Jiang, for giving him the opportunity to join the research team in the Centre for Precision Technologies (CPT) and for her generosity in providing all technical supervision and financial support through years. Special thanks are devoted to Professor Liam Blunt for his everlasting support and continued encouragement. This work also co-supervised by Dr. Shaojun Xiao who as a colleague, friend and “sparring partner” have helped fine-tune many of the ideas expressed in this thesis. The author is eternally indebted to him for his guidance. Thanks are due to Professor Paul Scott whose useful comments and guidance for this work. Without them, this thesis would have been impossible.
The past and present members of CPT have also been a great help, and their friendship has enhanced the quality of the author’s working life and hence created the wonderful atmosphere conducive to research. The author would like to single out particularly Dr Leigh Fleming, who read and commented on the thesis and who has been a valuable source of encouragement. Dr Wenhan Zeng and Dr Feng Gao are also acknowledged for their help over years.
The author would also like to mention some other people he was fortunate to work within the recent years. Sincere thanks are devoted to Professor Richard Leach (NPL), Dr. L Jung (PTB), and Dr T V Vorburger (NIST) for the inter-comparison work in this thesis.
In addition, the author would like to thank the Department of Trade and Industry (DTI) for providing the funds for this work under its programme of National Measurement System Programme for Length Metrology.
3
Table
of
Contents
ABSTRACT...1
ACKNOWLEDGEMENTS...2
TABLEOFCONTENTS...3
LISTOFFIGURES...7
LISTOFTABLES...10
LISTOFRELATEDPUBLICATIONS...12
NOMENCLATURE...13
ACRONYMSANDABBREVIATIONS...14
1 INTRODUCTION...16
1.1 Background...16
1.2 Objectivesandapproaches...19
1.3 Thesislayout...20
2 FROMHARDGAUGESTOSOFTGAUGES...22
2.1 Introduction...22
2.2 Surfacedescription...25
4
2.2.2 Surface texture parameters ... 27
2.2.3 Standardisation ... 30
2.2.4 Definitional uncertainty & specification uncertainty ... 32
2.2.5 Information model ... 34
2.3 Hardgaugesandprimaryinstruments...36
2.3.1 Hardgauges ... 36
2.3.2 Primary instruments ... 41
2.4 Traceabilitychain...42
2.4.1 Measurement uncertainty ... 42
2.4.2 Calibration ... 48
2.4.3 Some issues of traceability of surface texture measurements ... 49
2.5 Softgauges...52
2.5.1 Concept of softgauges ... 52
2.5.2 Requirements ... 52
2.5.3 Related work ... 56
2.6 Summary...58
3 AFRAMEWORKFORSOFTGAUGES...60
3.1 Roleofsoftgaugesinthetraceabilitychain...60
3.2 SurfacetextureintheGPSlanguage...62
3.2.1 Geometrical features in three worlds ... 62
3.2.2 Operators and duality principle ... 64
3.2.3 Generalised uncertainty principle ... 67
3.3 Developmentofterminology...70
3.3.1 Metrological traceability of software ... 70
3.3.2 Software calibration, verification and validation... 71
3.3.3 Model and code ... 72
3.3.4 Software uncertainty/error ... 72
3.4 Theproposedframework...74
3.4.1 Objectives of software calibration ... 74
3.4.2 Methodology ... 74
3.4.3 Key components ... 76
3.4.4 Key tools ... 80
3.4.5 Others ... 83
3.5 Conclusions...84
4 ANINFORMATIONMODELOFSURFACEMETROLOGY...86
5
4.1.1 The information modelling process ... 86
4.1.2 XML and XML Schema ... 88
4.2 ThedevelopmentofSMTL...88
4.2.1 Scope of SMTL ... 88
4.2.2 Collecting the information requirements ... 89
4.2.3 Developing the information model ... 89
4.2.4 Validation of message ... 98
4.3 Acasestudy:EurometProject600...99
4.3.1 Defined measurand ... 99
4.3.2 Measured values ... 100
4.3.3 Discussions ... 101
4.4 Conclusions...102
5 UNCERTAINTYANALYSIS...103
5.1 Methodology...103
5.2 IdentifyingtheuncertaintyoftheISO4287parameters...106
5.2.1 NPL’s interpretation ... 106
5.2.2 Start point ... 107
5.2.3 Filtration ... 109
5.2.4 Basic elements ... 111
5.2.5 Sampling length and evaluation length ... 117
5.2.6 Segmentation of portions ... 119
5.2.7 Parameters ... 120
5.3 Estimatingtheeffectofsoftwareuncertainty...125
5.4 Conclusions...126
6 DEVELOPMENTOFTYPEF1SOFTGAUGES...127
6.1 ScopeoftypeF1softgauges...127
6.2 Referencedatasets...129
6.2.1 Mathematical defined reference dataset ... 132
6.2.2 Simulated manufacturing reference dataset ... 138
6.2.3 Measured profile for reference dataset ... 141
6.2.4 Advanced measured profiles for reference dataset ... 142
6.3 Referenceresults...143
6.4 Uncertainty...146
6
7 USEOFSOFTGAUGES...149
7.1 Calibrationprocedureforsurfacemetrologicalsoftware...149
7.1.1 Scope ... 150
7.1.2 Condition of use ... 151
7.1.3 Software measurement standards ... 151
7.1.4 Calibration ... 151
7.1.5 Uncertainty ... 153
7.1.6 Decision rule ... 153
7.2 VerificationofthetypeF2softgauges...155
7.2.1 Objectives ... 155
7.2.2 Preparation of calibration ... 156
7.2.3 Selected type F1 softgauges ... 156
7.2.4 Calibration ... 156
7.2.5 Performance metrics ... 163
7.2.6 Conclusions ... 165
7.3 Calibrationofcommercialsoftwarepackages...167
7.4 Estimatingthemeasurementuncertainty...171
7.4.1 ANOVA method ... 171
7.4.2 Computer simulation ... 177
7.5 Conclusions...179
8 CONCLUSIONSANDFUTUREWORK...181
8.1 Summaryofcontributions...181
8.2 Futurework...182
REFERENCE...183
APPENDIX 1EXAMPLESOFTHEMESSAGESINSTML...193
7
List
of
Figures
Figure 2.1 Logical relationship among the key concepts in metrology [source: NIST] ... 23
Figure 2.2 Part of the traceability chain of length measurements in the UK [source: NPL] ... 24
Figure 2.3 Schematic diagram of surface topography (ASME B46.1-2002) ... 26
Figure 2.4 Stages of surface texture assessments ... 28
Figure 2.5 A typical profile graph with some descriptors ... 29
Figure 2.6 An overview of knowledge transfer in the case of surface profile parameters ... 31
Figure 2.7 An example of the specifications of roughness in drawing (ISO1302:2002) ... 33
Figure 2.8 Evolution of drawing symbols (P Bennich and H Nielsen 2005) ... 33
Figure 2.9 Examples of type A1 hardgauges (ISO 5436-1 2000) ... 37
Figure 2.10 Examples of type A2 hardgauges (ISO 5436-1 2000) ... 37
Figure 2.11 Examples of type B hardgauges (ISO 5436-1 2000) ... 38
Figure 2.12 Examples of type C hardgauges (ISO 5436-1 2000) ... 39
Figure 2.13 A type D1 hardgauge and its measuring plan (ISO 5436-1 2000) ... 40
Figure 2.14 Examples of type E hardgauges (ISO 5436-1 2000) ... 40
Figure 2.15 Relationship between system errors and random errors [Adapted from (Ehrlich, Dybkaer et al. 2007)] ... 43
Figure 2.16 Sources of errors in surface texture measurements (Li, Blunt et al. 2009) ... 45
Figure 2.17 Error components that lead to measurement uncertainty ... 45
Figure 2.18 Diagram of calibration process ... 49
Figure 2.19 Position of hardgauges ... 50
Figure 2.20 Calibration points and range of Ra value (source: Rubert & Co Ltd and Taylor Hobson Ltd) ... 51
Figure 2.21 Manufacturing processes and materials used by respondents ... 54
Figure 2.22 Frequency and importance of R-parameters ... 55
Figure 3.1 Duality principle (ISO/TS 17450-2 2002) ... 65
Figure 3.2 Operators and operations of -2,5/Ra 1,5 ... 66
Figure 3.3 Relationship of various uncertainties in GPS (Wang, Ma et al. 2004) ... 68
8
Figure 3.5 An example of implementation uncertainty contributed by the use of a skid ... 69
Figure 3.6 Error and uncertainty in metrological software... 73
Figure 3.7 Routes toward absolute standards of surface texture measurements ... 75
Figure 3.8 Framework for the softgauges for surface texture in the UK ... 76
Figure 3.9 Procedure for the testing software using the reference software ... 78
Figure 3.10 Assessment of model uncertainty and code uncertainty ... 82
Figure 4.1 Diagram of schema for surface texture indications ... 90
Figure 4.2 Diagram of a surface texture parameter according to its drawing indication ... 92
Figure 4.3 Diagram of a measurand according to the drawing indication ... 93
Figure 4.4 Extension of the extraction operation of a specification operator ... 94
Figure 4.5 Diagram of a perfect verification operator ... 96
Figure 4.6 Diagram of the extraction operation of an actual verification operator ... 97
Figure 5.1 A flowchart for surface assessments according to ISO 3274 (1996) and 4287 (1997) ... 106
Figure 5.2 Basic framework for NPL’s interpretation of surface profile texture ... 107
Figure 5.3 Weighing function of the profile filter according to ISO 11562 (1996) ... 110
Figure 5.4 An example of the discretization errors ... 112
Figure 5.5 Ambiguity of definition of the incomplete portion ... 114
Figure 5.6 NPL’s implementation of the 2H method ... 115
Figure 5.7 Ambiguity of the discrimination for a profile element ... 115
Figure 5.8 Ambiguity of the definition of a profile element ... 116
Figure 5.9 Sample length l, evaluation length, measurement length and instrument traverse length. ... 119
Figure 5.10 Significant results produce by different segmentation methods (the black points represent the crossing points of a profile) ... 120
Figure 5.11 Rt is the total height of a profile over the evaluation length ... 123
Figure 5.12 A significant feature at the end of the sampling length... 123
Figure 5.13 Width of profile elements ... 124
Figure 6.1 Processing routes for manufacturing surfaces ... 128
Figure 6.2 Scope of the type F1 softgauges ... 129
Figure 6.3 The methods for producing the reference datasets ... 130
Figure 6.4 Example of synthetic sine & saw profiles ... 134
Figure 6.5 Example of advanced synthetic sine & saw wave profiles ... 136
Figure 6.6 Example of spike profiles ... 137
Figure 6.7 Examples of square wave and white noise profiles... 138
Figure 6.8 Comparison of measured and simulated ground surface profiles ... 140
Figure 6.9 Examples of the simulated profiles with specified Rsk and Rku ... 141
Figure 6.10 Example of the master workpiece measurements for reference datasets ... 142
Figure 6.11 Diagram of the use of algebraic calculation ... 145
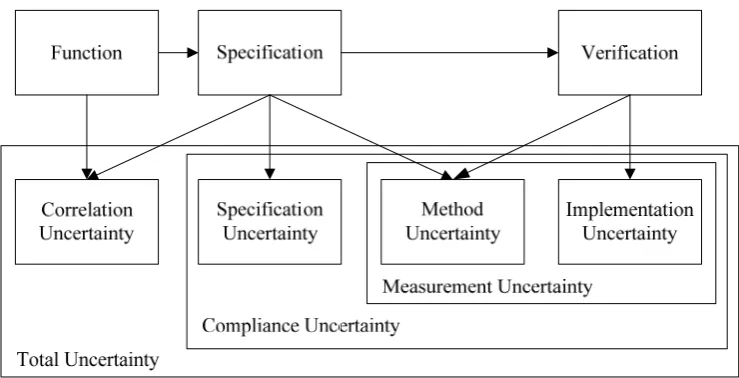
Figure 6.12 Dimensions of measurement uncertainty [Adapt from Rowe (1994)] ... 146
Figure 6.13 A method to calculate compliance uncertainty ... 147
Figure 7.1 Assessment of Gaussian filtering ... 157
Figure 7.2 The number of the correct significant digits ... 158
Figure 7.3 The effect of the direction ... 159
9
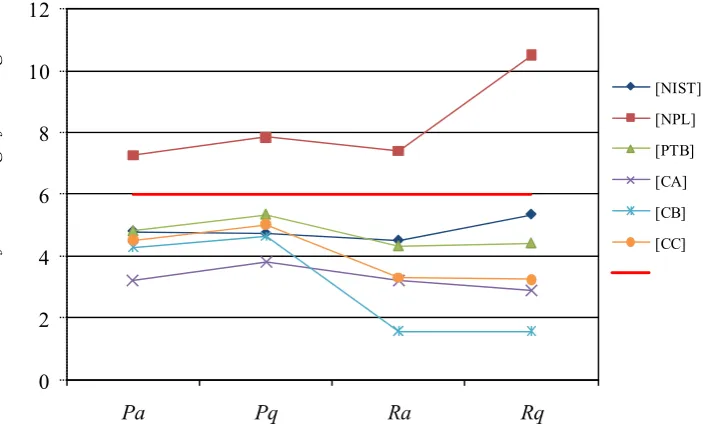
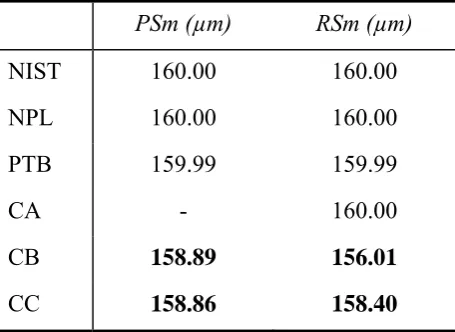
Figure 7.5 Results of parameter PSm ... 162
Figure 7.6 Results of parameter Rc ... 162
Figure 7.7 Results of parameter Pc ... 163
Figure 7.8 Calibration results of [CA] ... 167
Figure 7.9 The number of the correct significant digits ... 168
Figure 7.10 Calibration results of [CB(v1)] ... 169
Figure 7.11 Calibration results of [CB(v2)] ... 169
Figure 7.12 Calibration results of [CC] ... 170
Figure 7.13 Calibration results of [CD] ... 170
Figure 7.14 The NIST’s model for calculating the uncertainty of surface roughness (Bui et.al 2007) ... 177
10
List
of
Tables
Table 2.1 Position of surface profile standard documents in the GPS matrix model. ... 31
Table 2.2 Elements of the SMD file format (ISO 5436-2 2001) ... 35
Table 2.3 The GUM’s method (Howarth and Redgrave 2008) ... 44
Table 2.4 Lessons to learn from the design and use of hardgauges ... 59
Table 3.1 A comparison of the definitions of some key concepts in metrology ... 61
Table 3.2 Examples of geometrical features in three worlds ... 64
Table 4.1 Description and contents of tags for specifying manufacturing requirements ... 91
Table 5.1 The procedure to handle model uncertainty ... 104
Table 5.2 Type F2 softgauges and commercial packages ... 105
Table 5.3 Length algorithms ... 112
Table 5.4 Five segmentation methods ... 120
Table 5.5 Estimating the effect of the software uncertainty of parameter Ra ... 125
Table 5.6 Estimating the effect of the software uncertainty of parameter Rz32 ... 125
Table 5.7 Estimating the effect of the software uncertainty of parameter RSm32 ... 126
Table 6.1 Comparison of the methods for producing a reference dataset ... 131
Table 6.2 Scope of type F1 softgauges ... 132
Table 6.3 Profile “measuring” conditions ... 132
Table 6.4“Mathematical” surface profiles ... 134
Table 6.5 “Mathematical” profiles for testing spacing and hybrid parameters ... 135
Table 6.6 “Mathematical” spiked profiles for testing Gaussian filtering ... 137
Table 6.7 Square wave and white noise profiles ... 138
Table 6.8 Specifications used for simulated surfaces (EDM and honed) surfaces ... 141
Table 6.9 Parameters of the classes of uncertainty (Rowe 1994) ... 147
Table 7.1 List of selected type F1 Softgauges ... 156
Table 7.2 Influence of the incomplete portion for RSm and PSm ... 160
Table 7.3 Percentage of coefficients of variation among three type F2 standards ... 161
Table 7.4 Percentage of coefficients of variation among three type F2 standards and commercial packages... 161
11 Table 7.6 The performance of software implementations, assessed by the effect of the
reproducibility of measurement tasks listed in Table 7.5 ... 164
Table 7.7 Percentage coefficients of variation from place to place on a manufactured surface (Thomas and Charlton 1981) ... 165
Table 7.8 Percentage of relative difference between results obtained from the same software on the same profile with reversed order of data points. ... 168
Table 7.9 Ra values on type D1 measurement standard 1271 ... 172
Table 7.10 The random effects (ISO 12179 2000) ... 172
Table 7.11 Summary of ANOVA ... 173
Table 7.12 Results of parameter Ra (nm) used in assessment ... 175
12
List
of
Related
Publications
1. Li T, X Jiang, L Blunt, P Scott, and S Xiao (2007). “Comparison on F2 softgauges for surface texture”. In: The Proceedings of 1st European Conference on Tribology (ECOTRIB), Slovenia. pp. 765-774. ISBN 9789619025482
2. Li T, X Jiang, L Blunt, P Scott, and S Xiao (2008). “The Design and Use of F1 Softgauges for Validating Surface Metrology Software.” Key Engineering Materials, 381-382: pp 643-646.
3. Li T, R Leach, L Jung, X Jiang, L Blunt (2009). NPL Report ENG 16 -
Comparison of Type F2 Software Measurement Standards for Surface Texture, London. National Physical Laboratory, UK. ISSN: 1754-2987
4. Li T, L Blunt and X Jiang (2009). “Uncertainty in surface roughness
measurement”, In: Statistical Analysis of Measurement Data for the Evaluation of Measurement Uncertainty (SAMEMU), available at: http://www.sam-emu.ath.eu/ 5. Blunt L, T Li, “Evaluation of Measurement Uncertainty”, Quality Manufacturing
Today, March 2010.
13
Nomenclature
l Sampling Length
lp The sampling length for primary profile lr The sampling length for the roughness profile lw The sampling length for the waviness profile
Ra Arithmetical mean deviation of the roughness profile Rc Mean height of profile elements
Rku Kurtosis of the roughness profile Rp Maximum roughness profile peak height
Rq Root mean square deviation of the assessed profile Rsk Skewness of the assessed profile
RSm Mean width of the profile elements Rt Total height of the roughness profile Rv Maximum roughness profile valley depth Rz Maximum height of the roughness profile
Z(x) Height of the assessed profile at any position x
Smi Width of a profile element (i th)
λ Wavelength
λc Wavelength of profile filter which defines the intersection between the roughness and waviness components
λf Wavelength of profile filter which defines the intersection between the waviness and the even longer wave components
14
Acronyms
and
Abbreviations
ASME American Society Of Mechanical Engineers BIPM Bureau International des Poids et Mesures
GPS Geometrical Product Specifications and Verifications GUM Guide to the Expression of Uncertainty in Measurement ISO International Organization for Standardization
ISO/TC213 ISO Technical Committee 213 (Dimensional and geometrical product specifications and verification)
NIST National Institute of Standards and Technology, USA NMI National Measurement Institute
NPL National Physical Laboratory, UK PDF The Probability Density Function
PTB Physikalisch-Technische Bundesanstalt, Germany
SI International System of Units, (abbreviated SI from the French le Système international d'unités)
VIM2 International Vocabulary of Metrology, 2nd Version (1995) VIM3 International Vocabulary of Metrology, 3rd Version (2007)
In addition, three type F2 reference software packages and some commercial software packages were used in the uncertainty analysis and the comparison. In this thesis, the square brackets refer to the associated software packages.
[PTB] Ref_soft_PTBIDL and Ref_soft_PTBweb1
www.ptb.de/en/org/5/51/517/rptb_web/wizard/greeting.php
15 [NIST] Internet Based Surface Metrology Algorithm Testing System
syseng.nist.gov/VSC/jsp/index.jsp [NPL] nplsmd1.01
www.npl.co.uk/server.php?show=ConWebDoc.160 [CA] Commercial software package A
[CB] Commercial software package B
[CB(V1)] Commercial software package B (Version 1) [CB(V2)] Commercial software package B (Version 2) [CC] Commercial software package C
16
1
Introduction
1.1
Background
Metrology is the science of measurement, which includes all theoretical and practical aspects of measurement (Howarth and Redgrave 2008). There is no doubt that metrology plays an essential role in the economic and industrial development of a country. As the British Victorian engineer Sir Joseph Whitworth (1803~1887) said, “you can only make as well as you can measure”. Thus, it is often said that the level of industrial development of a country can be judged by the status of its metrology (Silva 2002).
The success of a measurement is generally quantified by the terms of precision and accuracy. Precision of a measurement can be described by its comparability between different periods, locations, measurement procedures, instruments and operators. According to the degree of the difference of these conditions, measurement precision is described as repeatability2 and reproducibility3. Accuracy of a measurement is the closeness of the agreement between its measured value and its true value (VIM3 2007). The accuracy is ensured by using a method called traceability. Traceability is “the property of a measurement result whereby the result can be related to a reference
2Repeatability is the measurement precision under repeatability condition, i.e. the same measurement
procedure, same operators, same measuring system used under same operating condition and same location, and repetition on the same or similar objects over a short period time (VIM3, 2007).
3 Reproducibility is the measurement precision under reproducibility condition, i.e. the different
17
through a documented unbroken chain of calibrations, each contributing to the measurement uncertainty (VIM3 2007)”. Traceability is often obtained by undertaking
calibration, an operation to establish the relation between the indication of a measurement instrument and the value of a measurement standard (etalon)4(BIPM 2011).
Traditionally, a measurement standard (etalon) is in the form of artefact and physical gauge, called “hardgauge” in this thesis, which is intended to define, realise, conserve or reproduce one or more values of an attribute to serve as a reference (VIM2 1995). The design, development and maintenance of measurement standards are the most fundamental works in metrology, generally undertaken by a National Metrology Institute (NMI) within a country, such as the National Physical Laboratory (NPL) in the UK, the National Institute of Standards and Technology (NIST) in the United States, Physikalisch-Technische Bundesanstalt (PTB) in Germany and so on.
It is recognised that software plays an increasingly important role in metrology. Richter (2006), for example, stated that “a new world of metrology has been opened up by software”. In this world, metrologists face both opportunities and challenges. On the one hand, software empowers measurement instruments significantly by introducing complex metrological properties. On the other hand, accuracy and precision of the software of instruments are a great issue. The cost due to software fault is significant. In 2002, NIST estimated that the American annual cost of an inadequate infrastructure for software testing is $59.5 billion (Tassey 2002). In the field of metrology, therefore, the idea of a software-based virtual gauging system has been emerged (Smith 2002).
Surface texture is the topography of a surface composed of certain deviations that are typical of the real surface (ASME B46.1 2002)5. Surface texture measurements play an increasingly important role in controlling the quality of precision parts. Modern engineers in the field of automotive, aerospace and medical engineering are the examples that have been empowered with the knowledge of surface texture. Surface metrology, i.e. the science of surface measurement, has been developed rapidly in the
4 In science and technology, the English word “standard” is used with at least two different meanings: as a specification, technical recommendation, or similar normative document (in French “norme”) and as a measurement standard (in French “étalon”). In this thesis, “standard” refers to the second meaning. The term of “standard document” refers to the first meaning.
18
last several decades (Lonardo, Trumpold et al. 1996; Lonardo, Lucca et al. 2002). Various types of instruments, new characterisation methods have been put into practice. This prosperity enriches the selection of appropriate metrological solutions. However, the more solutions we have, the more references we need. Since very few references are available, the accuracy of these solutions is a critical issue.
Repeatability of surface measurements has been enhanced. However, surface texture measurements only have an ill-defined traceability route (Leach 2004). In other words, the surface textures measurements are increasingly improved on their precision, but lack enough evidence on their accuracy. It indicates that there are needs to develop new type of measurement standards to ensure the accuracy of surface texture measurements. The rationales for this decision can be summarised as:
1) Hardgauges, existed in the physical world, are costly to manufacture, maintain and difficult to implement. They regularly are stored in specialised laboratories and assessed in difficult and necessarily limited. Although many types of hardgauges have been standardised, only few types, therefore, are often used.
2) There are 63 surface profile texture parameters defined in the ISO (The International Organization for Standardisation) documents. However, only few of them can be checked their traceability by using hardgauges6.
3) Software engineers need tools to check metrological traceability of the software developed for surface measuring instruments. This requirement is unable addressed soundly by using hardgauges. Hardgauges check the software and the hardware of an instrument as a whole and not just the software in isolation. For software developers, thus, using hardgauges is not convenience and reliable (e.g. the certified values of hardgauges accompany with relatively large measurement uncertainties).
4) Related metrological information, such as measurement conditions and the definition of surface texture parameters, currently spreads in various
19
graphic/text-based documents. So it could lead different callouts (Scott 1988; Song and Vorburger 1991; Leach and Harris 2002), and results in significant uncertainty due to the lack of information (ISO TC213 2004). Hardgauges do not manage this uncertainty soundly (Rubert 1995).
The concept of software measurement standards (i.e. softgauges) for surface texture measurements was introduced into ISO documents (ISO 5436-2 2001). This thesis documents the design and the development of the realisation of this concept in the UK. The developed softgauges, as part of National Measurement System in the UK, are distributed by NPL over the Internet. They have also been recognised by the NMIs around the world, such as NIST in the United States and PTB in Germany.
1.2
Objectives
and
approaches
The aim of this work is to maintain metrological traceability of the software of surface measuring instruments, which is the basis upon which all output results of the software can be claimed to be accurate. The objectives of this project are classified as follows:
1) Understanding of softgauges: It will develop a deep understanding of softgauges, conformed to the latest ISO documents and based on recently evolved philosophy in metrology.
2) Methodology for software calibration: It will develop a methodology to calibrate the software by extending the metrology approaches into information science domain.
3) Software uncertainty: An expression of the measured results is incomplete, unless it includes a statement of the associated uncertainty. Generalised uncertainty principle proposed in the GPS (i.e. Geometrical Product Specifications and Verifications, a metrological language) will be adapted to evaluate the software uncertainty.
20
computing errors by designing and developing the simulated profiles with the reference results produced with algebraic calculations.
5) Measurement information: In order to reduce the uncertainty in communication level, an information model will be developed to organise the measurement information, which needs to be exchanged between different parties.
6) A set of softgauges: The softgauges in the form of the reference data and the reference results, as the transfer standards at a national level, will be designed, developed and distributed.
7) Software calibration procedure, decision rule and user guide: It will develop a calibration procedure, together with a comparison rule from the software aspect. Case studies will be undertaken to guide the use of the softgauges.
This main concern of this work is to check metrological traceability of the software of surface measuring instruments. Hence we concentrate on the related software quality characteristics such as accuracy, reliability, repeatability, reproducibility and so on. This project does not cover other characteristics, such as usability, efficiency, maintainability and portability 7 . Furthermore, this thesis only documents the development of softgauges for surface profile parameters defined within ISO 4287 (1996), which is the fundamental part of this ongoing project.
1.3
Thesis
layout
This thesis is organised as follows. Chapter 2 presents a review of the current state of traceability in the field of surface metrology together with a detailed analysis of the requirements of softgauges. Chapter 3 presents the development of the framework for softgauges. Chapter 4 develops an information model to standardise the measurement information. Chapter 5 is concerned with identification of the software uncertainty of the ISO 4287 parameters. Chapter 6 is devoted to the development of the softgauges. The subjects of Chapter 7 include a proposed software calibration procedure, a decision rule, the verification of reference software, the calibration of commercial packages and two case studies on measurement uncertainty. Chapter 8 is a summary of
21
22
2
From
hardgauges
to
softgauges
This chapter reviews the current state and the trends in the field of surface metrology. The objectives of this literature review are to develop a better understanding of the issues surrounding traceability of surface texture measurements, to identify the potential research work and to clarify the scope of the work to be undertaken.
2.1
Introduction
The most fundamental reference in metrology is the “International Vocabulary of Metrology – basic and general concepts and associated terms”(VIM3 2007). The latest version (3rd) was released in December, 2007 and refers to as the VIM3. The previous version (2nd) refers to as the VIM2 (1995). The VIM3 represents the latest evolution of philosophy and description of measurement (Ehrlich, Dybkaer et al. 2007). Note that many references (published before the release of the VIM3) in this chapter follow the VIM2.
23 Figure 2.1 Logical relationship among the key concepts in metrology [source: NIST]
24
Figure 2.2 Part of the traceability chain of length measurements in the UK [source: NPL]
25
2.2
Surface
description
2.2.1
Definition
of
surface
texture
The real surfaces of a workpiece are a set of features which physically exist and separate the entire workpiece from the surrounding medium (ISO 14660-1 1999). The texture on a surface is one of its key features. As illustrated in Figure 2.1, the definition of the object is the start point in a standardised measurement. So the first question, inevitably, for surface texture measurements is: What is surface texture?
All surfaces have some type of texture, and many of them are easily recognised. However, it is not easy to define the texture. Often the description of surface texture relies on the development of measurement methods, characterisation techniques and manufacturing processes. With the evaluation on these related technologies, the definition of surface texture, inevitability, is evolved. Many are orientated to define surface texture by the wavelength approach which shows a good link to the creation process of a surface. This idea dates back to the beginning of quantitative surface texture measurements in the early twentieth century. Reason, in “Report on the measurement of surface finish by stylus methods” which published in 1944, stated that:
“1) General curvature of the whole surface, or irregularity of comparatively long wavelength, due perhaps to flexure of the work in the machine, or to lack of straightness in the ways. 2) Surface texture of medium wavelength due to bad condition or bad setting up of the machine … 3) Surface texture of comparatively short wavelength due to the cutting action proper of the machining process …, for instrumental convenience the texture may be roughly sub-divided into two classes: a) texture reasonably within the scope of a stylus of 0.0001inch radius, b) texture too fine for such a stylus.” (Reason, 1944)
26
document (ASME B46.1 2002). In a standard document namely the German DIN 4760 (1982), this method was extended, which separates the roughness into four sub-classes.
Figure 2.3 Schematic diagram of surface topography (ASME B46.1‐2002)
A great problem with the conventional definition is how to define the points to separate these components. Often these points are given arbitrarily. For example, a given wavelength used to define the roughness on an automobile axle would fall into the wavelengths used to defined waviness or form error on a watch spindle (Blunt and Jiang 2001). To address this issue, a VDI8 guideline (VDI/VDE-2601 1991) used the ratio of the distance between irregularities to their depth to distinguish the form deviation, waviness, roughness and crack. However, the selection of the ratios is arbitrary too.
In areal surface texture characterisation, the boundaries of different components are more ambiguous, so the terms of roughness and waviness were abolished (ISO/DIS 25178-2 2009). The current bandwidth-based definition decomposes the surface topography into many sine waves with different bandwidth. In the last two decades, many new decomposition approaches (e.g. morphologic filters, wavelet filters etc.) has been put into practice. Thus “wavelength” is replaced by a term called “nesting index value” in ISO/DIS 25178-3 (2009).
27
Scott (1986) summarised that there are two philosophical approaches in surface metrology, namely: 1) defined in terms of the manufacture process (it monitors changes in the surface texture and indicates the changes in the manufacturing process such as machine tool vibration or tool wear); 2) defined in terms of function requirements (it describes the features of surface that are directly related the functional requirements of a surface). The conventional definition of surface texture is based on the first approach. With the emergence of new methods based on the second approach, the definition of surface texture becomes a problem.
Thus current ISO documents do not provide the definition of surface texture, in spite of the fact that this term was widely used. Recently, Scott (2010) suggested that “surface texture is the scale limited feature of a surface”. This definition will be introduced into an ISO document, namely ISO 25178-2. The acceptance of this definition is subject to the vote results in the near future.
2.2.2
Surface
texture
parameters
Engineers face another issue when the surface texture is obtained - how to represent it. This issue arose one century ago, but there has not been satisfactory answered for all purposes until now. It could be represented by the chart directly, but too much data makes difficulty for its communication and comparison. It could be represented by a parameter as a single number. This method goes to another extreme – too little data, which means the number may not probably describe the requirements. Nevertheless, surface texture parameters are still the favourite for surface engineers (Jiang, Scott et al. 2007).
Surface texture does not have any “natural” parameter (for example, the diameter of a cylinder). Therefore, it has always been customary to define each surface parameter in terms of the instrument used to measure it, the algorithms and the setting up of this instrument (Nielsen 2006). Diversity of these components causes another problem – diversity and complexity of surface texture parameters.
28
and uncertainty. In this section, we separate surface texture assessments into four main stages: surface texture classification, data acquisition, pre-processing and characterisation. Figure 2.4 illustrates the operations within these stages (ISO standardised operations are listed in bold).
Figure 2.4 Stages of surface texture assessments
Surfaceclassification
There are various types of surfaces, identified by different classification approaches. According to the surface creation processing, Stout and Blunt (2001) classified them into random surfaces, systematic surfaces, unstructured surfaces, structured surfaces and engineered surfaces. Jiang et al (2007) categorised them into three groups, stochastic surfaces, structured surfaces and freeforms by the description approaches. According to the type and the functional requirements of a surface, a possible metrological solution is established, which includes a sampling method, a suitable instrument, analysis methods and parameters.
Dataacquisition
29
Pre‐processing
In the stage of pre-processing, a set of mathematical treatments is carried out to refine the useful information out of the raw measured datasets. Pre-processing includes levelling of surface data, form removal, data manipulation (truncation, rotation, inversion, sub-area extraction, etc.) and filtering. Levelling and form removal is often performed by the least squares line/plane or surface fitting with various mathematical methods (Muralikrishnan and Raja 2008).
Filtration concerns the separation of different features by given scales. It extracts key information to provide process feedback and establish the functional correlations. Meanwhile, it is important to limit the unwanted distortions caused by using a filter. Various types of filters have been developed, such as the 2RC, Gaussian, spline, morphological, wavelet, regression filter, etc. Each type of filters has its advantages and limitations (Raja, Muralikrishnan et al. 2002).
Characterisation
A typical profile graph is shown in Figure 2.5. It is difficult to describe all features by one parameter. Many parameters, thus, have been developed. The peak parameters, such as Rp, Rv and Rz shown in Figure 2.5, are the earliest parameters as they can be measured by hand directly from a recording of the profile (Reason 1944). Abbott & Firestone (1933) recommended the use of the material ration curve to represent the surface. Average parameters, such as Ra and Rq, were introduced when electronic processing became available (Reason 1944). Since the computer being used in surface metrology, an amount of parameters based on different characterisation techniques (e.g. statistical description, spectral analysis, time series analysis, functional characterisation etc.) has been realised. Jiang and Blunt (2001) estimated that more than 100 surface profile parameters had been proposed.
30
Most of the characterisation techniques are scale-dependent, which means the results depend on the measurement scale. On the other hand, some topography characteristics are independent of the measurement scale, i.e. using of a fractal dimension (ISO/DIS 25178-2 2009).
The variety of the characterisation methods has brought about a significant explosion in the generation of parameters, aptly defined as the “parameter rash” by Whitehouse (1982). The rash results confusion and expense, thus, it needs ways to minimizing it (Whitehouse 1982). It will be discussed in the next section.
2.2.3
Standardisation
The complexity and variety of surface metrology gives engineers plenty of choice. At the same time, it causes a difficulty in communication between different parties. Thus many national standard documents have been issued (Whitehouse 2002a). The need for global standards has increased dramatically in the trend of globalisation. ISO plays an important role in the development of the common standards around the world. Standard documents for surface texture are developed by ISO TC/213 in the framework of the GPS (Geometrical product specifications and verification). It consists of profile characterisation and areal characterisation.
Surfaceprofilecharacterisation
31 Table 2.1 Position of surface profile standard documents in the GPS matrix model.
Chain link
number 1 2 3 4 5 6
Geometrical characteristic of feature
Codification on a drawing
Definition of tolerance Definition for actual feature Comparison with tolerance limits Measurement equipment requirements Calibration requirements
14 Roughness profile
ISO1302 ISO 4287, 12085, 13565-1, 13565-2, 13565-3 ISO 4288, 12085, 11562, 13565-1 ISO 4288, 12085
ISO 3274 ISO 5436, 12179
15 Waviness profile
ISO1302 ISO 4287, 11562,
12085
ISO 11562, 12085
ISO 12085 ISO 3274 ISO 5436, 12179
16 Primary profile
ISO1302 ISO 4287, 11562,
13565-3
ISO 4288 ISO 4288 ISO 3274 ISO 5436, 12179
Note that only limited academic outputs have been standardised in ISO documents; moreover, limited ISO parameters have been used in industry practices. Figure 2.6 shows an overview of the knowledge transfers in the case of surface profile parameters.
Figure 2.6 An overview of knowledge transfer in the case of surface profile parameters
32
1) Some parameters are not meaningful (or functionally significant). Some parameters are easy to define, but they are not very useful in industry practice (e.g. W-parameters (Whitehouse 2002b)).
2) Some parameters are not mathematically stable. Some parameters are meaningful, but their definitions are unstable (e.g. the RSm parameter (Leach and Harris 2002)).
3) Many parameters show poor repeatability/reproducibility in practise. It is mainly due to the inconsistencies on the surface (Thomas and Charlton 1981). Disagreements could also arise from the variation of the understanding and implementations of ISO standard documents (Scott 1988).
Arealsurfacetextureparametersandfiltertoolbox
Many ISO documents for surface metrology are about to be published. Some of the most important are listed as follows.
The areal parameters of surface texture within ISO 25178 series: It includes three standard documents that define more than 40 areal parameters with their default callout.
The filter toolbox within ISO 16610series: It contains more than 40 documents that attempt to standardise most of the available filters with the user guides.
The areal parameters and filters toolbox are expected to be more meaningful, more mathematical stable, and able to reduce the variation contributed by the surface inconsistent. They are more complex and flexible. Thus, it should pay more attention to the possible disagreements caused by the different understanding and implementations of them. In metrology, this issue can be addressed by using measurement standards. It will be discussed in the following parts of this thesis.
2.2.4
Definitional
uncertainty
&
specification
uncertainty
33 Figure 2.7 An example of the specifications of roughness in drawing (ISO1302:2002)
In the GPS, specification uncertainty is used to quantify completion and perfection of the requirements given in technical drawings (ISO/TS 17450-2 2002). The evolution of the drawing symbols of surface texture reduces their specification uncertainty significantly (see Figure 2.8). However, current standard documents still contain some degree of the specification uncertainty. For example, Leach and Harris (2002) investigated the ambiguities in the definition of RSm parameter. It shows that an unspecified combination method for parameter RSm led to up to 12 % variation of results in given examples.
Key: a) In 1965 version , up to 300% specification uncertainty; b) In 1991 version, up to 30% specification uncertainty; c) In ISO 1302: 2002 version, low specification uncertainty.
Figure 2.8 Evolution of drawing symbols (P Bennich and H Nielsen 2005)
34
on definitional uncertainty (Mari 2009) and the relationship between specification uncertainty and definitional uncertainty is unclear (Nielsen 2009).
2.2.5
Information
model
There are two types of information for a surface texture measurement:
1) The measured dataset: It records the dimensional information which is a digital representation of a measurand in certain condition produced at a certain phase of a measurement.
2) The characteristic and the measurement conditions: As discussed above, a measurand is defined on an amount of information. The specified characteristic and measurement conditions state the key information of a measurand.
To measure is to compare. In order to compare the measurements undertaken at a different time or location, it is of importance to store and exchange such information. There are various file formats used to store the measured dataset in a computer. However, the information of the characteristics and the measurement conditions is spread in many graphic/text-based documents, such as user-input, ISO documents, instrument guides, national measurement guides, etc. So an engineer faces another problem: how to organise/manage such information? The more the detailed information is, the less the definitional uncertainty. At the same time, too much information could make it difficult to exchange of information. In the pre-information age9, all our information was held on paper. Today most of it is held electronically either as digital documents, or as data in databases. The use of computers makes storing and exchanging more detailed information possible, thereby reduces the related uncertainty. This is especially important for surface measurement due to the complexity and variety of surface metrology as discussed above.
In the specification of surface texture, the most often used model is through the technical drawings. This graphic-based method efficiently integrates various geometrical requirements in one technical document. With the developing in Compute-Aid Design (CAD), the traditional paper-based drawings are normally undertaken with
35
aid of computer and store in digital form. Models have developed to use text-based language to represent the graphic-based symbols. For example, most of the CAD/CAM systems support ISO 10303 -- STandard for the Exchange of Product model data (STEP) to represent and exchange product manufacturing information. Danner et al. (2003) proposed a STEP-Based information model for dimensional inspection was proposed. These models aim to integrate all produce information within its life-cycle. Thus they only provide limit information of the specification of surface texture.
In the verification of surface texture, there are various data file formats available10. However, most of them focus on the storage of measured data with little information about the measurement condition11. Muralikrishnan and Raja (2002) proposed a common format for exchanging surface texture data across different platform, which is a XML-based container for the information of part, measurement, data file, analysis, process and function. Another file format with lot of detailed measurement information is the SMD file format. SMD is defined as the protocol for software calibration in ISO 5436-2 (2001). The elements of SMD are listed in Table 2.2.
Table 2.2 Elements of the SMD file format (ISO 5436‐2 2001)
Section Element
Record 1 – Header The revision number; File Identifier; Feature Type; Feature Number; Feature Name; Axis Name; Axis Type; Number of Points; Units; Scale factor; Axis Data Type; Incremental Value; Record 2 – Other
information (optional)
Date; time; created by; Instrument Id; Instrument Serial; Last Adjustment; Probing System (It includes Probing System Id; Tip radius value; Units; Tip Angle); Comment; Offset; Speed; Profile Filter (It includes filter type; Ls cutoff value; Lc cuttoff; Lf cutoff value; Motif A, Motif B); Parameter value (It includes Parameter Name; Parameter Value; Units; Uncertainty)
Record 3 – Data Data value; Record 4 – Checksum Checksum value.
There is a logical relationship between specification and verification, and models discussed above mainly focus on one part. The shape and size of such information are
10 For example, a commercial software package has listed more than 40 supported file formats. (Retrieved 30th January 2011, form http://www.truegage.com/tmformats.php#ts_upgrades)
36
changed from the designers to the metrologists. It could contribute the uncertainty in communication level. Thus, it is of importance to develop an information model to standardise the message from the specification to verification and vice versa.
There is an ongoing project for developing the protocol of the softgauges for areal surface texture measurements, which includes a proposed data file format and an open resource application to read and write this file format. The data structure follows the structure using in ISO 5436-2.
In addition, an information model needs to limit the amount of detailed information. Measurement standards, discussed in the next section, are useful tools to this end.
2.3
Hardgauges
and
primary
instruments
At the national level of a national measurement system, the current realisations of the definitions of surface texture are measurement standards, i.e. hardgauges, and a primary instrument.
2.3.1
Hardgauges
The design and the development of hardgauges to calibrate the surface measuring instruments begun in 1940’s, when Tomlinson (1946) at NPL developed one of the earliest hardgauges in the form of acid-etched lines. Thanks to the contributions made by Underwood (1953), Schobinger (1959), Reason (1951), Sharman (1967), Hasing (1965) and Song (1988), many hardgauges have been developed with different shapes on various materials. Most of them are standardised in ISO 5436-1 (2000). This document advocated using these hardgauges to determine the operating characteristics of contact stylus instruments, and lists five different types of hardgauges.
TypeAhardgauges
37 Figure 2.9 Examples of type A1 hardgauges (ISO 5436‐1 2000)
38
TypeBhardgauges
They are used to calibrate the geometry of the stylus tip. They also come with three sub-groups: Type B1 – narrow grooves with rounded bottoms proportioned to be sensitive to the dimensions of the stylus; Type B2 – two grids of equal Ra, one sensitive to the tip dimension the other insensitive; Type B3 – a fine protruding edge to assess the stylus condition. Some of example shows in Figure 2.11.
Figure 2.11 Examples of type B hardgauges (ISO 5436‐1 2000)
TypeChardgauges
39 Figure 2.12 Examples of type C hardgauges (ISO 5436‐1 2000)
TypeDhardgauges
40 Figure 2.13 A type D1 hardgauge and its measuring plan (ISO 5436‐1 2000)
TypeEhardgauges
These are used for calibrating the profile coordinate of instruments. They come with two sub-groups, type E1 – precision sphere or hemisphere (see Figure 2.14-A), type E2 – precision prism (see Figure 2.14-B).
(A) The type E1 hardgauges
(B) The type E2 hardgauges
Figure 2.14 Examples of type E hardgauges (ISO 5436‐1 2000)
41
effect of other components. However, it is still a problem of traceability of the results obtained from the engineered surfaces in the industry practices, due to their geometrical features are unlike the features on these hardgauges. Some suggested using the real engineering surfaces to check the performance of an instrument with the certified values obtained from a primary instrument. The great problem of this method is the inhomogeneity of the surfaces itself. Hasing (1965) and Song (1988) have developed random profile hardgauges (i.e. type D hardgauges) to overcome this drawback.
Hardgauges can be calibrated easily, accurately and unambiguously. They provide the absolute interpretations of the definitions of the surface parameters without going into too much detail (Rubert 1995). Using of hardgauges can identify (and manage) the disagreements between different parties. For example, Song and Vorburger (1991) proposed a measuring procedure based on the calibration procedure of hardgauges at NIST.
There are many typical problems of the calibrations undertaken by using hardgauges. Rubert (1995) listed some of them: 1) less accurate and more uncertain; 2) the disagreement due to non-standardised measurement conditions; 3) wear and damage on the hardgauges after a period of use. More issues will be discussed in Section 2.4.
2.3.2
Primary
instruments
A NMI often maintains a primary instrument to provide the certified values of the hardgauges within a country. This well-calibrated instrument establishes the traceability chain toward SI units. Most of NMIs use a commercial instrument; some use their own developed instruments. For example, NPL developed a surface measuring instrument, called NanoSruf IV, with ± 1 nm measurement uncertainty (at 95 % confidence) for both vertical and horizontal measurements (Leach 2001).
Self-evidence is provided on the accuracy and reliability of the primary instruments. To avoid a significant disagreement between different countries, NMIs carry out the comparisons among their instruments by using hardgauges. The inter-comparisons are not undertaken very often due to the cost both in time and labour12. Two recent
42
comparisons among NMIs in European have undertaken in 1989 (Hillmann) and in 2004 (Koenders, Andreasen et al.). Significant disagreements have reported, and the later one highlighted the needs to improve both the instruments and the software, have a better understanding of uncertainty and have more precise definitions in standard documents.
2.4
Traceability
chain
2.4.1
Measurement
uncertainty
2.4.1.1Generalconceptoferroranduncertainty
The hierarchy of measurement standards forms a pyramid. It is obvious that the higher in the pyramid, the more accurate (or less inexactness, in other words) must be of the standard. The measurement error, the difference between the measured value and “true value”, was historically used to describe the inexactness. Errors are subdivided into random and systematic. As illustrated in Figure 2.15-a, Systematic errors are often defined by the difference between the true value and the mean of the measured values.
Random errors13, caused by non-controlled random influence quantities, may be
characterized by the standard deviation and the type of distribution.
Due to it is impossible to know an exactly true value, the reference value, or certified value provided by the measurement standard, is used to assess the knowable errors (see Figure 2.15-b). Thus, a reliable reference value should be as close as possible to the true value by reducing the effect of unknown errors.
As the “exact value” of an error is unknowable, measurement uncertainty is introduced to quantify the inexactness by estimating the distribution of measurement errors in the form of an interval with a specified level of confidence. The most commonly used procedure for calculating measurement uncertainty is described in the Guide to the Expression of Uncertainty in Measurement (GUM 1995). The GUM’s method is undertaken with several steps as listed in Table 2.3 and illustrated in Figure 2.15-c.
43 y
y
y
44 Table 2.3 The GUM’s method (Howarth and Redgrave 2008)
Step Procedures
1 Identify all important components of measurement uncertainty: Many sources can contribute to the measurement uncertainty. Apply a model of the actual measurement process to identify those sources. Use measurement quantities in a mathematical model.
2 Calculate the standard uncertainty of each component of measurement uncertainty: Expressing each component of measurement uncertainty in terms of the standard uncertainty determined from either a type A or type B evaluation. Type A components
are estimated by statistical processing of repeated measurements. Type B components
are estimated by other methods. The most commonly used method it to assume a probability distribution based on experience or other information.
3 Calculate the combined uncertainty: In practice, for a sum or a difference of
components, the combined uncertainty is calculated as the square root of a sum of the squared standard uncertainty of the components.
4 Calculate the expanded uncertainty: Multiply the combined uncertainty with the coverage factor k.
5 State the measurement result on the form:Y = y ± U
Note that the term of “uncertainty” has two rather different meanings in a technical sense. The first meaning has its roots in probability and statistics, which is widely used in metrology and normally evaluate by the GUM’s method. The second meaning relates to the “lack of knowledge” (i.e. the absence of information in communication and cognise level), which is discussed in the GUM (1995) and is highlighted in the VIM3 (2007). The VIM3 (2007) revised the definition of measurement uncertainty to cover two meanings. However, there is no a guide provided to estimate of definitional uncertainty (the second meaning). Moreover, VIM3 does not define the concept of the measurand definition, the object which definitional uncertainty attempts to quality, which is still an open topic in the field of metrology (Phillips, Estler et al. 2001; Mari 2006; Pavese 2007; Baratto 2008; Mari 2009).
2.4.1.2Erroranduncertaintyinsurfacetexturemeasurements
45
environment, the operator, the chosen measurement methodologies, etc. A typical example of sources of errors shows in Figure 2.16.
Figure 2.16 Sources of errors in surface texture measurements (Li, Blunt et al. 2009)
To make it clearly, uncertainty contributors are grouped in five categories: hardware, measurand, measurement strategy, software and interpretation of the results by the approach proposed by Wilhelm et al (2001). This categorization gives a straightforward view of the relationship of different components of uncertainty as shown in Figure 2.17.
Figure 2.17 Error components that lead to measurement uncertainty
Instrumenthardware
46
The use of various measurement methods (e.g. stylus, optical, AFM, etc.) could produce different results on one surface. Many comparisons have undertaken (Church, Vorburger et al. 1985; Whitehouse 1988; Poon and Bhushan 1995). In a recent comparison, Vorburger et al (2007) reported that the discrepancy is up to 75% between optical method and stylus method in some cases. For a stylus instrument, the effects of stylus tip radius, tip worn and stylus flight can be significant (McCool 1984; Song and Vorburger 1996; Pawlus and Smieszek 2005).
Measurand
This uncertainty relates to properties of the measurand and measurement interaction with the workpiece. It is well known that significant variations can occur when small samples are taken from a large population of data. Generally, the measurand is defined within a sampling length to represent the whole surface. Thus, the inconsistent on the surface itself is the biggest contributor of the uncertainty. Thomas and Charlton (1981) investigated the variation of surface parameters on some typical surfaces. It found that the variations are up to 15% on the hardgauges and up to 50% on the typical machined surfaces. Stout and Davis (1986) investigated the variation of the Ra parameter when increasing the measuring times. These research works were based on the previous definition of surface parameters. Further study needs be undertaken on the variation of the latest ISO parameters on the typical surfaces.
Measurementstrategy
It includes the errors due to the inadequate in sampling, selection of sampling length, evolution length, etc. The default setting up of a stylus instrument is provided in ISO 3274 (1996) and ISO 4288 (1996). This project only takes these standardised measurement conditions into consideration.
Softwarealgorithm
47
z axis calibration, x axis calibration, λc cut-off length, λs cut-off length, probe diameter, probe tip angle, probing force, straightness of reference and sampling density. Similar uncertainty models have widely used by NMIs (Koenders, Andreasen et al. 2004). With the drastically increased power of the calculation of computers, the Monte Carlo Simulation (MSC) has been implemented to calculate the uncertainty. Brennan et al (2005) investigated a robust method of PU in the discretely sampling surface profiles. Bui and Vorburger (2007) in the NIST used MSC to calculate the uncertainty by adding random noise to each data point. NIST method assumes the noise has a normal distribution with mean of zero and standard deviation in both x-direction and z-direction, and each point is independent from other points.
The “quality” of software in this context only refers to the accuracy and reliability of the software algorithms. It is a systematic error between the commercial software and the national reference. It reflects the metrological comparability of difference software packages.
Resultsanduncertainty
The measurement results with associated uncertainty are presented in the form of Y = y ± U with the coverage factor k. It should pay attention on the possible uncertainty arisen from the presentation of results.
Someissuesofuncertaintyinsurfacetexturemeasurements
The GUM’s method is summarised in Section 2.4.1.1. However, it is very difficult to implement the GUM’s method to evaluate the uncertainty in surface measurements. The reasons are listed as follows.
1) The GUM’s method is under the assumption that a measurand can be characterised by an essentially unique value. The definitional uncertainty is considered to be negligible with respect to other components of measurement uncertainty. As discussed in the previous section, the definitional uncertainty of surface texture measurements could be significant.
48
treatments on thousands measuring points. Uncertainty models as discussed above assumed that the separated effects are uncorrelated, but they are significant correlated indeed. For example, Krystek (2001) investigated the uncertainty contributed by using the Gaussian profile filters, and highlighted the correlated property of the filtered data.
Thus, Leach (2009) states that “there is not straightforward to calculate a rigorous uncertainty value for an instrument for all surfaces and for all parameters, and only a pragmatic approach can be applied for a given measurement scenario”.
2.4.2
Calibration
The traceability chain is established through the calibrations. Note that the term of “calibration” in many publications is confused with “adjustment of a measuring system”. Their definitions in metrology are listed as follows.
Adjustment is “set of operations carried out on a measuring system so that it
provides prescribed indications corresponding to given values of a quantity to be measured. (VIM3 2007)” The adjustment process, therefore, comprises the modification of internal parameters, which characters the relation between the variations given by the probe and its real displacement.
Calibration is “operation that, under a specified conditions, in a first step,
establishes a relation between the quantity values with measurement uncertainties provided by measurement standards and corresponding indications with associated measurement uncertainty and, in a second step, used this information to establish a relation for obtaining a measurement result from an indication (VIM3 2007).”
49
with associated uncertainty. As illustrated in Figure 2.18, the calibration process includes two steps.
This instrument measures three hardgauges; the corresponding readings are recorded; and the measurement uncertainties are evaluated;
[image:51.595.107.492.304.490.2] A calibration curve is constructed by using these reading and a suitable interpolation algorithm, e.g. Least-Squared fitting of a straight line. A calibration strip is created in a similar way by using uncertainty interval (see Figure 2.18-a). This function is then inverted, so that each reading of this instrument can be associated with a measurand value (see Figure 2.18-b).
Figure 2.18 Diagram of calibration process
2.4.3
Some
issues
of
traceability
of
surface
texture
measurements
50
empirical world), and traceability of the implementations of the algorithms (in the information world). Figure 2.19 illustrates the position of the hardgauges in two worlds.
Figure 2.19 Position of hardgauges
There are two routes to demonstrate traceability of measurement results in the form of
the surface parameters, that of route 1 though sxy, and that of route 2 through sy
directly. Type A, B, C and E hardgauges are used to check traceability of instruments in aspects of the tip condition, vertical and horizontal components, etc. It maintains a
route of traceability of each measuring point obtained a surface (i.e. sx) toward SI unit. Obviously, this route is incomplete without the check traceability of data processing phase (i.e. xy).
Type D hardgauges are able to check traceability of the whole measuring process (sy), but there are some issues on this route. Firstly, there are 63 ISO parameters, but a type D hardgauge normally only provide certified values of parameter Ra & Rz.
51
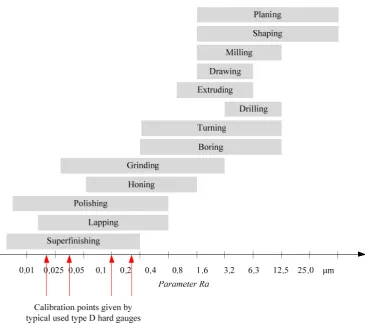
Finally, it is a problem to produce a reliable calibration curve by using type D hardgauges. It is well known than same Ra value can be obtained from significant various surfaces (Whitehouse 2002b). So the existing of the calibration curve of Ra
[image:53.595.114.480.299.627.2]parameter is an issue (Scott 2011). Type D hardgauges only provides few reference points, and the eyeballed fitting curves are often used (Song and Vorburger 1991). Figure 2.20 shows the calibration points (provided by some typical used type D hardgauges) and range of Ra value on typical surface produce by different processes. It can be found that the type D hardgauges only provide few calibration points, and the points do not fall into the range of Ra values on many typical eng