Modeling and Optimization of Tool Life and Surface
Roughness for End Milling Titanium Alloy Ti–6Al–
4V Using Uncoated WC-Co Inserts
Turnad L. Ginta, A.K.M. Nurul Amin, A.N.M Karim, Anayet U. Patwari
Department of Manufacturing and Materials Engineering International Islamic University Malaysia
Kuala Lumpur, Malaysia
Email: [email protected]
M.A. Lajis
Faculty of Mechanical and Manufacturing UTHM, 86400 Batu Pahat
Johor, Malaysia
Abstract— This paper presents an approach to establish models and the efforts in optimization of tool life and surface roughness in end milling of titanium alloy Ti–6Al– 4V using uncoated WC-Co inserts under dry conditions. Response surface methodology coupled with small central composite design (CCD) was employed in developing the tool life and surface roughness models in relation to primary cutting parameters such as cutting speed, axial depth of cut and feed. Flank wear has been considered as the criteria for tool failure and the wear was measured under a Hisomet II Toolmaker’s microscope. Mitutoyo surftest was utilized for surface roughness measurements. Design-expert version 6.0.8 software was applied to establish the first-order and the second-order models and develop the contours. The adequacy of the predictive model was verified using analysis of variance (ANOVA) at 95% confidence level.
Keywords-response surface; tool life;surface roughness;RSM
I. INTRODUCTION
In order to establish an adequate functional relationship between the responses (such as surface roughness, cutting force, tool life/wear) and the cutting parameters (cutting speed, feed, and depth of cut), a large number of tests are needed, requiring a separate set of tests for each and every combination of cutting tool and work piece material. This increases the total number of tests and as a result the experimentation cost also increases. As a group of mathematical and statistical techniques, response surface methodology (RSM) is useful for modeling the relationship between the input parameters (cutting conditions) and the output variables. RSM saves cost and time by reducing number of experiments required.
RSM is a dynamic and foremost important tool of design of experiment (DOE), wherein the relationship between response(s) of a process with its input decision variables is mapped to achieve the objective of maximization or minimization of the response properties[1][2]. Many machining researchers have used response surface methodology to design their experiments and assess results. Kaye et al [3] used response surface methodology in predicting
tool flank wear using spindle speed change. A unique model has been developed which predicts tool flank wear, based on the spindle speed change, provided the initial flank wear at the beginning of the normal cutting stage is known. Alauddin et al. [4] applied response surface methodology to optimize the surface finish in end milling inconel 718. Mansour et al [5] developed a surface roughness model for end milling of a semi - free cutting carbon casehardened steel. They investigated a first-order equation covering the speed range 30–35 m/min and a second order generation equation covering the speed range 24–38 m/min. They suggested that an increase in either the feed or the axial depth of cut increases the surface roughness, whilst an increase in the cutting speed decreases the surface roughness. Oktem et al used response surface methodology with a developed genetic algorithm (GA) in the optimization of cutting conditions for surface roughness [6]. S. Sharif et al used factorial design coupled with response surface methodology in developing the surface roughness model in relation to the primary machining variables such as cutting speed, feed, and radial rake angle [7]. Ginta et al [8] used response surface methodology in assessing tool life in end milling titanium alloy Ti-6Al-4V with uncoated WC-Co inserts. They found that an increase of cutting speed, axial depth of cut and feed by 100%, will lead to reduction of tool life by 70%, 27%, and 37%, respectively.
II. MATHEMATICAL MODEL
Models for the machining responses for end milling in terms of the cutting parameters can be expressed as:
m l z k
d
f
CV
R
=
(1)Where R is the experimental (measured) responses (such as surface roughness, cutting force, tool life, etc), V is the cutting speed (m/min), fzis the feed (mm/tooth), and d is the axial
linearized by employing a logarithmic transformation, and Eq. (1) can be re-expressed as:
d m f l V k C
R ln ln ln z ln
ln = + + + (2)
The linear model of Eq. (2) is:
3 3 2 2 1 1 0
0x β x β x β x β
y= + + + (3)
where y is the true response of experimental results on a logarithmic scale x0 = 1 (dummy variable), x1,x2, x3 are
logarithmic transformations of speed, feed, and depth of cut, respectively, while β0, β1, β2, and β3 are the parameters to be
estimated. Eq (3) can be expressed as :
3 3 2 2 1 1 0 0 1
ˆ y ε b x bx b x bx
y = − = + + + (4)
Where yˆ is the estimated response, and y is the measured experimental results on a logarithmic scale, ε is the experimental error and the b values are estimates of the β
parameters.
The second-order model can be extended from the first-order model’s equation as:
3 2 23 3 1 13 2 1 12 2 3 33 2 2 22 2 1 11 3 3 2 2 1 1 0 0 2 ˆ x x b x x b x x b x b x b x b x b x b x b x b ε y y + + + + + + + + + = − = (5)
Where yˆ2 is the estimated response based on the second order model. ANOVA is used to verify and validate the model.
III. EXPERIMENTAL DETAILS
A. Machining Test
End milling tests were conducted on Vertical Machining Center (VMC ZPS, Model: MLR 542) with full immersion cutting and under dry conditions. Machining was performed with a 20 mm diameter end-mill tool holder fitted with one uncoated WC-Co insert. Mitutoyo SURFTEST SV-500 was used to measure the surface roughness. Flank wear has been considered as the criteria for tool failure and the wear was measured under a Hisomet II Toolmaker’s microscope. Tool life experiments were stopped when an average flank wear achieved exceeded 0.3 mm.
B. Coding of the independent variables
The independent variables were coded taking into consideration the limitation and capacity of the milling machine. Levels of independent and coding identification are presented in Table 1.
The transforming equations for each of the independent
variables are:
70 ln 126 ln 70 ln ln 1 − − = V x
;
1 ln 65 . 1 ln 1 ln ln 2 − − = d x;
088 . 0 ln 128 . 0 ln 088 . 0 ln ln 3 − − = fz [image:2.612.333.529.329.564.2]x (6)
TABLE I. LEVEL OF INDEPENDENT VARIABLES AND CODING
IDENTIFICATION
Levels Lowest Low Centre High Highest
Coding -1.414 -1 0 +1 +1.414
x1, cutting speed,
V (m/min) 30.59 39 70.1 126 160.6
x2, axial depth of
cut, d (mm) 0.5 0.61 1 1.65 2.03
x3, feed, fz
(mm/tooth) 0.05 0.06 0.088 0.128 0.15
IV. RESULTS AND DISCUSSIONS
A. Tool life models
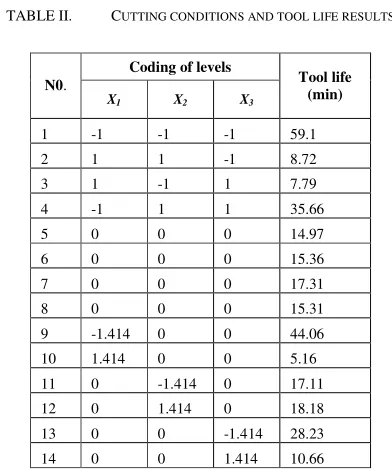
The results of tool life in end milling for different cutting conditions for all the 14 trial runs with central composite design are shown in Table 2. Fit and summary test suggests that the first-order and the second-order models are the most suitable models for predicting the tool life in end milling of titanium alloy Ti-6Al-4V, as shown in Table 3.
The first-order model of the tool life obtained from experimental data in Table 1 is as follows:
3 2 1 0.038 0.25 81 . 0 9 . 2
ˆ x x x
y= − − − (7)
TABLE II. CUTTING CONDITIONS AND TOOL LIFE RESULTS
Coding of levels N0.
X1 X2 X3
Tool life (min)
1 -1 -1 -1 59.1
2 1 1 -1 8.72
3 1 -1 1 7.79
4 -1 1 1 35.66
5 0 0 0 14.97
6 0 0 0 15.36
7 0 0 0 17.31
8 0 0 0 15.31
9 -1.414 0 0 44.06
10 1.414 0 0 5.16
11 0 -1.414 0 17.11
12 0 1.414 0 18.18
13 0 0 -1.414 28.23
14 0 0 1.414 10.66
Eq. (7) can be transformed using Eq. (6) as transforming equation to provide the tool life (min) as a function of the cutting speed V (m/min), feed fz (mm/tooth) and axial DOC d
(mm) as follows:
667 . 0 076 . 0 381 . 1 274
1 − − −
= V d fz
T
(8)
speed has the most significant effects on tool life, followed by feed and axial depth of cut. This equation is valid for end milling (full immersion) under room temperature conditions within the cutting speed V, axial depth of cut d and feed fz
ranges of: 39 ≤V≤ 160 m/min, 0.5 ≤d≤ 2.03 mm, and 0.05 ≤ fz ≤ 0.15 mm/tooth respectively
TABLE III. FIT AND SUMMARY TEST FOR TOOL LIFE MODEL
Source SS DF MS F
Value Prob
> F
Mean 112.934 1 112.934
Block 0.008 1 0.008
Linear 5.738 3 1.913 67.62
<
0.0001 Suggested
2FI 0.121 3 0.040 1.81 0.2461
Quadratic 0.121 3 0.040 9.36 0.0494 Suggested
Cubic 0.000 0 Aliased
Residual 0.013 3 0.004
Total 118.935 14 8.495
The second-order model was also developed to extend the variable range to describe adequately the relationship between the end milling output (tool life) and the investigated independent variables. The second-order model for tool life in its transformation state is given as:
2 1 2 3 2 2
3 2 1
19 . 0 057 . 0 066 . 0
34 . 0 021 . 0 75 . 0 79 . 2 ˆ
x x x x
x x x y
− −
+ − − −
[image:3.612.331.512.92.277.2]= (9)
TABLE IV. ANALYSIS OF VARIANCE FOR TOOL LIFE FIRST-ORDER MODEL
Source SS DF MS F
Value Prob
> F
Model
5.738 3 1.913 72.78 <
0.0001 significant
1
x
5.229 15.229 198.96 < 0.0001
2
x
0.012 10.012 0.45 0.5188
3
x
0.498 10.498 18.93 0.0014 Residual 0.263 10 0.026
Lack of Fit
0.250 7 0.036 8.30 0.0549
not significant Pure Error 0.013 3 0.004
Cor Total 6.001 13
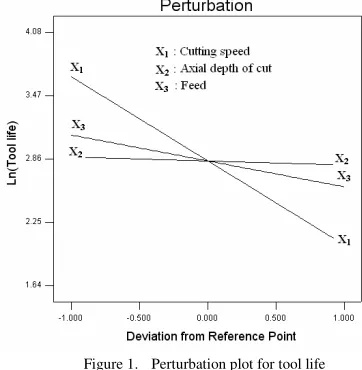
The results of the ANOVA test for first-order model are shown in Table 4. Furthermore, from the ANOVA test, it is proved that cutting speed and feed have significant effects on tool life model, where axial depth of cut is insignificant. We can conclude that an increase in axial depth of cut will not significantly affect the tool life. Hence, increasing axial depth of cut is recommendable to increase the metal removal rate without sacrificing the tool life. Perturbation plot of the tool life as shown in Fig. 1 also confirm this result. It is clearly
confirmed that cutting speed is the major factor affecting the tool life.
Figure 1. Perturbation plot for tool life
A move to the right side from the reference point resulted in decrement of tool life. Axial depth of cut and feed also reflected the same effect on tool life i.e. a move to the right side of the curve from the reference point resulted in decrement of tool life. However, the effect of feed is slightly higher than the effect of axial depth of cut over tool life.
B. Surface roughness models
[image:3.612.64.295.163.290.2]Surface roughness results in end milling of Ti-6Al-4Vwith uncoated WC-Co inserts are shown in Table 5. Fit and summary test suggests that the second-order model is the most suitable models for predicting the tool life in end milling of titanium alloy Ti-6Al-4V, as shown in Table 6. However, first-order model can be also used for checking the trends and evaluating the parameters.
TABLE V. CUTTING CONDITIONS AND SURFACE ROUGHNESS RESULTS
Coding of levels N0.
X1 X2 X3
Surface roughness
(µm)
1 -1 -1 -1 0.17
2 1 1 -1 0.33
3 1 -1 1 0.41
4 -1 1 1 0.37
5 0 0 0 0.19
6 0 0 0 0.24
7 0 0 0 0.23
8 0 0 0 0.27
9 -1.414 0 0 0.23
10 1.414 0 0 0.61
11 0 -1.414 0 0.20
12 0 1.414 0 0.23
13 0 0 -1.414 0.17
[image:3.612.65.295.416.564.2] [image:3.612.321.520.454.676.2]The first-order model of the surface roughness under room temperature experiments which is obtained from experimental data in Table 5.5 is as follows:
3 2 1 0.095 0.32
27 . 0 28 .
1 x x x
y)=− + + + (10)
Eq. (10) is then transformed using Eq. (6) as transforming equation to provide the surface roughness (µm) as a function of the cutting speed V (m/min), axial DOC d (mm) and feed fz
(mm/tooth) as follows:
854 . 0 19 . 0 46 . 0
31 .
0 z
a V d f
R =
(11)
Eq. (11) indicates that an increase in all cutting parameters (the cutting speed, axial depth of cut and feed) increases the surface roughness values. The equation affirms that feed has the most significant effect on surface roughness, followed by cutting speed and axial depth of cut. This is related to the effect of vibration, built-up edge, and other phenomena that occur during machining. Low modulus of elasticity of the titanium alloys is also responsible for higher surface roughness in machining this material. Equation (11) is valid for end milling (full immersion) under dry conditions within the cutting speed
V, axial depth of cut d and feed fz ranges of: 30.6 ≤V≤ 160
m/min, 0.5 ≤ d ≤ 2.03 mm, and 0.05 ≤ fz ≤ 0.15 mm/tooth
respectively.
TABLE VI. FIT AND SUMMARY TEST FOR SURFACE ROUGHNESS MODEL
Source SS DF MS
F Value
Prob > F
Mean 22.97 1 22.974
Linear 1.44 3 0.480 8.19 0.0048
2FI 0.10 3 0.033 0.47 0.7113
Quadratic 0.42 3 0.140 8.27 0.0344 Suggested
Cubic 0.00 1 0.001 0.03 0.8702 Aliased
Residual 0.07 3 0.022
Total 25.00 14 1.786
TABLE VII. ANALYSIS OF VARIANCE FOR SURFACE ROUGHNESS FIRST
-ORDER MODEL
Source SS DF MS F
Value Prob >
F
Model 1.44 3 0.48 8.19 0.0048 significant
1
x
0.58 1 0.58 9.81 0.01072
x
0.07 1 0.07 1.23 0.29433
x
0.79 1 0.79 13.53 0.0043Residual 0.59 10 0.06
Lack of Fit 0.52 7 0.07 3.32 0.1760 not significant
Pure Error 0.07 3 0.02
Cor Total 2.03 13
The second-order model for surface roughness in its transformation state is:
3 2 2 1 2 3 2 2
2 1 3 2 1
15 . 0 13 . 0 085 . 0 068 . 0
21 . 0 38 . 0 095 . 0 34 . 0 41 . 1
x x x x x x
x x x x y
− −
+ −
+ + + + − =
)
(12)
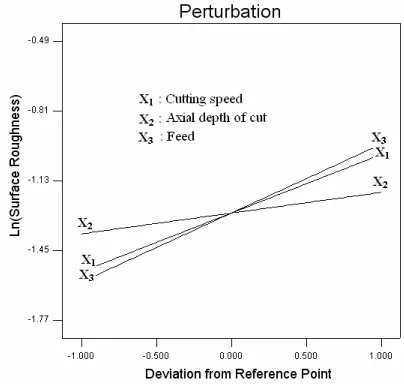
Eq. (12) also affirms that an increase in all cutting parameters (cutting speed, axial depth of cut and feed) leads to increase in the surface roughness. Figure 2 presents the perturbation plot, and confirms that an increase in all cutting parameters evidently increases the surface roughness. It is pretty clear that feed and cutting speed are the major factors influencing the surface roughness. A move to the right side from the reference point resulted in decrement of surface roughness. Axial depth of cut also reflected the same effect on surface roughness i.e. a move to the right side of the curve from the reference point resulted in increment of surface roughness.
[image:4.612.332.534.259.451.2]
Figure 2. Perturbation plot for surface roughness
C. Optimization
From the development of tool life and surface roughness models which are previously discussed, it is interesting to develop a new relationship of those models. The first-order models of tool life and surface roughness from Eq. 8 and Eq. 11 can be re-written as:
531 . 1 266 . 0 841 . 1
7 .
4109 − − −
=
z a
f d V R
T
(13)
factors and responses under investigation are generated using Design-Expert Version 6.0.8. Table 8 presents three possible solutions for optimum cutting parameters in end milling of Ti-6Al-4V using uncoated WC-Co inserts. The results shows that the cutting speed of 39 m/min becomes the optimum cutting speed for end milling of titanium alloy Ti-6Al-4V using uncoated WC-Co inserts. The optimum axial DOC and feed are found to be 0.78 mm and 0.061 mm/tooth respectively. For instance, the surface roughness value of 0.25 µm might be the best surface roughness could be achieved with the optimum cutting parameters with 97.3% desirability.
TABLE VIII. POSSIBLE OPTIMAL SOLUTION FOR END MILLING
No
Cutting speed (m/min)
Axial DOC (mm)
Feed (mm/tooth)
Tool life (min)
Ra (µm)
Desire ability
1 39.0 0.779 0.061 10.31 0.25 0.973
2 39. 0 0.778 0.061 10.38 0.25 0.969
3 39.4 0.791 0.061 10.38 0.25 0.965
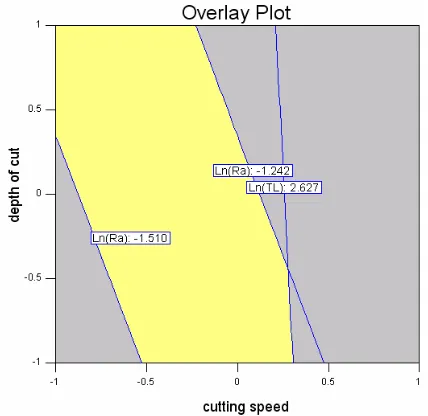
[image:5.612.71.287.216.283.2]Graphical optimization involves the creation of an overlay plot which is produced by superimposing the contours for the various responses, i.e. tool life and surface roughness as can be seen in Fig. 3. By defining the limit of the tool life and surface roughness, the shaded portion of the overlay plot could be presented.
Figure 3. Graphical optimization through the use of overlay plot (feed = 1 mm/tooth)
V. CONCLUSIONS
The following specific conclusions have been drawn on the work:
1. Response surface methodology has been proved as a good method in designing the experiments, modelling the models, and optimizing the cutting parameters in end milling of titanium alloy using uncoated WC-Co inserts under dry conditions.
2. It is found that cutting speed has the most significant effects on tool life, followed by feed and axial depth of cut. Meanwhile, the feed has the most significant effect on surface roughness, followed by cutting speed and axial depth of cut.
3. The optimum cutting speed, feed, and axial DOC for end milling of titanium alloy Ti-6Al-4V are 39 m/min, 0.78 mm and 0.061 mm/tooth respectively.
ACKNOWLEDGMENT
The authors wish to thank Ministry of Science, Technology and Innovation (MOSTI) Malaysia for their financial support to the above project through the e-Science Fund Project (Project No.03-01-08-SF0001), and the Research Management Centre IIUM for overall management of the project.
REFERENCES
[1] Box. G.E.P, Wilson. K.B, On the experimental attainment of optimal conditions,Journal of the Royal Statistical Society, B, 13, 1951, pp. 1-45.
[2] Montgomery, D.C, Design and analysis of experiment (5th
edition), New York, Wiley, 2001
[3] J.E. Kaye, D.H. Yan, N. Popplewell, S. Balakrishnan, Predicting tool flank wear using spindle speed change, Int. J. Mach. Tools Manufact. Vol. 35, No. 9, 1995, pp 1309-1320
[4] M. Alauddin, M.A. El Baradie, M.S.J. Hashmi, Optimization of surface finish in end milling inconel 718, Journal of Material Pocesssing and Technology 56, 1996, pp. 54 – 65.
[5] Mansour, H. Abdalla, Surface roughness model for end milling: a semi-free cutting carbon casehardening steel (EN32) in dry condition,” Journal of Materials Processing Technology 124, pp. 183 – 191, 2002. [6] H. Oktem, T. Erzurumlu, H. Kurtaran, Application of response surface
methodology in the optimization of cutting conditions for surface roughness,” Journal of Material Processing and Technology 170, pp. 11 – 16, 2005.
[7] S. Sharif, A.S. Mohruni, M.Y. Noordin, V.C. Vencatesh, Optimization of surface roughness prediction model in end milling titanium alloy (Ti-6Al-4V), Proceeding of ICOMAST, pp. 55 – 59, 2006.
[image:5.612.72.286.372.580.2]