MAR-APRIL 2016, VOL-3/23 www.srjis.com Page 2070 MANAGEMENT DEVELOPMENT PROGRAMS PROGRAM
Khadilkar Sujay Madhukar, Ph. D.
Asso.Professor KITs IMER Kolhapur
Introduction:
In recent years, much emphasis has been placed on the importance of focusing faculty
orientation programs not only on the needs of the targeted individuals, but also on
organizational aspects. Although improvement of the individual is undoubtedly a vital aspect,
it is sometimes regarded as being less consequential compared to institutional growth. Hence,
in reality, faculty orientation often actually entails making the personnel fit the purpose of the
institution. According to Bland, faculty orientation activities are designed to improve faculty
members with respect to their commitment to their work and their ability to achieve both
their own goals and the objectives of the institution. With that in mind, it was concluded that
effective faculty orientation has two important features: first, a broad perspective that
continuously searches for and tries to address all the aspects that impact faculty success;
second, systematic and rigorous attention given to each of the steps in the faculty orientation
process. Therefore, when designing and implementing faculty orientation programs, it has
been proposed that it is important to understand not only the objectives of individual faculty
members, but the goals of the organization as well. If that is indeed the most suitable
approach, then, from the standpoint of the organization, it will make sense to support
development programs focused on individual faculty members, because that will help
accomplish the missions of the organization.
There is also another reason why the organization should be taken into consideration in
faculty orientation efforts. In order to succeed, faculty members should share the vision and
values of the organization so that they can apply the skills they learn. This means that the
organization should have special characteristics that facilitate faculty success, including clear
organizational goals, equitable personal policies, effective reward structures, and a supportive
MAR-APRIL 2016, VOL-3/23 www.srjis.com Page 2071
climate. Thus the goals of individual faculty members, the objectives of the institution, the
levels of ability of the individuals, and the characteristics of the institution are all essential
parts of creating an effective faculty orientation program. Steinert and Mann have declared
that faculty orientation activities should link individual and organizational needs, and also
pair organizational development with development of individual skills. In addition to the
aspects mentioned above, other important characteristics of an effective faculty orientation
program are as follows: it should have a clearly stated and readily perceived mission; it
should be systematically designed to target specific sub-groups; it should cover a range of
skills, not just teaching, and it should teach theory and practical applications, and also
comprise work practice; the personnel running the program should maintain contact with the
participants; trainers should be committed to the program and be knowledgeable about
content areas related to the disciplines of the participants; the participants should attend
program activities in groups from the same institution; support should be available to
participants who are “back home” . Three other important features can be added to the list:
faculty member should be involved in the process of designing and implementing their own
program; faculty assessment should be used as an initial step; changes should be made in the
institutional environment.
Objectives of the paper
The general objective of the research underlying this thesis was to explore and enhance
faculty development in the setting of a developing country and thereby contribute to such
development elsewhere in the world as well. With this very fact in the mind researcher has
developed specific objectives of the paper which are given below -
1. Analyze the personal and professional impact of the Orientation Program on the teachers;
1.8) Scope of the paper
The scope of the paper is mentioned in terms of area under consideration, the time span,
faculties from recognized academic staff colleges and principals / directors of the colleges.
The elements are mentioned below –
1. Geographical scope- The paper covers Maharashtra and Gujarat states as
geographical unit.
2. The time period for this paper – The educational initiatives during 2004-2012 is taken for
the paper.
3. Recognized Management institutes – Recognized institutes under the various bodies
MAR-APRIL 2016, VOL-3/23 www.srjis.com Page 2072
4. Faculty members: Approved and ad –hoc faculty members are considered as the
respondents.
Directors and principals: The directors and principals of recognized institutes under the
various norms are taken for the paper
Reliability analysis of the data:
Reliability of measure indicates the extent to which it is without bias and hence ensures
consistent measurement across time and across the various items in the instrument. Thus,
reliability of a measure is an indication of the stability and consistency with which the
instrument measures the concept and helps to assess the goodness of measure.
SPSS (16.0) has the reliability analysis procedure. This reliability procedure is executed on
the data to assess its reliability.
In reliability analysis, the analyze menu is considered. The descriptive statistics menu is
further considered and the polar to polar plot is plotted for different variables. Reliability
analysis is carried out where the Cronbach’s alpha was tested. Ideally, the Cronbach’s alpha
should be in between 0.5 and 1. In our case, it comes out to be 0.637. Therefore, the data is
reliable. Following tables shows the SPSS output of reliability analysis.
Reliability
Scale: ALL VARIABLES
The steps used in hypothesis testing:
The basic objectives of hypothesis testing are to prove or disprove the research question. By
only allowing an error of 5% or 1% and making correct decisions based on statistical
principles, from the outcome of statistical analysis researcher can conclude the result. The
five steps are followed for testing hypothesis. These five steps consist of all the decisions a
researcher has followed in order to answer research question.
Stating the research question – The first step used in the present paper is to state the
research question that identifies the population(s) of interest, the parameter(s) of the variable
Case Processing Summary
N %
Cases Valid 300 100.0
Excludeda 0 .0
Total 300 100.0
a. Listwise deletion based on all variables
in the procedure.
Reliability Statistics
Cronbach's Alpha N of Items
MAR-APRIL 2016, VOL-3/23 www.srjis.com Page 2073
under investigation, and the hypothesized value of the parameter(s). This step helps in
defining what is to be tested and what variable wasused in sample data collection. The type
of variable whether it is categorical, discrete or continuous further defines the statistical test
which can be performed on the collected data set.
The null and alternative hypotheses – The second step followed in the paper is to state
alternate and null hypothesis to select a significance level.
Calculate test statistics - The third step used in the paper is calculation of a statistic
analogous to the parameter specified by the null hypothesis.
Compute probability of test statistic or rejection region – The fourth step is calculation of
the probability value (often called the p-value) which is the probability of the test statistic for
both tails.
State conclusions – The fifth and final step is description of the results and state correct
statistical conclusions in an understandable way. The conclusions consist of two
statements-ones describing the results of the null hypothesis and the other describing the results of the
alternative hypothesis.
Hypotheses Validation –
Spearman’s rank correlation is used to validate other hypotheses. The justification behind
validation for hypotheses is explained in detail below –
Spearman’s Rank Order Coefficient –
Sometimes it is important to determine the relationship between the two variables in terms of
ranking of each case within each variable. This is usually the case where it is necessary to
find ordinal relations. Under these circumstances it is required to use Spearman rank order
coefficient. The interpretation of the data is done with the help of 5 point Likert scale. As the
variables considered are categorical and discrete in nature, Spearman’s rank correlation is
used.
Testing statistical significance using statistical significance–
When Spearman coefficient rank is in between 0.9 and 1, it indicates that there is a very
strong correlation between two variables. When Spearman coefficient rank is in between 0.7
and 0.9, it indicates that there is a strong correlation between two variables. When Spearman
coefficient rank is in between 0.5 and 0.7, it indicates that there is a moderate correlation
between two variables.
Sometimes, the packages such as SPSS use p-value to test the hypothesis. When p<0.01
MAR-APRIL 2016, VOL-3/23 www.srjis.com Page 2074 Steps followed to validate the hypothesis:
Following steps are followed. There are the following basic steps to completing a hypothesis
z-test.
1. State the Null Hypothesis and the alternative hypothesis
2. State the decision criteria
3. Selection of confidence level
Confidence interval (CI) is a kind of interval estimate of population parameter and is used
to indicate the reliability of an estimate. It is an observed interval and differs from sample to
sample that frequently includes the parameter of interest, if the experiment is repeated. How
frequently the observed interval contains the parameter is determined by the confidence level
or confidence coefficient. Confidence intervals consist of a range of values that act as good
estimates of the unknown population parameter. The level of confidence of the confidence
interval would indicate the probability that the confidence range captures this true population
parameter given a distribution of samples. Researcher has selected the confidence level equal
to 95% which reflects a significance level of 0.05.
4. Determine the critical value of z
Do this for the chosen significance level. For alpha=.05 we look up a Z that has .025 of the
distribution beyond it. This is a Z of +1.96 and -1.96.
5. Interpret the data
6. Evaluate the hypothesis -Determine the standard error of the mean by the following
formula:
7. Calculate the Test Statistic: To determine how unusual the mean of a sample is, use the
following Z formula to calculate the Z value for our sample mean under the assumption
that the null hypothesis is true. The Z formula is:
8. Decision Making Time: obtained Z value up in a Z table to find the corresponding P, and
compare it to the Critical Z value. If the obtained P is less than alpha, we reject the null
MAR-APRIL 2016, VOL-3/23 www.srjis.com Page 2075 Table No. 4.1.11 Table showing the participants opinion about Development program
Sr . N o
Points 1 % 2 % 3 % 4 % 5 % Tot
al %
1
Participation in the Development
Programme, should be compulsory
1
1 7.33 2 8
18.6
7 0 0 3 4 22.6 7 7 7 51.3
3 150 100
2
Attendance to program is wastage of time
7 7 51.3 3 6 2 41.3
3 0 0 1 0.67 1
0 6.67 150 100
3
every teacher should undergo the Development Programme 1 9 12.6 7 1
0 6.67 2 1.3 3 5 2 34.6 7 6 7 44.6
7 150 100
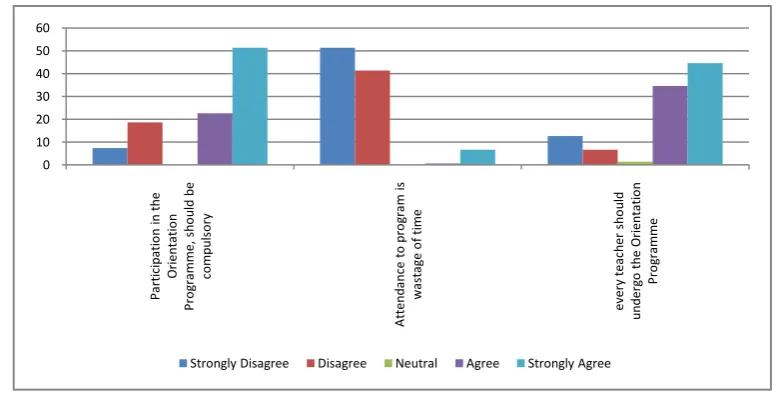
Graph No. 4.1.11 Graph showing the participants opinion about Development program
Description
Out of total sampled faculty members from Maharashtra, 7.33% of the faculty members
strongly disagree, 18.67% of the faculty members disagree, 22.67% of the faculty members
agree and 51.33% of the faculty members strongly agree with the fact that participation in the
Orientation Programme, should be compulsory.
Out of total sampled faculty members from Maharashtra, 51.33% of the faculty members
strongly disagree, 41.33% of the faculty members disagree, 0.67% of the faculty members
agree and 6.67% of the faculty members strongly agree with the fact that attendance to
program is wastage of time.
0 10 20 30 40 50 60 Pa rt ic ip at io n in t h e O ri en ta ti o n Pr o gr am m e, s h o u ld b e co m p u ls o ry A tt en d an ce to p ro gr am is w as ta ge o f ti m e ever y t ea ch er sh o u ld u n d erg o t h e O ri en ta ti o n Pr o gr am m e
MAR-APRIL 2016, VOL-3/23 www.srjis.com Page 2076
Out of total sampled faculty members from Maharashtra, 12.67% of the faculty members
strongly disagree, 6.67% of the faculty members disagree, 1.33% of the faculty members are
neutral, 34.67% of the faculty members agree and 44.67% of the faculty members strongly
[image:7.595.120.480.180.632.2]agree with the fact that every teacher should undergo the Orientation Programme.
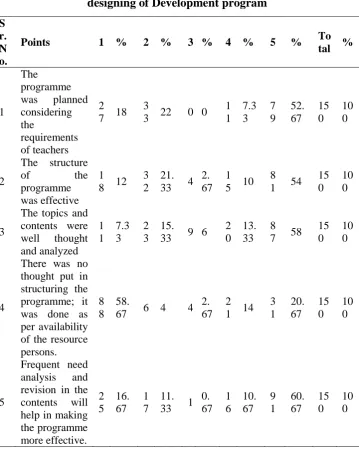
Table No. 4.1.12 Table showing the participants opinion about the planning and
designing of Development program
S r. N o.
Points 1 % 2 % 3 % 4 % 5 % To tal %
1 The programme was planned considering the
requirements of teachers
2 7 18
3
3 22 0 0 1 1 7.3 3 7 9 52. 67 15 0 10 0 2
The structure
of the
programme was effective
1 8 12
3 2
21. 33 4
2. 67
1 5 10
8 1 54
15 0
10 0
3
The topics and contents were well thought and analyzed 1 1 7.3 3 2 3 15.
33 9 6 2 0
13. 33
8 7 58
15 0
10 0
4
There was no thought put in structuring the programme; it was done as per availability of the resource persons.
8 8
58.
67 6 4 4 2. 67
2 1 14
3 1 20. 67 15 0 10 0 5
Frequent need analysis and revision in the contents will help in making the programme more effective. 2 5 16. 67 1 7 11. 33 1
MAR-APRIL 2016, VOL-3/23 www.srjis.com Page 2077 Graph No. 4.1.12 Graph showing the participants opinion about the planning and
designing of Development program
Description
Out of total sampled faculty members from Maharashtra, 18% of the faculty members
strongly disagree, 22% of the faculty members disagree, 7.33% of the faculty members agree
and 52.67% of the faculty members strongly agree with the fact that the programme was
planned considering the requirements of teachers.
Out of total sampled faculty members from Maharashtra, 12% of the faculty members
strongly disagree, 21.33% of the faculty members agree, 2.67 are neutral, 10% of the faculty
members are agree and 54% of the faculty members strongly agree with the fact that the
structure of the programme was effective.
Out of total sampled faculty members from Maharashtra, 7.33% of the faculty members
strongly disagree, 15.33% of the faculty members disagree, 6% of the faculty members are
neutral, 13.33% of the faculty members agree and 58% of the faculty members strongly agree
with the fact that the topics and contents were well thought and analyzed.
0 10 20 30 40 50 60 70 Th e p ro gr am m e w as p la n n ed c o n si d eri n g th e req u ir em en ts o f t ea ch ers Th e s tr u ct u re o f t h e p ro gr am m e w as ef fec ti ve Th e t o p ic s an d c o n ten ts w ere w el l t h o u gh t an d an al yze d Th ere w as n o t h o u gh t p u t in s tr u ct u ri n g th e p ro gr am m e; it w as d o n e as p er av ai la b ili ty o f t h e res o u rc e p ers o n s. Fr eq u en t n ee d a n al ys is a n d r evi si o n in t h e co n ten ts w ill h el p in m ak in g th e p ro gr am m e m o re ef fec ti ve.
MAR-APRIL 2016, VOL-3/23 www.srjis.com Page 2078
Out of total sampled faculty members from Maharashtra, 58.67% of the faculty members
strongly disagree, 4% of the faculty members disagree, 2% of the faculty members are
neutral, 14% of the faculty members agree and 20.67% of the faculty members strongly agree
with the fact that there was no thought put in structuring the programme; it was done as per
availability of the resource persons.
Out of total sampled faculty members from Maharashtra, 16.67% of the faculty members
strongly disagree, 11.33% of the faculty members disagree, 0.67% of the faculty members are
neutral, 10.67% of the faculty members agree and 60.67% of the faculty members strongly
agree with the fact that frequent need analysis and revision in the contents will help in
[image:9.595.97.502.327.772.2]making the programme more effective.
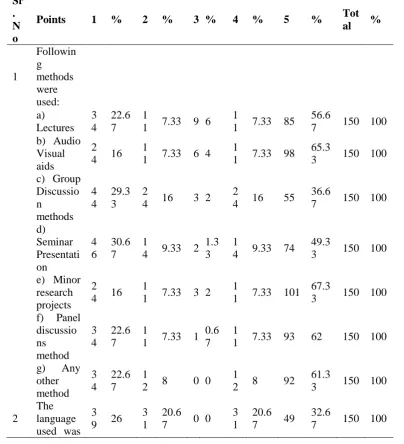
Table No. 4.1.13 Table showing the participants opinion about the training methods
used in Orientation Programme
Sr . N o
Points 1 % 2 % 3 % 4 % 5 % Tot al %
1 Followin g methods were used: a) Lectures 3 4 22.6 7 1
1 7.33 9 6 1
1 7.33 85 56.6
7 150 100 b) Audio
Visual aids
2 4 16
1
1 7.33 6 4 1
1 7.33 98 65.3
3 150 100
c) Group Discussio n methods 4 4 29.3 3 2
4 16 3 2 2
4 16 55 36.6
7 150 100
d) Seminar Presentati on 4 6 30.6 7 1
4 9.33 2 1.3 3
1
4 9.33 74 49.3
3 150 100
e) Minor research projects
2 4 16
1
1 7.33 3 2 1
1 7.33 101 67.3
3 150 100
f) Panel discussio ns method 3 4 22.6 7 1
1 7.33 1 0.6 7
1
1 7.33 93 62 150 100
g) Any other method 3 4 22.6 7 1
2 8 0 0 1
2 8 92 61.3
3 150 100
2
The language used was
3 9 26
3 1
20.6 7 0 0
3 1
20.6 7 49
32.6
MAR-APRIL 2016, VOL-3/23 www.srjis.com Page 2079 easy 3 Teaching methods used were out dated 4 2 28
4 1
27.3 3 0 0
4 1
27.3 3 26
17.3
3 150 100
Graph No. 4.1.13 Graph showing the participants opinion about the training methods
used in Orientation Programme
Description
Out of total sampled faculty members from Maharashtra, 22.67% of the faculty members
strongly disagree, 7.33% of the faculty members disagree, 6% of the faculty members are
neutral, 7.33% of the faculty members agree and 56.67% of the faculty members strongly
agree with the fact that lectures are conducted in orientation program.
Out of total sampled faculty members from Maharashtra, 16% of the faculty members
strongly disagree, 7.33% of the faculty members disagree, 4% of the faculty members are
neutral, 7.33% of the faculty members agree and 65.33% of the faculty members strongly
agree with the fact that audio visual aids are used in orientation program.
Out of total sampled faculty members from Maharashtra, 29.33% of the faculty members
strongly disagree, 16% of the faculty members disagree, 2% of the faculty members are
0 10 20 30 40 50 60 70 80 a) L ec tu res b ) A u d io Vi su al a id s c) G ro u p D is cu ss io n m et h o d s d ) S em in ar Pr es en ta ti o n e) M in o r res ea rc h p ro je ct s f) Pa n el d is cu ss io n s m et h o d g) A n y o th er m et h o d Th e l an gu ag e u sed w as ea sy Tea ch in g m et h o d s u sed w ere o u t d at ed
MAR-APRIL 2016, VOL-3/23 www.srjis.com Page 2080
neutral, 16% of the faculty members agree and 36.67% of the faculty members strongly agree
with the fact that group discussions are conducted in orientation program.
Out of total sampled faculty members from Maharashtra, 30.67% of the faculty members
strongly disagree, 9.33% of the faculty members disagree, 1.33% of the faculty members are
neutral, 9.33% of the faculty members agree and 49.33% of the faculty members are strongly
agree with the fact that seminars are given in orientation program.
Out of total sampled faculty members from Maharashtra, 16% of the faculty members
strongly disagree, 7.33% of the faculty members disagree, 2% of the faculty members are
neutral, 7.33% of the faculty members agree and 67.33% of the faculty members strongly
agree with the fact that minor research projects are given in orientation program.
Out of total sampled faculty members from Maharashtra, 22.67% of the faculty members
strongly disagree, 7.33% of the faculty members disagree, 0.67% of the faculty members are
neutral, 7.33% of the faculty members agree and 62% of the faculty members strongly agree
with the fact that panel discussion methods are used as a teaching tool in orientation program.
Out of total sampled faculty members from Maharashtra, 22.67% of the faculty members
strongly disagree, 8% of the faculty members disagree, 8% of the faculty members agree and
61.33% of the faculty members strongly agree with the fact that other tools are used in
orientation program.
Out of total sampled faculty members from Maharashtra, 26% of the faculty members
strongly disagree, 20.67% of the faculty members disagree, 20.67% of the faculty members
agree and 32.67% of the faculty members strongly agree with the fact that language used in
orientation program was easy.
Out of total sampled faculty members from Maharashtra, 28% of the faculty members
strongly disagree, 27.33% of the faculty members disagree, 27.33% of the faculty members
agree and 17.33% of the faculty members are strongly agree with the fact that teaching
methods used in orientation program were outdated.
Teaching Experience of faculty member
A. The percentage of the faculty members with teaching experience of less than 5 years
that attended the orientation program in Maharashtra was higher than the percentage of
the faculty members with teaching experience of less than 5 years that attended the
orientation program in Gujrat.
B. The percentage of the faculty members with teaching experience of 5 to 10 years that
MAR-APRIL 2016, VOL-3/23 www.srjis.com Page 2081
faculty members with teaching experience of 5 to 10 years that attended the orientation
program in Gujrat.
C. The percentage of the faculty members with teaching experience of greater than 5 years
that attended the orientation program in Maharashtra was same as the percentage of the
faculty members with teaching experience of greater than 5 years that attended the
orientation program in Gujrat.
Working location of faculty member
A. The percentage of the faculty members working in university department that attended
the orientation program in Maharashtra was higher than the percentage of the faculty
members working in university department that attended the orientation program in
Gujrat.
B. The percentage of the faculty members working in college / institute that attended the
orientation program in Gujrat was more than the percentage of the faculty members
working in college / institute that attended the orientation program in Maharashtra.
C. The percentage of the faculty members working in Aided that attended the orientation
program in Maharashtra was less than the percentage of the faculty members working in
Aided that attended the orientation program in Gujrat.
D. The percentage of the faculty members working in Non-Aided that attended the
orientation program in Maharashtra was greater than the percentage of the faculty
members working in Non-Aided that attended the orientation program in Gujrat.
E. The percentage of the faculty members working in Government that attended the
orientation program in Maharashtra was equalto the percentage of the faculty members
working in Government that attended the orientation program in Gujrat.
F. The percentage of the faculty members working in Private that attended the orientation
program in Maharashtra was higher than the percentage of the faculty members working
in Private that attended the orientation program in Gujrat.
Level of courses taught by the faculty member
A. The percentage of the faculty members teaching to the “UG Level” that attended the
orientation program in Maharashtra was greater than the percentage of the faculty
members teaching to the “UG Level” that attended the orientation program in Gujrat.
B. The percentage of the faculty members teaching to the “PG Level” that attended the
orientation program in Maharashtra was lesser than the percentage of the faculty
MAR-APRIL 2016, VOL-3/23 www.srjis.com Page 2082
Location of the working institution of the faculty member
A. The percentage of the faculty members teaching in the “Urban / Metropolitan” area that
attended the orientation program in Maharashtra was greater than the percentage of the
faculty members teaching in the “Urban / Metropolitan” area that attended the
orientation program in Gujrat.
B. The percentage of the faculty members teaching in the “Suburban” area that attended the
orientation program in Gujrat was more than the percentage of the faculty members
teaching in the “Suburban” area that attended the orientation program in Maharashtra.
C. The percentage of the faculty members teaching in the “any other specific zone” area
that attended the orientation program in Maharashtra was less than the percentage of the
faculty members teaching in the “any other specific zone” area that attended the
orientation program in Gujrat.
D. The percentage of the faculty members teaching in the “Rural” area that attended the
orientation program in Maharashtra was higher than the percentage of the faculty
members teaching in the “Rural” area that attended the orientation program in Gujrat.
a) Findings related to the participants opinion about Orientation Program’s objectives
and contents:
A questionnaire (set of ten questions) was prepared for assessing the participants (including
both Maharashtra and Gujrat) opinion about the orientation program’s objectives and
contents. The questionnaire was designed to capture the participant’s responses on multiple
parameters like improvement of self-image, increase in communication skills, teaching
learning process, improvement in lecture delivery, improvements in contents of teaching,
innovative teaching, social awareness, use if ICT teaching, teaching cross curricular skills
and improvement to become effective teacher. Further the participants were asked to respond
to each of the question in one of the category among the multiple categories viz. Strongly
Agree, Agree, Neutral, Disagree and Strongly Disagree.
Based on the responses received from the participants from Maharashtra and Gujrat following
are the findings on the participant’s opinion about the orientation program’s objectives and
contents:
High percentages of participants in Maharashtra and Gujrat have agreed that the program
helped them in improving their self-image. The percentage of participants who agreed
(including count of both Agreed and Strongly Agreed) that the program helped them in
MAR-APRIL 2016, VOL-3/23 www.srjis.com Page 2083
from participants in Maharashtra. Overall considering the response from the participants
from both the states it was noted that majority of the participants in both the states have
strongly agreed that the program helped them improve their self-image.
Secondly the major percentages of the participants in Maharashtra and Gujrat have opined
that the program had helped them in increasing their communication skills. The
percentage of participants who agreed (including count of both Agreed and Strongly
Agreed) that the program helped them in improving their communication skills was
marginally lower in Gujrat as compared to the response from participants in Maharashtra.
Overall considering the response from the participants from both the states it was noted
that major chunk of the participants in both the states have strongly agreed that the
program helped them to improve their communication skills.
Further substantial percentages of the participants in Maharashtra and Gujrat have
mentioned that the program had helped them in increasing their teaching learning process.
The percentage of participants who agreed (including count of both Agreed and Strongly
Agreed) that the program helped them in improving their teaching learning process was
marginally higher in Maharashtra as compared to response from the participants from
Gujrat. Overall considering the response from the participants from both the states it was
noted that substantial numbers of the participants in both the states have strongly agreed
that the program helped them to improve their teaching learning process.
A good percentage of the participants in Maharashtra and Gujrat have mentioned that the
program had helped them in improving their lecture delivery. The percentage of
participants who agreed (including count of both Agreed and Strongly Agreed) that the
program helped them in improving their lecture delivery process was marginally higher in
Gujrat as compared to the response from participants from Maharashtra. In all
considering the response from the participants from both the states it was noted that
majority of the participants in both the states have strongly agreed that the program
helped them to improve their lecture delivery.
Further high percentages of the participants in Maharashtra and Gujrat have mentioned
that the program had helped them in improving their contents of teaching. The percentage
of participants who agreed (including count of both Agreed and Strongly Agreed) that the
program helped them in improving their contents of teaching was marginally lower in
Gujrat as compared to the response from participants from Maharashtra. In total,
MAR-APRIL 2016, VOL-3/23 www.srjis.com Page 2084
chunk of the participants in both the states have strongly agreed that the program helped
them to improve their contents of teaching.
Further a good percentage of the participants in Maharashtra and Gujrat have mentioned
that the program had helped them in improving their Innovative teaching pedagogy. The
percentage of participants who agreed (including count of both Agreed and Strongly
Agreed) that the program helped them in improving their Innovative teaching pedagogy
was higher in Gujrat as compared to the response from participants from Maharashtra.
Overall, considering the response from the participants from both the states it was noted
that a good number of the participants in both the states have strongly agreed that the
program helped them to improve their Innovative teaching pedagogy.
A major percentage of the participants in Maharashtra and Gujrat have mentioned that the
program had helped them in improving their social awareness. The percentage of
participants who agreed (including count of both Agreed and Strongly Agreed) that the
program helped them in improving their social awareness was lower in Gujrat as
compared to the response from participants from Maharashtra. In all, considering the
response from the participants from both the states it was noted that a majority of the
participants in both the states have strongly agreed that the program helped them to
improve their social awareness.
Further good percentage of the participants in Maharashtra and Gujrat has mentioned that
the program had helped them in improving their use of ICT in teaching. The percentage
of participants who agreed (including count of both Agreed and Strongly Agreed) that the
program helped them in improving their use of ICT in teaching was marginally higher in
Gujrat as compared to the response from participants from Maharashtra. In total,
considering the response from the participants from both the states it was noted that a
majority of the participants in both the states have strongly agreed that the program
helped them to improve their use of ICT in teaching.
Major percentage of the participants in Maharashtra and Gujrat has mentioned that the
program had helped them in improving them in teaching cross-curricular skills. The
percentage of participants who agreed (including count of both Agreed and Strongly
Agreed) that the program helped them in improving them in teaching cross-curricular
skills was lower in Gujrat as compared to the response from participants from
MAR-APRIL 2016, VOL-3/23 www.srjis.com Page 2085
it was noted that a majority of the participants in both the states have strongly agreed that
the program helped them to improve them in teaching cross-curricular skills.
Finally major percentage of the participants in Maharashtra and Gujrat has mentioned that
the program had helped them to become effective teacher. The percentage of participants
who agreed (including count of both Agreed and Strongly Agreed) that the program
helped them to become effective teacher was lower in Gujrat as compared to the response
from participants from Maharashtra. Overall, considering the response from the
participants from both the states it was noted that a majority of the participants in both the
states have strongly agreed that the program helped them to become effective teacher.
Considering the overall response from the participants on the various parameters
mentioned above it can be concluded that the participants in both the states Maharashtra
and Gujrat were highly satisfied with the orientation program objectives and contents.
Majority of the participants in both the states Maharashtra and Gujrat strongly agreed that
the program’s content helped them in improving on multiple aspects mentioned above.
Bibliography:
Datta, J. (2000). Academic Staff Colleges as Nodal Centre for Academic Excellence. University News , 38 (1).
Dhar, B. B., & Singh, T. (1990). Academic Staff Colleges: A Developing concept.
Dhawan, R. (2000). Impact of Academic Staff College’s programmes on Teachers and Students. University NEws , 38 (16).
Dr. Ishwara, P., & Dr. Laxman, P. (2007). Participant’s Attitude to Refresher Courses in Commerce and Management. Journal of Experiments in Education
Gafoor, A. K. (2004). Teacher Education: Need for constitutional Awareness Programme. University News , 42 (42).
Goswami, D. (2010). Teachers’ Training Programme of Academic Staff College Gauhati University: An Appraisal. University News , 48 (10).
Hariharan, M., & Ramabrahman, I. (1996). Professionalizing the orientation course. University News .
Idaka, I. I., Dr. Joshua, M. T., & Kritsinis, W. A. (2006). Attitude of Academic Staff in Nigerian Tertiary Educational Institutions to Student Evaluation of Instruction (SEI). National Forum Of Educational Administration And Supervision Journal , 23 (4).