Laboratories from 1994 to 2008
Pawan K. Angra,aThomas H. Taylor,bMichael F. Iademarco,cBeverly Metchock,cJ. Rex Astles,dand John C. Ridderhofd
Laboratory Systems Development Branch, Division of Preparedness and Emerging Infections, National Center for Emerging and Zoonotic Diseases, Centers for Disease Control and Prevention, Atlanta, Georgia, USAa; Division of Bacterial Diseases, National Center for Immunization and Respiratory Diseases, Centers for Disease Control and Prevention, Atlanta, Georgia, USAb; Laboratory Branch, Division of Tuberculosis Elimination, National Center for HIV/AIDS, Viral Hepatitis, STD, and Tuberculosis Prevention, Centers for Disease Control and Prevention, Atlanta, Georgia, USAc; and Laboratory Science, Policy and Practice Program Office, Office of Surveillance, Epidemiology & Laboratory Services, Centers for Disease Control and Prevention, Atlanta, Georgia, USAd
We present a statistical summary of results from the Model Performance Evaluation Program (MPEP) forMycobacterium tuber-culosisDrug Susceptibility Testing, 1994 to 2008, implemented by the U.S. Centers for Disease Control and Prevention (CDC). During that period, a total of 57,733 test results for culture isolates were reported by 216 participating laboratories for the first-line antituberculosis drugs used in the United States—isoniazid (INH), rifampin (RMP), ethambutol (EMB), and pyrazinamide (PZA). Using Clinical Laboratory and Standards Institute (CLSI)-recommended concentrations for one or more of three meth-ods, agar proportion (AP), BACTEC460 (Bactec), and MGIT-960 (MGIT), yielded overall agreement of 97.0% for first-line drugs. For susceptible strains, agreement was 98.4%; for resistant strains, agreement was 91.0%, with significantly lower accuracy (chi-square test,P<0.0001). For resistant strains, overall agreement by methods was 91.3% for AP, 93.0% for Bactec, and 82.6% for MGIT and by drugs was 92.2% for INH, 91.5% for RMP, 79.0% for EMB, and 97.5% for PZA. For some strains, performance by method varied significantly. Use of duplicate strains in the same shipment and repeat strains over time revealed consistent per-formance even for strains with higher levels of interlaboratory discordance. No overall differences in perper-formance between labo-ratories were observed based on volume of testing or type of facility (e.g., health department, hospital, independent). By all methods, decreased performance was observed for strains with low-level INH resistance, RMP resistance, and EMB-resistant strains. These results demonstrate a high level of performance in detection of drug-resistantM. tuberculosisin U.S. laboratories.
A
ccurate drug susceptibility testing (DST) for theMycobacte-rium tuberculosis complex (MTBC) is important to guide
therapy and to assess the effectiveness of tuberculosis (TB) control through surveillance (12–15, 21, 22). In the United States, a total of 11,181 tuberculosis disease cases were reported in 2010, for a case rate of 3.6 per 100,000 population (7). There has been a con-tinued decline since the peak of the resurgence in 1992 (5). In response to the resurgence, in January 1992, the U.S. Centers for Disease Control and Prevention (CDC) established a federal TB task force that published the National Action Plan to Combat Multidrug-Resistant Tuberculosis (4). At that time, most labora-tories in the United States used the solid-culture method of agar proportion. Because of delays in diagnosis, especially in the setting of emerging HIV prevalence, the task force report and publication of laboratory survey data led to strong national recommendations to adopt rapid testing methods, including growth-based, liquid-culture DST (at the time, commercially available, FDA-cleared BACTEC460 [Bactec]) to decrease turnaround of results (3, 11, 25, 28). In 1994, the CDC established the Model Performance Evaluation Program (MPEP)M. tuberculosisDST to promote use of rapid, growth-based, liquid-culture methods; assist laborato-ries with the transition to new methods; promote accuracy through interlaboratory comparison of results; and provide the CDC with an assessment of laboratory practice and use of recom-mended drugs and drug concentrations. This program has con-tinuously operated as a voluntary and confidential assessment of performance in which participants receive biannual shipments of panels containing MTBC isolates. The CDC invited participation by all known clinical and public health laboratories in the United States that perform DST for MTBC using biosafety level 3 (BSL3)
or BSL2 with BSL3 practices. Based on other published reports (3) and data from the industry, the CDC was able to determine that most laboratories that performed MTBC DST were enrolled in this program throughout the 18-year existence of the program. (Personal communication with manufacturers, during a drug re-call by manufacturers in the year 2000, revealed that 120 labora-tories out of 128 laboralabora-tories were enrolled in the program. This number is not consistent, due to changes in the number of drug susceptibility testing laboratories that participate in the program. Currently, there are 100 laboratories enrolled in the program.) Here, we provide a statistical summary of results from the CDC’s MPEP for MTBC, 1994 to 2008. Although the fundamental pur-pose of the MPEP is to provide a quality assurance resource to drive internal improvement processes at each laboratory, an ag-gregate look provides broader understanding and allows compar-ison of performance of different methods, reproducibility of methods, and identification of challenging strains.
METHODS
The MPEP used a contracted laboratory partner to collect and subculture patient isolates, ship isolate panels, maintain a database of participant
Received28 November 2011Returned for modification27 December 2011 Accepted19 January 2012
Published ahead of print1 February 2012
Address correspondence to Pawan K. Angra, [email protected].
Copyright © 2012, American Society for Microbiology. All Rights Reserved.
doi:10.1128/JCM.06479-11
on May 16, 2020 by guest
http://jcm.asm.org/
laboratories, and enter participant test results into a database. The CDC corresponded with laboratories, selected the strains with the assistance of a committee of external experts, validated and analyzed the data, and produced the summary reports of aggregated data. Initially, participants submitted test results using a paper form and later via online entry.
Strain selection.All the MTBC strains used in MPEP were patient isolates provided either by an MPEP contracted partner laboratory from its diagnostic testing service or occasionally by a CDC national reference laboratory or laboratories participating on the strain selection committee. Strains were selected based on common trends and patterns of tubercu-losis drug resistance in the United States. Importantly, the strain selection committee had knowledge only of the test results provided by the tracted partner laboratory. Although isolates were retested by the con-tracted partner laboratory prior to subculture, isolates were not tested by other reference laboratories prior to shipment; therefore, there was no prior knowledge of expected interlaboratory agreement. The majority of the resistant isolates were resistant to only one of the first-line drugs, i.e., isoniazid (INH), rifampin (RMP), ethambutol (ETH), and pyrazinamide (PZA), or combinations of drug resistance other than those that included INH and RMP, except for two strains selected early on, due to potential participant concerns of working with multidrug resistance (MDR) iso-lates. Two panel shipments per year, each containing 3 to 5 clinical isolates on Lowenstein-Jensen (LJ) slants, were sent to 216 distinct U.S. laborato-ries which participated in the program and provided results for at least one shipment of isolates during this 15-year period. Six strains were sent as duplicate isolates in the same panel shipment, and seven strains were sent out as repeats in different shipments. There were a total of 94 unique MTBC strains sent to participant laboratories, and the distribution of drug resistance is shown in Table 1. A strain susceptible to the four first-line drugs was included in all panels. Few strains were also resistant to more than one drug in the same panel. For INH resistance, strains were selected that were resistant at different drug concentrations, i.e., low level and high level as defined by CLSI and 0.2g/ml and 1.0g/ml by the agar proportion (AP) method. Strains determined to have low-level resistance were resistant at the critical concentration of INH but susceptible at the additional, higher drug concentration that has been traditionally tested to provide therapeutic information. Low-level INH strains were included, as they represent the most prevalent drug resistance to TB in the United States and also because they present unique challenges to detection (19). Sequencing data for the majority of the strains were unavailable in the program, and therefore this is primarily an evaluation of phenotypic-based methods.
For each panel shipment, participants reported results as susceptible or resistant for each combination of isolate, method, drug, and drug con-centration. Participants also provided information on the type of labora-tory (e.g., hospital, independent, or public health), biosafety level used for MTBC DST, and annual test volume. The CDC analyzed results and pro-vided summary reports to all participant laboratories for each strain. The reports presented all participant results as aggregated data for every com-bination of strain, test method, drug, and drug concentration.
Partici-pants were not provided with reports of their individual performance and, therefore, assessed performance by comparing their own results with the aggregate results of all participants. The reports also provided some gen-eral commentary on performance and emphasized use of CLSI-recom-mended drug concentrations to be used for each method (20). Although routine reports provided results for all combinations of strain, test method, drug, and drug concentration, the current analyses report results using only CLSI-recommended testing methods (8, 20).
Analyses.Here, the general objective was to demonstrate interlabora-tory agreement on the 94 unique strains using recommended methods for the four primary antituberculosis drugs. Whenever a strain was sent in duplicate in the same panel, or repeated in a later panel, only the results for the first isolate were included in the analysis. For the purpose of these aggregate analyses, we defined resistance or susceptibility for each drug as the majority result of⬎50% for results reported by all participants that used the CLSI reference method. In addition, with rare exception, there was no information on the genotypic resistance. Using a simple majority to set the target acknowledges the imperfect nature of growth-based DST. The CLSI reference method for INH, RMP, and EMB is AP and for PZA it is Bactec. The CLSI recommends 7H10 and 7H11 as AP methods. Many laboratories use 7H11 based on published reports and experience from a few laboratories suggesting that 7H11 is a better method for fastidious MDR MTBC isolates (9). With two exceptions, almost all of the combi-nations of 94 unique strains and four drugs resulted in a majority result equivalent to the original, expected result provided by the contracted partner laboratory.
Each semiannual panel produced a data set consisting of records con-taining questionnaire results about the laboratory and records concon-taining the reported test results for each concentration-drug-method combina-tion for each strain. In general, a given laboratory reported only one con-centration-drug-method result for each strain, though there were reports from the same laboratory for agar proportion results plus either Bactec or MGIT for some strains in some years. Twenty-seven data sets for 15 years of panel results were merged into a common database, taking into account periodic reformatting of the semiannual questionnaire and incorporating (i) which strains represented duplicates or repeats and (ii) the expected results based on initial preshipment testing. As a further data manage-ment step and preanalytic step, strain-test combinations were noted in which the majority of laboratories reported a result differing from the initial preshipment expectation.
[image:2.585.41.545.79.181.2]The accumulated test results of susceptible or resistant strains form a binomial distribution with a presumed expectation of 100% but an ob-served expectation somewhat or even considerably lower, reflecting either normal experimental error or some “challenging” characteristic of a par-ticular strain. The challenging characteristic may reflect numeric proxim-ity of the strain’s MIC to the critical test concentration, but that assertion is not tested in this study. This characteristic, however, was presumed to occur very rarely. Hence, the analytical assumptions were that a strain was theoretically 100% resistant or susceptible or that a strain was “challeng-ing,” in which case resistance would be found by less than 100% of tests
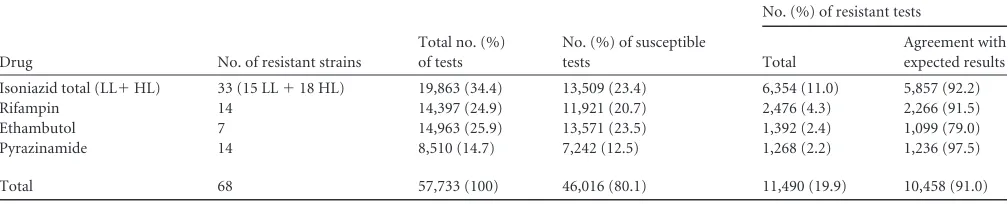
TABLE 1Numbers of drug susceptibility tests by drug and resulta
Drug No. of resistant strains
Total no. (%) of tests
No. (%) of susceptible tests
No. (%) of resistant tests
Total
Agreement with expected results Isoniazid total (LL⫹HL) 33 (15 LL⫹18 HL) 19,863 (34.4) 13,509 (23.4) 6,354 (11.0) 5,857 (92.2) Rifampin 14 14,397 (24.9) 11,921 (20.7) 2,476 (4.3) 2,266 (91.5) Ethambutol 7 14,963 (25.9) 13,571 (23.5) 1,392 (2.4) 1,099 (79.0) Pyrazinamide 14 8,510 (14.7) 7,242 (12.5) 1,268 (2.2) 1,236 (97.5) Total 68 57,733 (100) 46,016 (80.1) 11,490 (19.9) 10,458 (91.0)
a
The distribution of resistant or susceptible results by drug. Most results were susceptible since 4 drugs are tested for each strain and most strains were resistant to only one drug (or fully susceptible). There were fewer PZA results, since this drug is not recommended for testing with the AP method. LL, low-level resistance; HL, high-level resistance.
on May 16, 2020 by guest
http://jcm.asm.org/
consistently across laboratories and methods. Statistical tests of the equal-ity of either expectation (100% or less) across laboratories, types of labo-ratories, and methods were performed using Pearson’s chi-square or Fisher exact tests, dependent on the respective sample sizes.
To examine laboratory performance further, additional analyses were conducted to compare a laboratory’s annual test volume and different types of laboratories (e.g., health department, hospital, independent).
All database management and statistical tests were performed using SAS (Cary, NC) version 9.3, a fully validated software product for clinical trials and other regulatory applications.
RESULTS
Participating laboratories reported a total of 123,724 test results on 116 isolates. For first-line drugs, 65,542 results were reported that included tests for duplicate and repeated strains. For the pur-pose of these analyses, Table 1 shows that a total of 57,733 test results were performed for first-line drugs on 94 unique MTBC strains from 216 laboratories. Out of 94 unique strains, 68 strains were resistant; this included 15 low-level INH-resistant strains. Results were not included when not performed according to CLSI-recommended combinations of methods and drug concen-trations for the first-line drugs, second-line drugs, or nonstandard drugs. Table 1 demonstrates that most results were reported as susceptible, because four drugs are tested for each strain and most strains were resistant to only one drug (or susceptible to the four first-line drugs). There were fewer PZA results, because this drug is not recommended for testing with the AP method. The agree-ment rates for resistance to the four first-line drugs varied: INH, 92.2%; RMP, 91.5%; EMB, 79.0%; and PZA, 97.5%.
Table 2 shows the distribution of the results by test method and reflects that most participants used the recommended rapid method, which was Bactec for most of the period of this analysis. The agreement rates by methods for resistant strains were 91.3% for AP, 93.0% for Bactec, and 82.6% for MGIT.
Figure 1 shows the trends in laboratories reporting results by testing method and represents the number of laboratories report-ing results for the AP, Bactec, and MGIT methods over the course of the study period. These results demonstrate the gradual adop-tion of MGIT by the laboratories after FDA clearance of this assay in 2003. Some laboratories reported results for more than one method. Most laboratories reporting results for AP also reported results by Bactec or MGIT. Many referral laboratories, including state public health laboratories, maintain both the reference AP method in addition to a recommended rapid liquid culture and would use the MPEP to assess both test methods side by side for
each strain and therefore provided more than one set of results for each strain.
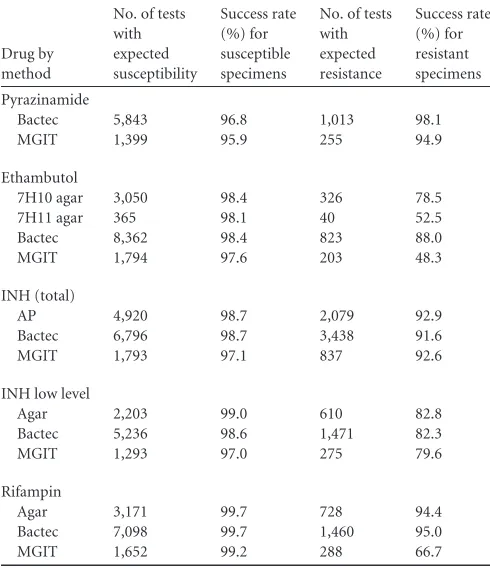
[image:3.585.302.541.67.215.2]Table 3 provides the success rate of detecting drug resistance or susceptibility as determined by the majority result for each drug. This table breaks down all of the results by aggregated participant results and whether each achieved the expected result for suscep-tibility or resistance for every combination of method and drug. Overall agreement with the expected result was 97.0% for INH,
TABLE 2Numbers of drug susceptibility tests by laboratory method and resulta
Method
Total no. (%) of tests
No. of resistant tests
Total Agreement (%) MGIT 8,221 (14.2) 1,583 1,307 (82.6) AP 14,679 (25.4) 3,173 2,896 (91.3) BACTEC 34,833 (60.3) 6,734 6,255 (93.0) Total 57,733 (100) 11,490 10,458 (91.0)
a
The distribution of results by methods from 1994 to 2008. Many laboratories reported results for more than one method for each unique strain. Close to 75% of results represent the recommended rapid methods (that are used to screen for resistance). The MGIT method was introduced in 2003. Overall, 91% resistant tests were in agreement of detecting resistance.
[image:3.585.41.286.88.170.2]FIG 1Trends in laboratories reporting results by testing method. Method use during the study, showing the adoption of MGIT since its inception in 2003 by the majority of laboratories. Some labs reported results for more than one method. (The majority of laboratories reporting results for AP also reported results for either Bactec or MGIT.)
TABLE 3Success rate of detecting drug resistance or susceptibility as determined by the majority result for each druga
Drug by method
No. of tests with expected susceptibility
Success rate (%) for susceptible specimens
No. of tests with expected resistance
Success rate (%) for resistant specimens Pyrazinamide
Bactec 5,843 96.8 1,013 98.1 MGIT 1,399 95.9 255 94.9 Ethambutol
7H10 agar 3,050 98.4 326 78.5 7H11 agar 365 98.1 40 52.5 Bactec 8,362 98.4 823 88.0 MGIT 1,794 97.6 203 48.3 INH (total)
AP 4,920 98.7 2,079 92.9 Bactec 6,796 98.7 3,438 91.6 MGIT 1,793 97.1 837 92.6 INH low level
Agar 2,203 99.0 610 82.8 Bactec 5,236 98.6 1,471 82.3 MGIT 1,293 97.0 275 79.6 Rifampin
Agar 3,171 99.7 728 94.4 Bactec 7,098 99.7 1,460 95.0 MGIT 1,652 99.2 288 66.7
a
Resistance or susceptibility for each drug is defined as the majority result of⬎50% reported by all participants that used the CLSI reference method.
on May 16, 2020 by guest
http://jcm.asm.org/
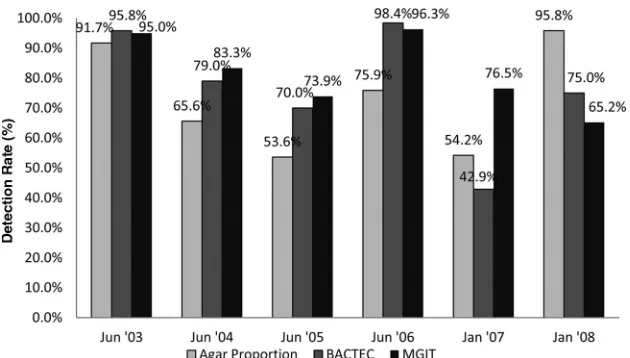
[image:3.585.298.543.423.707.2]RIF, EMB, and PZA by AP, Bactec, and MGIT methods. The abil-ity to detect susceptibilabil-ity is generally high (ⱖ95%) for all drug-method combinations, and the combined success rate among sus-ceptible strains was 98.4%. In our analysis, failure to detect resistance was more common than finding false resistance, and the combined success rate for detecting resistance among all methods was 91.0%. Table 3 divides the results for the combined detec-tion of all INH resistance and the results in specifically detect-ing INH resistance with the 15 strains exhibitdetect-ing low-level INH resistance. The overall detection of INH resistance, which was 92.9% by AP, 91.6% by Bactec, and 92.6% by MGIT, is skewed by the relatively easier detection of the 18 strains with high-level INH resistance that were detected with agreement rates of 99% by AP and 98% by Bactec and MGIT (data not shown). For low-level INH-resistant strains, the agreement rate dropped to 82.8% by AP, 82.3% by Bactec, and 79.6% by MGIT. The com-bined data indicate equivalent performance for INH by all three methods with both high-level and low-level resistant strains. However, when examining low-level INH-resistant strains, there is notable variation by each method. Figure 2 illustrates the proportion of participants detecting low-level INH resistance for each of the six low-level INH resistance strains for which results were available using each of the three methods during the study period. Although aggregate results indicate equivalency among the methods for these strains, there is significant variation in detection of individual strains by method.
Table 3 indicates some specific problems with detection of EMB resistance with the 7H11 and MGIT methods. Although there were fewer laboratories using 7H11, the results for EMB were distributed throughout the study period. In the case of MGIT, this decreased detection represents only a few strains in the last 5 years of the analysis; however, for these strains, the differ-ences in performance between 7H10, Bactec, and MGIT are sub-stantial. There was reduced detection of RMP resistance with the MGIT method, with a 66.7% agreement rate compared to 94.4% for AP and 95.0% for Bactec. These results were largely due to two RMP-resistant strains sent in June 2006 and June 2008 that re-sulted in substantial discordance between the methods, with
de-tection of RMP resistance at 69.7% for AP, 58.6% for Bactec, and 28.3% for the MGIT method for the June 2006 strain and 70.4% for AP, 41.7% for Bactec, and 18.8% for the MGIT method for the June 2008 strain. These two strains were later characterized as having rpoBmutations (His526Leu) that were documented by Van Deun et al. (26) and characterized by that group as having what was termed “borderline RMP resistance.” There was no prior knowledge of this particular level of resistance, however, and both strains were selected based on the pattern of resistance to RMP and susceptibility to INH among drugs tested.
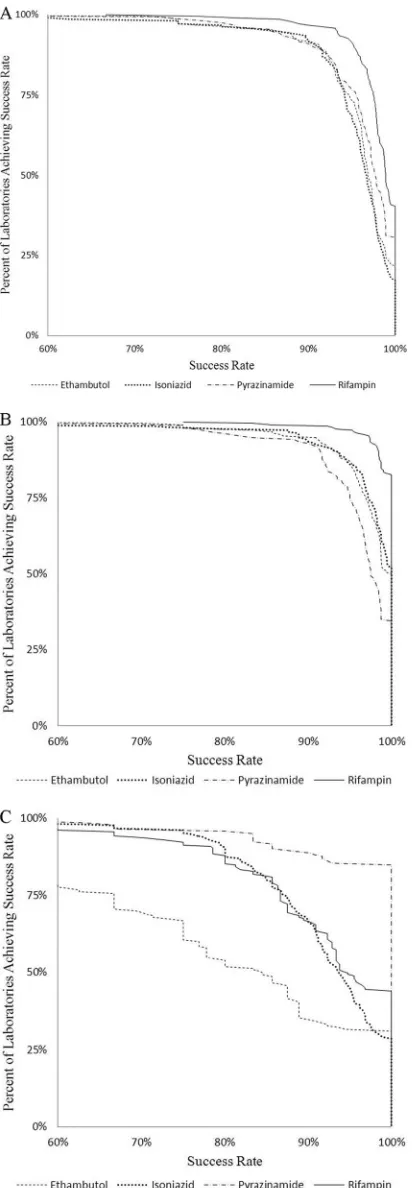
Figure 3 shows the percentage of laboratories achieving a given success rate for detection of resistance for each of the first-line drugs. Results are shown only for either of the recommended rapid liquid-culture methods because, unlike AP, the rapid meth-ods would be the methmeth-ods used to routinely test patient isolates for drug resistance. Although there are a few laboratories with lower performance for each drug, agreement in detecting resistance is distributed widely. There are lower agreement rates for detection of EMB resistance across a large proportion of the laboratories. There were fewer PZA-resistant strains included in the panels, and these presented less of a performance challenge in this program.
No significant difference in performance of testing was ob-served either by laboratory type (health department, hospital, in-dependent) or by test volume (range of 1 to 17,000 tests per year). Independent laboratories, health departments, and hospitals achieved 96.6%, 96.2%, and 95.8% success, respectively (analysis of variance [ANOVA], F-test,P⫽0.579); for susceptible speci-mens only, concordance rates were 97.8%, 97.8%, and 97.3%, respectively (P⫽0.596); for resistant specimens, concordance rates were 90.9%, 87.8%, and 88.2%, respectively (P⫽0.514). Annual test volume was divided into four groups: group 1 (⬍14 tests), group 2 (14 to 120 tests), group 3 (120 to 1,145 tests), and group 4 (⬎1,145 tests). Overall concordance was 95.2%, 96.2%, 96.4%, and 94.5% for the four groups, respectively (ANOVA, F-test,P⫽0.175). For susceptible specimens, concordance rates were 96.6%, 97.6%, 98.1%, and 96.1%, respectively (P⫽0.088). For resistant specimens, concordance rates were 89.3%, 89.3%, 87.7%, and 85.0%, respectively (P⫽0.458).
FIG 2Success rate for 6 strains with low-level INH resistance for which test results were available for all three methods. These selected strains demonstrate the variability in detecting low-level INH resistance among the methods. No one method was uniformly superior in detecting INH resistance.
on May 16, 2020 by guest
http://jcm.asm.org/
[image:4.585.135.450.64.243.2]DISCUSSION
The results of this analysis, though from a nonrandom sample, include those of most U.S. laboratories (explained earlier) per-forming TB drug susceptibility testing. Overall, we observed strong interlaboratory agreement for tests reported for a large col-lection of routine patient isolates that represent drug resistance prevalent in the United States. Analyses of the MPEP data provide a unique perspective on performance of DST for MTBC and allow measurement of interlaboratory concordance and variability for identical strains. Unlike many studies that evaluate performance of test methods in a few laboratories, the MPEP-participating lab-oratories represent the majority of clinical, independent, and pub-lic health laboratories that perform DST in the United States. Test results from a large number of laboratories not only provide in-formation on performance of different test methods but also dem-onstrate variation for some strains using the same methods.
The collective results demonstrate overall agreement of 97.0% for first-line drugs and adequate performance among methods and laboratories, especially for detecting drug susceptibility with 98.4% agreement. The high level of agreement in determining an isolate as drug susceptible is important for tuberculosis elimination in the United States. Detection of drug resistance is generally good, with 91.0% agreement, but performance varies for specific drugs, methods, and strains. Figure 3 demonstrates the success rate in detecting resistance among the resistant strains, susceptibility among susceptible strains, and resistance and susceptibility for all strains by all laboratories using rapid methods for the first-line drugs. The figure demonstrates that there is not a sharp boundary between laboratories in terms of performance but rather a continuum, with the majority of lab-oratories missing resistance in at least one or two strains and only a minority detecting resistance 100% of the time. This distribution of errors across the majority of laboratories indi-cates that they tend to be random rather than systematic.
Although most isolates chosen were resistant to only one drug among first-line drugs, the combined unique strains represented a collection of resistant strains that are relatively common in the United States (17). In the early years of MPEP, only two MDR MTBC isolates were included, but due to participant safety con-cerns, the procedure was amended shortly thereafter. Traditional proficiency testing programs often send isolates that are well char-acterized, have higher levels of drug resistance, and are therefore less challenging (10). Consequently, such programs are less likely to find variations in performance that may be encountered with routine patient strains. In this analysis, strains were not prese-lected based on prior knowledge of interlaboratory agreement or another process to exclude isolates that were known to be prob-lematic with certain methods. We identified routine patient strains for which there was substantial variation among laborato-ries in detecting resistance. Conceivably, the strains with low-level drug resistance have a MIC that is very close or equal to the CLSI-defined critical concentration for the drug being tested (1). These strains are termed “challenging strains,” as they pose variability in drug resistance detection. Methods can detect a high level of drug resistance due to greater difference in MIC and testing concentra-tions. However, for low-level drug resistance, the performance will be suboptimal due to the chance of not detecting drug resis-tance because of proximity of MIC to the critical concentration. Almost all laboratories had instances of discordance in detecting
FIG 3Percent of laboratories achieving success rate in detecting resistance among the resistant strains, susceptibility among susceptible strains, and re-sistance and susceptibility for all strains by all laboratories using rapid methods for the first-line drugs. Overall success rate for all unique strains (A), for sus-ceptible strains (B), and for resistant strains (C).
on May 16, 2020 by guest
http://jcm.asm.org/
[image:5.585.62.268.66.660.2]resistant strains, which provides important information on the inherent limitations of each combination of method, drug, and concentration for some strains. Use of duplicate and repeated strains reveals that there was consistent performance by methods and laboratories when the same strain was duplicated within the same panel or sent in a different panel (data not shown). When a strain was sent multiple times, there was reproducible perfor-mance for the percentage of laboratories detecting resistance with particular combinations of drugs and methods. Laboratory per-formance was independent of annual testing volume, and type of testing laboratories suggests that testing methods and techniques are numerous. In addition, Fig. 3 demonstrates that variation in detecting some forms of drug resistance is generally distributed across all laboratories. Given that the determination of resistance to each drug was defined as the majority result (i.e.,⬎50%), there was an expectation that laboratories might have a reproducible bias toward consistent results, either in agreement or disagree-ment, for resistant strains where the MIC is close to the critical concentration. We did not find any consistent patterns among the strains with variable discordance and conclude that all laborato-ries will have discordant results for some strains, presumably whenever the MIC is close to the critical concentration of the drug. The data provide some instances of suboptimal performance for three methods, but there were no conclusions about laboratory-related performance. The lack of data demonstrating any substan-tial laboratory-specific problems indicates that there is a high level of quality, with challenges limited to some combinations of meth-ods and drugs with selected strains.
Over the time period of this study, CLSI has recommended only liquid media, in Bactec and MGIT, as the testing methods for PZA. Fourteen PZA-resistant strains were included in the panels. There was 97.5% agreement in detecting the resistance, demon-strating that these strains presented less of a performance chal-lenge in this program.
Isoniazid.INH is a critical drug for tuberculosis treatment and for preventive therapy for those infected by, but not ill from, MTBC. Isolated INH resistance is the most frequently encoun-tered resistance pattern in the United States (6). For example, in 2008, 8.2% of all MTBC strains in the United States were resistant to INH, and only 1% were resistant to INH and RMP (i.e., MDR) (6). Laboratories reported lower agreement by all three methods, AP, Bactec, and MGIT, for 15 strains with low-level INH resis-tance. Isolates with low levels of resistance are common in the United States, although there are limited data on precise preva-lence. In 1999, the CDC tested 1,244 strains referred between Jan-uary 1996 to September 1998 for drug resistance and found 45.0% (86/191) low-level INH resistance among strains that were resis-tant only to INH and 24.9% (185/744) low-level INH resistance when strains were resistant to INH and additional drugs (19). In addition, the CDC supported a multicenter study on DST for MTBC and found 33.3% (44/132) of all INH-resistant isolates from four centers were low-level INH resistant (16). There may be significant regional differences in the prevalence of low-level INH-resistant strains, with this level of resistance rare in some parts of Europe (S. Ruesch Gerdes, personal communication). Many studies evaluating performance of specific methods or in-terlaboratory agreement include only strains with high-level INH resistance (18) or do not differentiate the level of resistance (19) when, as our data indicate, the inclusion of low-level INH-resis-tant strains might subsINH-resis-tantially influence results. Our analyses
clearly demonstrate reduced interlaboratory agreement when testing low-level INH-resistant strains and lead us to recommend that studies of INH resistance should specify if and when such strains are included. Laboratories should monitor their perfor-mance in detecting INH resistance and may consider periodic testing of a control strain with stable low-level INH resistance (18).
Rifampin.Detection of RMP resistance is generally adequate; however, there was substantially reduced detection of resistance for two strains that were selected due to the pattern of resistance. Van Deun et al. have described borderline resistance with strains exhibiting certain mutations (Asp516Tyr, Leu511Pro, Leu533Pro, His526Leu/Ser, Ile572Phe) in therpoBgene and further demon-strated reduced detection of these strains using liquid-culture methods, especially MGIT (26). Results reported here from the MPEP also demonstrate reduced detection by all methods, but this was especially pronounced for MGIT (28% and 19% of labo-ratories with two strains having the His526Leu mutation). Cur-rently, there are no data on the prevalence of these strains in the United States that would indicate a need to explore changing test-ing practices, but there are concerns that these resistant strains with this lower level of resistance might go undetected with the rapid liquid-culture methods (27).
Ethambutol.Reduced interlaboratory agreement in detection of EMB drug resistance has been documented (17). The analyses of the MPEP data demonstrate that the variability in detecting EMB resistance is well distributed with the substantial majority of laboratories, with disagreement on one to several strains with EMB resistance (Fig. 3). The lower performance for detecting EMB resistance was pronounced with the MGIT (48.3%) and 7H11 (52.5%) methods. The performance of MGIT with the MPEP strains led us to conclude that the current tested concen-tration of EMB (5.0g/ml) is not equivalent to the critical con-centration of drug initially established with LJ (2) and AP and later for Bactec (23). Given CLSI recommendations to test all four first-line antituberculosis drugs with FDA-cleared rapid liquid-culture methods (8), we propose that there should be further work to determine if a different EMB concentration in MGIT would im-prove agreement with the AP and Bactec methods (17). In addi-tion, the use of 7H11 agar compared poorly with 7H10 and Bactec methods; therefore, the current CLSI-recommended critical con-centration of EMB for 7H11 should be reestablished through fur-ther studies.
Limitations. There are a number of limitations impacting these analyses. As in any proficiency testing or external quality assessment program, the participants know they are being tested, so there is always the possibility that results may not reflect routine performance. In addition, these combined results represent per-formance over a period of 15 years and may be influenced by other factors in the manufacturing or testing process and changes in personnel, referral patterns, or other laboratory systems. The strains selected for MPEP, although not preselected for interlabo-ratory agreement, did not include MDR or other strains with re-sistance to more than one drug, which might have led to reduced or increased concordance in detecting resistance. Although we have results from 94 unique strains that include ones contributing to prevalent drug resistance in the United States, we cannot infer that these results are epidemiologically representative. In addi-tion, there were a few challenging strains, such as some with RMP resistance, for which we do not have data on prevalence. Lastly,
on May 16, 2020 by guest
http://jcm.asm.org/
MPEP was designed as a program to improve quality and assist laboratories in evaluating their performance. Therefore, the per-formance on these strains was not originally designed as part of a study.
Although not presented here, the greatest improvements in performance occur in the early years of performance testing pro-grams (24), when laboratories might detect and correct differ-ences in performance with other laboratories.
Conclusion.This was the first multiyear evaluation of MTBC DST inclusive of a large number of U.S. laboratories. We conclude that, with the exceptions noted in Discussion, the commercial assays provide consistent performance across a variety of labora-tories, and these results indicate a high level of quality control for the assay components and equipment. The data show that the performance across all laboratories (public or private and large or small) did not demonstrate any discernible patterns, suggesting that laboratory type was not linked to performance problems. The inability to clearly identify performance issues related to any par-ticular subset of laboratories indicate a high level of quality with challenges limited to some combinations of methods and drugs with selected strains. The data demonstrate generally successful results with only a few instances of suboptimal method perfor-mance. These were generally restricted to challenging strains with low-level resistance. These analyses demonstrated that common assay methods tend to have problems detecting resistance for low-level resistant strains. We found that specimens with low low-levels of resistance reveal much more about the methods’ performances and intermethod agreement. We suggest that, in the future, eval-uation programs should consider sending specimens with low lev-els of resistance more frequently, as this could be helpful to ensure equivalent performance among methods and laboratories.
ACKNOWLEDGMENTS
We sincerely thank all the participating laboratories in the program, strain selection committee members Nancy Warren, Barbara Elliott, and Wendy Gross, program project officers Bereneice Madison, Sandra Neil, Sharon Granade, and Suzette Brown, and statisticians and Web masters Ronald Fehd, Ryan McCormick, Jagdeep Bedi, and James Handsfield for their invaluable contributions to the program.
The findings and conclusions in this report are those of the authors and do not necessarily represent the official position of the Centers for Disease Control and Prevention, Department of Health and Human Ser-vices, or the U.S. government.
We have no conflicts of interest.
REFERENCES
1.Böttger E.2011. The ins and outs ofMycobacterium tuberculosisdrug susceptibility testing. Clin. Microbiol. Infect.17:1128 –1134.
2.Canetti G, et al.1963. Mycobacteria: laboratory methods for testing drug sensitivity and resistance. Bull. World Health Organ.29:565–578. 3.Centers for Disease Control and Prevention.1995. Laboratory practices
for diagnosis of tuberculosis—United States, 1994. Morb. Mortal. Wkly. Rep.44:587–590.
4.Centers for Disease Control and Prevention.1992. National action plan to combat multidrug-resistant tuberculosis. Morb. Mortal. Wkly. Rep. Recom. Rep.41:1– 48.
5.Centers for Disease Control and Prevention.2010. Reported tubercu-losis in the United States, 2009. U.S. Department of Health and Human Services, Atlanta, GA.
6.Centers for Disease Control and Prevention.2009. Trends in tubercu-losis—United States, 2008. Morb. Mortal. Wkly. Rep.58:249 –253.
7.Centers for Disease Control and Prevention.2011. Trends in tubercu-losis—United States, 2010. Morb. Mortal. Wkly. Rep.60:333–337. 8.Clinical and Laboratory Standards Institute.2011. Susceptibility testing
of Mycobacteria, Nocardia, and other aerobic actinomycetes; approved standard M24-A2, 2nd ed. CLSI, Wayne, PA.
9.Cohn ML, Waggoner RF, McClatchy JK.1968. The 7H11 medium for the cultivation of mycobacteria. Am. Rev. Respir. Dis.98:295–296. 10. Fattorini L, et al.2008. External quality control ofMycobacterium
tuber-culosisdrug susceptibility testing: results of two rounds in endemic coun-tries. Int. J. Tuberc. Lung Dis.12:214 –217.
11. Huebner RE, Good RC, Tokars JI.1993. Current practices in mycobac-teriology: results of a survey of state public health laboratories. J. Clin. Microbiol.31:771–775.
12. Laszlo A, Helbecque DM, Tostowaryk W.1987. Proficiency testing of conventional drug susceptibility tests ofMycobacterium tuberculosis. Can. J. Microbiol.33:1064 –1068.
13. Laszlo A, Rahman M, Espinal M, Raviglione M.2002. Quality assurance programme for drug susceptibility testing ofMycobacterium tuberculosis
in the WHO/IUATLD Supranational Reference Laboratory Network: five rounds of proficiency testing, 1994 –1998. Int. J. Tuberc. Lung Dis.6:748 – 756.
14. Laszlo A, Rahman M, Raviglione M, Bustreo F.1997. Quality assurance programme for drug susceptibility testing ofMycobacterium tuberculosis
in the WHO/IUATLD Supranational Laboratory Network: first round of proficiency testing. Int. J. Tuberc. Lung Dis.1:231–238.
15. Li Q, Wang X, He H. 2000. WHO sample survey on drug resistant tuberculosis in Zhejiang, China. Zhonghua jie he he hu xi za zhi23:718 – 721. (In Chinese.)
16. Madison B, et al.1999. Multicenter assessment of isoniazid susceptibility testing ofMycobacterium tuberculosiscomplex by BACTEC and agar pro-portion methods. Intersci. Conf. Antimicrob. Agents Chemother. (ICAAC). American Society for Microbiology, Washington, DC. 17. Madison B, et al.2002. Multicenter evaluation of ethambutol
suscepti-bility testing ofMycobacterium tuberculosisby agar proportion and radio-metric methods. J. Clin. Microbiol.40:3976 –3979.
18. Madison BM, et al.2004. Identification of aMycobacterium tuberculosis
strain with stable, low-level resistance to isoniazid. J. Clin. Microbiol.42: 1294 –1295.
19. Metchock B, Temporado BSD, Ridderhof J.1999. Frequency of “low-lovel” INH resistance in INH-resistant isolates ofMycobacterium tubercu-losiscomplex. American Society for Microbiology, Washington, DC. 20. National Committee on Clinical and Laboratory Standards.2003.
Sus-ceptibility testing of Mycobacteria, Nocardia, and other aerobic actinomy-cetes; approved standard M24-A. NCCLS, Wayne, PA.
21. Schon T, et al.2009. Evaluation of wild-type MIC distributions as a tool for determination of clinical breakpoints forMycobacterium tuberculosis. J. Antimicrob. Chemoth.64:786 –793.
22. Shulgina MV, Malakhov VN, Hoffner SE, Haile M, Wright A.2009. Results of the external quality assessment ofMycobacterium tuberculosis
drug susceptibility testing in Russia, 2005–2007. Int. J. Tuberc. Lung Dis.
13:1294 –1300.
23. Siddiqi SH, Hawkins JE, Laszlo A.1985. Interlaboratory drug suscepti-bility testing ofMycobacterium tuberculosisby a radiometric procedure and two conventional methods. J. Clin. Microbiol.22:919 –923. 24. Stull TM, Hearn TL, Hancock JS, Handsfield JH, Collins CL. 1998.
Variation in proficiency testing performance by testing site. JAMA279: 463– 467.
25. Tenover FC, et al.1993. The resurgence of tuberculosis: is your laboratory ready? J. Clin. Microbiol.31:767–770.
26. Van Deun A, et al.2009. Mycobacterium tuberculosis strains with highly discordant rifampin susceptibility test results. J. Clin. Microbiol.47:3501– 3506.
27. Van Deun A, Martin A, Palomino JC.2010. Diagnosis of drug-resistant tuberculosis: reliability and rapidity of detection. Int. J. Tuberc. Lung Dis.
14:131–140.
28. Woods GL, Witebsky FG.1993. Current status of mycobacterial testing in clinical laboratories—results of a questionnaire completed by participants in the College-of-American-Pathologists Mycobacteriology-E Survey. Arch. Pathol. Lab. Med.117:876 – 884.