0095-1137/09/$08.00⫹0 doi:10.1128/JCM.01497-08
Copyright © 2009, American Society for Microbiology. All Rights Reserved.
Changes in the
agr
Locus Affect Enteritis Caused by
Methicillin-Resistant
Staphylococcus aureus
䌤
Yoichi Sugiyama,
1* Kazuya Okii,
1Yoshiaki Murakami,
1Takashi Yokoyama,
1Yoshio Takesue,
2Hiroki Ohge,
1Taijiro Sueda,
1and Eiso Hiyama
3,4Department of Surgery, Division of Clinical Medical Science, Graduate School of Biomedical Sciences, Hiroshima University, Hiroshima,
Japan1; Division of Infection Control and Prevention, Hyogo College of Medicine, Nishinomiya, Japan2; Department of Biomedicine,
Division of Clinical Medical Science, Graduate School of Biomedical Science, Hiroshima, Japan3; and
Natural Science Center for Basic Research and Development, Hiroshima University, Hiroshima, Japan4
Received 4 August 2008/Returned for modification 7 October 2008/Accepted 2 March 2009
We studied the characteristics of methicillin (meticillin)-resistantStaphylococcus aureus(MRSA) strains that caused enteritis. In a previous report, we demonstrated that both phenotypic and genotypic changes were associated with MRSA enteritis; and we hypothesized that the accessory gene regulator (agr), which is a global regulator of staphylococcal virulence and upregulates several exoproteins, is the key factor associated with the development of MRSA enteritis. In this study, we examined 12 MRSA isolates associated with enteritis from stool samples and 17 MRSA isolates not associated with enteritis that had the following characteristics: the strains associated with enteritis had the same genotype (genotype A), as detected by pulsed-field gel electro-phoresis, or the strains were isolated from stools. The differences between strains that caused enteritis and those that did not cause enteritis strains were examined by quantitative reverse transcription-PCR to assess RNAII,agrA, RNAIII, andtstexpression and by sequencing of theagrlocus. The levels of expression ofagrA, RNAIII, andtstwere higher by the MRSA isolates associated with enteritis than by the MRSA isolates not associated with enteritis, whether or not they were of the same genotype. The levels of expression of RNAII by almost all the clinical isolates were similar. Sequencing of theagrlocus showed that all MRSA isolates that caused enteritis have agr mutations, whereas the MRSA isolates that did not cause enteritis, with three exceptions, did not. Many of the isolates associated with enteritis had the same mutation, especially at the C-terminal end ofagrA. These results suggest a trend in which mutations in theagrlocus modify the expression ofagrAand RNAIII and the production of toxin, all of which may increase the virulence and influence the occurrence of MRSA enteritis.
Severe postsurgical enteritis caused by methicillin (meticil-lin)-resistantStaphylococcus aureus(MRSA) (MRSA enteritis) was prevalent in Japan in the early 1990s. In the late 1990s, most patients with MRSA enteritis were successfully treated with vancomycin, and the number of cases with MRSA enter-itis gradually decreased, but whenever it occurred, it was as-sociated with a severe clinical course and, occasionally, death (12, 28).
Several studies have discussed the characteristics of isolates causing MRSA enteritis. Staphylococcal enterotoxin typing, coagulase typing, and toxic shock syndrome toxin 1 (TSST-1) titers are used as markers of MRSA enteritis (10, 30, 31). Many studies have described the phenotypes of isolates that cause enteritis, but there have been only a few reports on the genomic analysis of MRSA strains that cause enteritis (36). Our laboratory has studied the molecular epidemiology of MRSA enteritis strains by using pulsed-field gel electrophore-sis (PFGE) and other methodologies for more than three de-cades. Our work has provided evidence that the disappearance of MRSA enteritis may have resulted from the decreased
in-cidence of enteritis-causing clones (21). We also found that among isolates with the same genotype, as determined by PFGE, some caused enteritis, whereas others did not. This indicates that not only differences in the genotypes determined by PFGE but also differences in phenotypes are important factors associated with the development of MRSA enteritis.
The accessory gene regulator (agr) is a global regulator of staphylococcal virulence and other accessory gene functions and is important in coordinating the expression of many gene products required for invasive infection (5). It suppresses the expression of surface proteins and upregulates the expression of several exoproteins (16, 24, 25). Theagrlocus encodes two divergently transcribed transcripts, RNAII and RNAIII. RNAII is a polycistronic transcript that encodesagrB, agrD,
agrC, andagrA. The protein encoded byagrDis a propeptide that matures into an autoinducing peptide. This process is carried out with the aid of the protein encoded byagrB. The protein encoded byagrCis the receptor of the autoinducing peptide and the sensor of the system, whereas the protein encoded byagrAis a response regulator. These two proteins form a two-component signal transduction pathway that up-regulates the synthesis of RNAIII (17). RNAIII mediates the downregulation of the synthesis of cell-wall-associated proteins and the upregulation of exoproteins, including enterotoxins, TSST-1, and Panton-Valentine leukocidin (1, 25, 37).
agrpromoter activation is proportional to the level of active protein encoded byagrAand the ability of the protein encoded * Corresponding author. Mailing address: Department of Surgery,
Division of Clinical Medical Science, Graduate School of Biomedical Sciences, Hiroshima University, 1-2-3 Kasumi, Minami-ku, Hiroshima 734-8551, Japan. Phone: 81-82-257-5216. Fax: 81-82-257-5219. E-mail: [email protected].
䌤Published ahead of print on 18 March 2009.
1528
on May 16, 2020 by guest
http://jcm.asm.org/
byagrAto bind to the promoters (33). Because the transcrip-tion of RNAIII is increased in proportranscrip-tion to the concentratranscrip-tion of the protein encoded by agrA, the level of active protein encoded byagrAinfluences the activation of RNAIII and the subsequent virulence of MRSA (11).
Polymorphism of theagrlocus also results in specific differ-ences in the sequdiffer-ences encodingagrB,agrD, andagrC; and this polymorphism causes bacterial interference (8). Variations in the protein encoded by agrA at the amino acid level may provide for variation in the activity of the protein encoded by
agrAbeyond that of the consensus activities of four interfer-ence groups, and small phenotypic differinterfer-ences encoded by dif-ferentagrAalleles might be selectable into larger evolutionary differences (27).
MRSA enteritis has been associated with gastrectomy and the administration of antibiotic agents, and it has been postu-lated that the use of broad-spectrum antibiotics following gas-trectomy allows the colonization and the subsequent over-growth of MRSA isolates that may produce enteritis-causing toxins (29). Other triggers causing enteritis are not well under-stood. TSST-1 and staphylococcal enterotoxins are known to be bacterial superantigens that strongly activate T cells and that produce cytokines, such as interleukin-2, gamma inter-feron, and tumor necrosis factor.
Thus, macrophages play a critical role in a mouse model of postoperative MRSA enteritis (32), and interleukin-15 may be associated with the pathogenesis of postoperative MRSA teritis (14). The production of TSST-1 and staphylococcal en-terotoxin is thought to be associated with the occurrence of MRSA enteritis (10). The mechanism of their production is complicated, but it seems clear that the production of these enterotoxins and the virulence of the MRSA strains are con-trolled by theagrlocus (23, 25, 37).
The aim of the study described here was to assess the dif-ferences in the levels of expression ofagrA-associated proteins and to examine the role of theagrlocus in the pathogenesis of MRSA enteritis. For this purpose, we compared the levels of expression of RNAII, RNAIII,agrA, andtstusing quantitative reverse transcription-PCR (RT-PCR) and analyzed MRSA isolates causing enteritis and those not causing enteritis for the production of TSST-1. In addition, we sequenced theagrlocus to study the relationship between mutationsin the agr locus, the levels of expression ofagrA, and MRSA enteritis.
MATERIALS AND METHODS
Bacterial strains and culture conditions.A total of 198 MRSA strains were obtained from the surgical ward at Hiroshima University Hospital. Twelve strains were isolated from stools from 12 different patients with MRSA enteritis be-tween 1990 and 1993, when MRSA enteritis was prevalent. A total of 186 strains were isolated from stools, sputum samples, drains, pus, and pleural fluid between 1998 and 2002 from patients who did not develop MRSA enteritis (nonenteritis strains). For this study, we examined the 12 strains associated with MRSA enteritis and 17 nonenteritis isolates that had the following characteristics: the strains associated with enteritis had the same genotype (genotype A), as deter-mined by PFGE, or the strains were isolated from stools. A total of 29 isolates
were used in this study. They had been stored at⫺80°C until use. Stock cultures
were passaged on brain heart infusion (BHI) agar (Nissui, Tokyo, Japan), and selected single colonies were grown in BHI broth at 37°C for 24 h. The
concen-tration of each culture was standardized to 1⫻108
CFU/ml by using the absorbance correlated with standard colony counts. The bacterial cultures were
stored at⫺80°C until use.
Assay for TSST-1.All isolates were cultured as described above and were
centrifuged at 3,000⫻gfor 30 min, and the supernatant was assayed for TSST-1
as described previously (21). A reverse passive latex agglutination (RPLA) test kit was used to detect TSST-1, according to the manufacturer’s instructions (Denka Seiken Co., Tokyo, Japan). To determine the TSST-1 titers, supernatants were tested in twofold serial dilutions ranging from 1:2 to 1:1,024.
RNA isolation and cDNA synthesis.Total RNA samples were prepared by using an RNeasy midikit (Qiagen GmbH, Hilden, Germany), according to the manufacturer’s instructions. Extracted total RNA samples were treated with
DNase I on RNeasy columns and were finally dissolved in 60l of RNase-free
water. The extracted RNA samples were analyzed with an RNA 6000 Nano Chip kit (Agilent Technologies, Santa Clara, CA). cDNA was synthesized with a high-capacity cDNA Archive kit (Applied Biosystems, Foster City, CA), accord-ing to the manufacturer’s instructions. The reaction mixtures were incubated first at 25°C for 10 min and then at 37°C for 120 min. The products were stored at
⫺20°C until use.
Quantitative real-time PCR conditions.Gene quantification was performed with an ABI Prism 7900 HT instrument (Applied Biosystems). cDNA was diluted
10-fold with water for use for real-time PCR. With the exception of agrA,
quantitative PCR was performed with 1l of cDNA, 10l of Sybr green PCR
master mixture (Applied Biosystems), and 5M each of the forward and the
reverse primers (Table 1) (2, 3) in a final volume of 20l. For the quantification
ofagrA, PCR was performed with 2l of cDNA, 10l of TaqMan universal
master mix (Applied Biosystems), 10M each of the forward and the reverse
primers, and Universal ProbeLibrary probes (Roche Diagnostics, Mannheim,
Germany) in a final volume of 20l. The probe and the primer specific foragrA
(Table 1) were selected by using the system of the Universal ProbeLibrary (Roche Diagnostics). The thermal cycling programs consisted of 2 min at 50°C and 10 min at 95°C, followed by 40 cycles of 15 s at 95°C and 1 min at 60°C. The specificity of the PCR was verified by ethidium bromide staining on 2% agarose gels.
Quantitative real-time PCR data analysis.Fluorescence emission was de-tected with an ABI Prism 7900 sequence detection system (Applied Biosystems) and was analyzed with Sequence Detector software (version 1.7; Applied Bio-systems). The levels of expression of the target genes in the RNA samples extracted from the different strains were normalized on the basis of internal
standards (16S rRNA and the guanylate kinase gene [gmk]). Standard curves for
the sequences were generated by using 10-fold serial dilutions of the specific standard, strain N315. A negative control (distilled water) and a standard dilu-tion that permitted gene quantificadilu-tion with the supplied software, according to the manufacturer’s instructions, were included in each run. For each RNA sample, the measurement of gene expression with the entire experiment was performed twice, and the results for biological replicates were compared. The mean of these values was used for further analysis.
Bacterial DNA lysates and amplification of theagrlocus.Genomic DNA was extracted by using a lysis buffer and 20 U lysostaphin (Wako Pure Chemical Industries, Ltd., Osaka, Japan). After incubation at 37°C for 30 min, 0.1%
sodium dodecyl sulfate and 0.3g of proteinase K were added and the samples
were then incubated at 56°C for 60 min. Proteinase K was denatured by heating it at 95°C for 10 min. Samples were extracted with an equal volume of a mixture of phenol-chloroform-isoamyl alcohol (25:24:1), and the aqueous phase was diluted with distilled water. The DNA template was quantified with a NanoDrop ND-1000 spectrophotometer (Thermo Fishers Scientific, Wilmington, DE) be-fore use in the PCR.
In order to amplify the variable region of theagrgene by PCR, we used a nested
PCR (18). The nucleotide coordinates of the primers were derived from the
se-quence of theagrlocus ofS. aureus agrgroup II strain N315 (GenBank accession
number AP003135). The first primer pair was 5⬘-ACCAGTTTGCCACGTATCTC
A-3⬘and 5⬘-AACCACGACCTTCACCTTTAGTAG-3⬘. The nested primer pair
was 5⬘-TGCCACGTATCTTCAAA-3⬘ and 5⬘-ATAATCATGACGGAACTT-3⬘.
The first PCR was performed with 50-l volumes containing 1l of genomic DNA,
KOD-Plus enzyme solution (Toyobo, Osaka, Japan), and 50 pmol each of the
forward and the reverse primers. For the nested PCR amplification, 1l of the first
PCR product was added as the template to the PCR mixture containing the same components described above, except that the nested primers were used instead of the first set of primers. Thermal cycling was performed in a PC-800 programmed temperature control system (Astec, Fukuoka, Japan) and consisted of 30 cycles of denaturation (94°C, 15 s), annealing (for the first PCR, 59°C for 30 s; for the nested PCR, 52°C for 30 s), and extension (68°C, 90 s). The PCR product was verified by ethidium bromide staining using a 1.15% agarose gel containing Synergel powder (Diversified Biotech, Boston, MA).
Cloning and sequence analysis ofagrlocus variants.The products of the
nested PCR and theagrAproducts were electrophoresed, and the DNA bands
on May 16, 2020 by guest
http://jcm.asm.org/
were excised from the agarose gel. The PCR products in the bands were purified with a Qiaex II gel extraction kit (Qiagen, Hilden, Germany). The purified PCR
products were cloned into competentEscherichia coliJM109 cells with the
pGEM-T vector system (Promega, Madison, WI). The recombinants were screened by PCR with primers T7 and SP6 to check the sizes of the inserts. The plasmid DNA was purified with the reagents provided with the QIAprep spin miniprep kit (Qiagen, Valencia, CA). The sequencing reactions were carried out with a BigDye Terminator (version 1.1) cycle sequencing kit (Applied
Biosys-tems). The sequencing reaction mixture contained 8l of BigDye Terminator
ready reaction mix, 3.2 pmol of sequencing primer (Table 1), and 8l of purified
PCR product in a total volume of 20l. The PCR thermal cycling program was
performed according to the manufacturer’s instructions. The sequencing prod-ucts were purified with CentriSep spin columns (Princeton, Adelphia, NJ) and were then prepared to be run on an ABI 3100 Avant genetic analyzer (Applied Biosystems), according to the manufacturer’s instructions.
Statistical analysis.The statistical significance of pairwise differences in the
levels of expression of RNAII,agrA, RNAIII,tst, and TSST-1 was evaluated by
the Mann-Whitney test; and the significance for isolates of the same genotype
was evaluated by Student’sttest. The frequency of anagrlocus mutation in
enteritis and nonenteritis strains was statistically evaluated by the Fisher exact
test. Data were considered significant whenPvalues were⬍0.05.
RESULTS
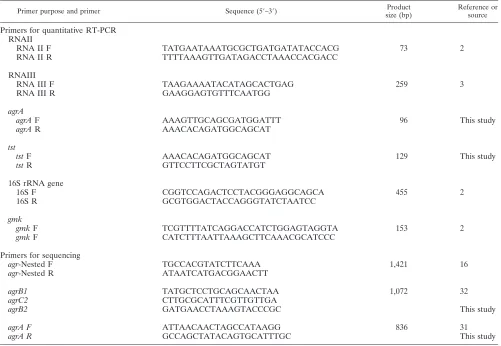
Quantitative RT-PCR analysis of RNAII,agrA, RNAIII, and tst. (i) RNAII expression.All of the isolates were positive for RNAII expression, and there was no statistically significant difference in the levels of expression of RNAII between the enteritis and the nonenteritis isolates (Fig. 1). In addition to
16S rRNA, we also used gmk as an internal standard. The RNAII expression levels evaluated by usinggmkas the internal standard were also not statistically significantly different (data not shown).
(ii) agrA expression. A total of 27 isolates (93.1%) were positive foragrAmRNA expression. All enteritis isolates were positive foragrAexpression, and there was a significant differ-ence in the levels of expression ofagrA between the enteritis and the nonenteritis isolates (Fig. 1). The lowest level of ex-pression ofagrAamong the enteritis isolates was 4.1 (MRSA strain 3895), but only one nonenteritis isolate had a level of
agrAexpression of greater than 4.1. TheagrA-negative isolates (n⫽2) were negative fortstexpression and showed no pro-duction of TSST-1.
(iii) RNAIII expression. A total of 28 isolates (96.6%) were positive for RNAIII expression. All of the enteritis isolates were RNAIII positive, and there was a significant difference in the levels of expression of RNAIII between the enteritis iso-lates and the nonenteritis isoiso-lates (Fig. 1). Among the nonen-teritis isolates, only one isolate (MRSA isolate 0015) expressed RNAIII at a high level. However, this isolate was negative for
agrAandtstexpression and showed no production of TSST-1.
[image:3.585.43.544.81.427.2]tstexpression. A total of 26 isolates (89.7%) were positive fortstexpression. The level of expression oftstwas statistically significantly different between the enteritis isolates and the TABLE 1. Primers used in this study
Primer purpose and primer Sequence (5⬘–3⬘) Product
size (bp)
Reference or source
Primers for quantitative RT-PCR RNAII
RNA II F TATGAATAAATGCGCTGATGATATACCACG 73 2
RNA II R TTTTAAAGTTGATAGACCTAAACCACGACC
RNAIII
RNA III F TAAGAAAATACATAGCACTGAG 259 3
RNA III R GAAGGAGTGTTTCAATGG
agrA
agrAF AAAGTTGCAGCGATGGATTT 96 This study
agrAR AAACACAGATGGCAGCAT
tst
tstF AAACACAGATGGCAGCAT 129 This study
tstR GTTCCTTCGCTAGTATGT
16S rRNA gene
16S F CGGTCCAGACTCCTACGGGAGGCAGCA 455 2
16S R GCGTGGACTACCAGGGTATCTAATCC
gmk
gmkF TCGTTTTATCAGGACCATCTGGAGTAGGTA 153 2
gmkF CATCTTTAATTAAAGCTTCAAACGCATCCC
Primers for sequencing
agr-Nested F TGCCACGTATCTTCAAA 1,421 16
agr-Nested R ATAATCATGACGGAACTT
agrB1 TATGCTCCTGCAGCAACTAA 1,072 32
agrC2 CTTGCGCATTTCGTTGTTGA
agrB2 GATGAACCTAAAGTACCCGC This study
agrA F ATTAACAACTAGCCATAAGG 836 31
agrA R GCCAGCTATACAGTGCATTTGC This study
on May 16, 2020 by guest
http://jcm.asm.org/
nonenteritis isolates (Fig. 1). Among the enteritis isolates, only one isolate (MRSA isolate 3992) was negative fortst expres-sion. Among the nonenteritis isolates, two isolates were nega-tive fortstexpression, and these isolates were also negative for
agrAexpression.
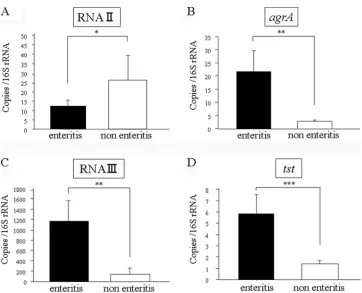
Sequences andagrgrouping.We sequenced the most vari-able region ofagrBDCandagrAfor all 29 clinical isolates. To confirm the presence of mutations, we sequenced theagrlocus and compared it with the published sequence for strain N315 (13). Among the enteritis isolates, all isolates had mutations in either one of the two genes, whereas only 3 of 17 (18%) nonenteritis isolates had mutations (2⫽16.1;P⬍0.001). The
mutations in agrA detected among the enteritis isolates are summarized as follows: there was a run of seven adenines at the C-terminal end, but many of the enteritis isolates had nine adenines, owing to the substitution of an A for a T; MRSA strain 3980 demonstrated a point mutation that converted an amino acid from a serine to a tyrosine; and MRSA strain 3992 demonstrated a point mutation that converted an amino acid from a lysine to an arginine. The mutations inagrBDCdetected among the enteritis isolates are summarized as follows: strain MRSA 3992 belonged to agrgroup I, which means that the sequence of itsagrlocus was very different from the sequence of the agr locus in strain N315; MRSA strain 3895 demon-strated a point mutation inagrDthat converted an amino acid of theagrDprotein from a phenylalanine to a leucine; MRSA strain 3936 demonstrated a frameshift mutation in agrC; MRSA strains 3980, 5070, and 5083 demonstrated mutations in
agrB; MRSA strains 3980 and 5083 demonstrated frameshift mutations in agrB; MRSA strain 5070 demonstrated a point mutation that converted an amino acid of the protein encoded byagrBfrom a glycine to an arginine; MRSA strain 0641, the only nonenteritis isolate with mutations inagr, demonstrated many point mutations in agrB and agrC, with 4 amino acid changes in the protein encoded byagr. The characteristics of these mutations are shown in Fig. 2.
Theagrgroups of the isolates were examined, and the pub-lished sequence of N315 revealed that it belongs toagrgroup II. Theagr sequences of almost all isolates examined in this study were identical to the agr sequence of N315 and to a previously published agr group II DNA sequence. Only two isolates (MRSA strain 3992 and one nonenteritis isolate) had sequences concordant with an agr group I DNA sequence (GenBank accession number AJ617708) (4).
The characteristics of all strains are summarized in Table 2. All enteritis isolates except strain 3992 showed high levels oftst
expression and TSST-1 production, resulting in a significant difference in the levels of production of TSST-1 between en-teritis and nonenen-teritis isolates (P⫽0.037). Strain 3992, which belonged toagrgroup I, had high levels of expression ofagrA
[image:4.585.111.473.63.356.2]and RNAIII, but it was negative fortstexpression and TSST-1 production. All enteritis isolates except strains 3895 and 3992 had equivalent, high levels ofagrAandtstexpression; but the levels of RNAIII expression varied, and the levels of RNAIII expression correlated with TSST-1 production.
FIG. 1. Levels of expression of RNAII (A),agrA(B), RNAIII (C), andtst(D) by enteritis isolates compared to those by nonenteritis isolates, as determined by real-time RT-PCR with an ABI Prism 7900 sequence detection system. Transcripts were quantified with reference to the level of transcription of 16S rRNA. The results are the means of two experiments and are presented as means⫾standard errors of the means.ⴱ, not significant;ⴱⴱ,P⬍0.01;ⴱⴱⴱ,P⬍0.05.
on May 16, 2020 by guest
http://jcm.asm.org/
Characteristics of PFGE type A isolates (same genotype).In our previous study (21), we detected enteritis isolates of the same genotypes up to 8 years after the first outbreak of MRSA enteritis. These isolates belonged to PFGE type A (the one type that caused MRSA enteritis) but did not cause enteritis. In this study there were a total of 10 PFGE type A isolates. These comprised three enteritis isolates and seven nonenteritis isolates.
In this study we examined the PFGE type A isolates for their
agrgroup, mutations in theagrgene, and gene expression using quantitative RT-PCR analysis and the RPLA test for TSST-1 expression. The results are displayed in Table 2. Sequence analysis revealed that all PFGE type A isolates belong toagr
group II. All PFGE type A enteritis isolates hadagrBDC mu-tations, whereas none of the nonenteritis isolates except MRSA strain 0641 did. There was no nine-adenine mutation in
PFGE type A enteritis isolates, even though that mutation was present in most enteritis isolates.
The levels of expression of RNAIII, agrA, and tst by the enteritis isolates tended to be higher than those by the nonen-teritis isolates, even isolates of the same genotype.
RPLA tests of these isolates revealed that they all produced TSST-1. The enteritis isolates produced higher levels of TSST-1 than the nonenteritis isolates except for MRSA strains 0009 and 1372. MRSA strain 0641, which was the only nonen-teritis isolate with agrBDC mutations, produced the lowest level of TSST-1.
DISCUSSION
[image:5.585.70.517.69.502.2]In the present study, we have shown that the levels of ex-pression ofagrA, RNAIII, andtstin MRSA enteritis isolates FIG. 2. Partial sequences ofagrBDCandagrAin strain N315 and enteritis isolates with a mutation in theagrlocus. The amino acid sequence of strain N315 (GenBank accession number AP003135) is shown on a shaded background, and mutations are on a white background.
on May 16, 2020 by guest
http://jcm.asm.org/
were higher than those in MRSA nonenteritis isolates; and these differences in the levels of expression persisted, even though the isolates had the same genotype. Surprisingly, there was little difference in the levels of RNAII expression among almost all the clinical isolates. The most likely explanation is that changes during the process of encodingagrB,agrD,agrC, andagrAcaused differences inagrAexpression levels. Indeed, our study revealed that all of the isolates causing MRSA en-teritis had mutations inagr, but among the nonenteritis iso-lates, with the exception of three isoiso-lates, there were noagr
mutations. Many of enteritis isolates had same mutation, es-pecially at the C-terminal end of agrA. This result shows a trend in which mutations in theagrlocus influence the levels of expression ofagrAand correlate with the occurrence of MRSA enteritis.
There is no proof of a direct relationship between an agr
group type and a specific infectious disease caused byS. aureus
in humans, but some investigators have reported on such re-lationships (6, 7, 19). Some methicillin-sensitiveStaphylococcus
aureusstrains causing specific syndromes have been linked to
certain agr types: staphylococcal scalded skin syndrome and generalized exfoliative syndromes have been associated with
agrgroup IV (6). The strains causing endocarditis belong toagr
groups I and II (7). Some investigators have reported thatagr
group II strains are more commonly identified among health care facility-associated MRSA strains (19). Our study results are compatible with those presented in that report, but almost
all the clinical isolates in our study belonged toagrgroup II, so
agrgroup II does not seem to be exclusively associated with MRSA enteritis.
Many studies have suggested that RNAIII is theagr-specific effector of exoprotein gene regulation inStaphylococcus aureus
(20). The increase in the concentration ofagrA leads to the transcription of RNAIII and the subsequent upregulation of RNAIII-mediated virulence responses (11). Thus, we specu-late that increased levels of expression ofagrAare associated with toxin production, causing MRSA enteritis. The results of the present study indicate that the levels of expression ofagrA
correlate with the levels of expression of RNAIII and TSST-1 production, which were associated with MRSA enteritis. This tendency was observed even among isolates of the same geno-type.
In addition, there is convincing evidence that theagrlocus demonstrates polymorphism, and variation in theagrlocus is related to differences in the activation of strains (8, 15, 18, 22, 34). Therefore, polymorphism in the agrlocus may result in specific differences in theagrB-,agrD-, andagrC-encoding se-quences, which influence the downstream region of the agr
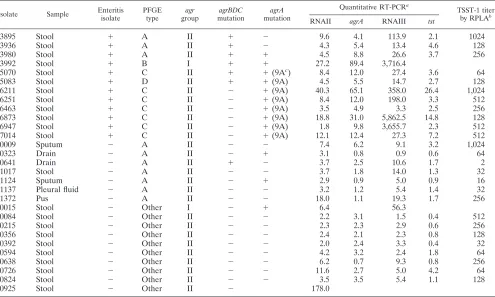
[image:6.585.46.541.81.378.2]locus and change the level of expression ofagrA. In this study, the level of expression of agrA was significantly different in enteritis isolates from that in nonenteritis isolates, but there was little difference in the RNAII expression levels between the two types of isolates. All of the enteritis isolates also had mutations in theagrlocus, whereas the nonenteritis isolates did TABLE 2. Characteristics of all clinical isolates (enteritis and nonenteritis)
Isolate Sample Enteritis
isolate
PFGE type
agr
group
agrBDC
mutation
agrA
mutation
Quantitative RT-PCRa
TSST-1 titer
by RPLAb
RNAII agrA RNAIII tst
3895 Stool ⫹ A II ⫹ ⫺ 9.6 4.1 113.9 2.1 1024
3936 Stool ⫹ A II ⫹ ⫺ 4.3 5.4 13.4 4.6 128
3980 Stool ⫹ A II ⫹ ⫹ 4.5 8.8 26.6 3.7 256
3992 Stool ⫹ B I ⫹ ⫹ 27.2 89.4 3,716.4
5070 Stool ⫹ C II ⫹ ⫹(9Ac) 8.4 12.0 27.4 3.6 64
5083 Stool ⫹ D II ⫹ ⫹(9A) 4.5 5.5 14.7 2.7 128
6211 Stool ⫹ C II ⫺ ⫹(9A) 40.3 65.1 358.0 26.4 1,024
6251 Stool ⫹ C II ⫺ ⫹(9A) 8.4 12.0 198.0 3.3 512
6463 Stool ⫹ C II ⫺ ⫹(9A) 3.5 4.9 3.3 2.5 256
6873 Stool ⫹ C II ⫺ ⫹(9A) 18.8 31.0 5,862.5 14.8 128
6947 Stool ⫹ C II ⫺ ⫹(9A) 1.8 9.8 3,655.7 2.3 512
7014 Stool ⫹ C II ⫺ ⫹(9A) 12.1 12.4 27.3 7.2 512
0009 Sputum ⫺ A II ⫺ ⫺ 7.4 6.2 9.1 3.2 1,024
0323 Drain ⫺ A II ⫺ ⫹ 3.1 0.8 0.9 0.6 64
0641 Drain ⫺ A II ⫹ ⫺ 3.7 2.5 10.6 1.7 2
1017 Stool ⫺ A II ⫺ ⫺ 3.7 1.8 14.0 1.3 32
1124 Sputum ⫺ A II ⫺ ⫹ 2.9 0.9 5.0 0.9 16
1137 Pleural fluid ⫺ A II ⫺ ⫺ 3.2 1.2 5.4 1.4 32
1372 Pus ⫺ A II ⫺ ⫺ 18.0 1.1 19.3 1.7 256
0015 Stool ⫺ Other I ⫺ ⫹ 6.4 56.3
0084 Stool ⫺ Other II ⫺ ⫺ 2.2 3.1 1.5 0.4 512
0215 Stool ⫺ Other II ⫺ ⫺ 2.3 2.3 2.9 0.6 256
0356 Stool ⫺ Other II ⫺ ⫺ 2.4 2.1 2.3 0.8 128
0392 Stool ⫺ Other II ⫺ ⫺ 2.0 2.4 3.3 0.4 32
0594 Stool ⫺ Other II ⫺ ⫺ 4.2 3.2 2.4 1.8 64
0638 Stool ⫺ Other II ⫺ ⫺ 6.2 0.7 9.3 0.8 256
0726 Stool ⫺ Other II ⫺ ⫺ 11.6 2.7 5.0 4.2 64
0824 Stool ⫺ Other II ⫺ ⫺ 3.5 3.5 5.4 1.1 128
0925 Stool ⫺ Other II ⫺ 178.0
aQuantities are normalized on the basis of 16S rRNA as the internal standard.
bThe TSST-1 titers were tested in serial dilutions ranging from 1:2 to 1:1,024. The data represent the inverse dilution.
c9A, nine adenine residues owing to the substitution of A for T at the C-terminal end ofagrA.
on May 16, 2020 by guest
http://jcm.asm.org/
not. In this study, we found that many of enteritis isolates had the same mutation inagrA, whereas the nonenteritis isolates did not. This mutation was nine adenines, owing to the substi-tution of an A for a T at the C-terminal end and the same Mu3 and Mu50 sequences. These isolates have high levels of expres-sion ofagrA, so it may be presumed that this mutation influ-ences the expression of activeagrA. However, the same muta-tion inagrAwas not found in PFGE type A isolates, which are genotypically similar to each other, but all of enteritis isolates
hadagrBDCmutations, whereas only one nonenteritis isolate
had theagrBDCmutations. These results show a trend in which mutations inagrBDCinfluence the levels ofagrA expression. Thus, in PFGE type A isolates, the agrBDC mutations ap-peared to be play an important role as a cause ofagrA over-expression. To explain this fact, we thought it was important that some operon was expressed as monocistronic and polycis-tronic mRNA (35). We hypothesized thatagrAmay have both monocistronic and polycistronic mRNA. A decrease in the level of polycistronic mRNA (e.g., a frameshift mutation in
agrBDC) may have influenced monocistronicagrAmRNA
ex-pression. Further studies are needed to verify our hypothesis. Several important studies have described the genotypes of enteritis isolates (9, 36); therefore, PFGE is a useful surveil-lance method for the identification of genotypically different isolates. However, virulent isolates are not usually associated with a particular PFGE type. Actually, in our study, some strains with different base sequences that appeared to influ-ence the levels of TSST-1 expression were genetically the same isolate, according to the results of PFGE analysis. Therefore, our results provide evidence that sequencing of theagrlocus and quantification ofagrAexpression levels provide additional information in surveys of MRSA enteritis, and it is possible to assume that combining that technology with PFGE will allow further discrimination of MRSA enteritis isolates.
There is convincing evidence that some environmental con-ditions, including glucose levels and changes in pH, affectagr
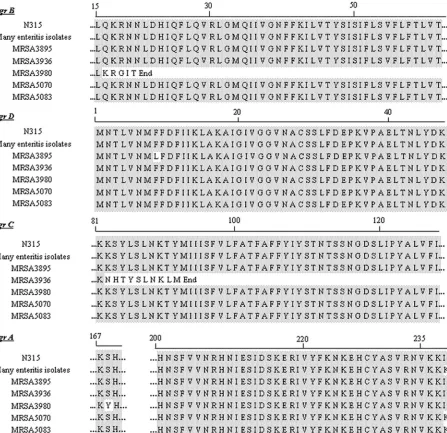
expression and toxin production (26). Surgery on the upper gastrointestinal tract, especially cancer-related surgery, and the administration of histamine H2 receptor antagonists and
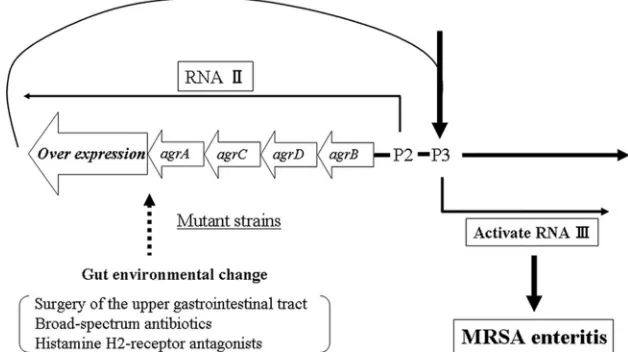
broad-spectrum antimicrobial agents are considered clinically significant causes of MRSA enteritis. These factors cause en-vironmental changes in the gut; therefore, it is possible that these environmental changes in the gut accumulate and effect mutations in the agr locus, resulting in agr overexpression, which leads to MRSA enteritis (Fig. 3). However, to verify our hypothesis, further studies are needed to evaluate the associ-ation between mutassoci-ations in theagrlocus and these factors and the mechanisms that cause MRSA enteritis.
In conclusion, theagrlocus is associated with the develop-ment of MRSA enteritis. Moreover, mutations in theagrlocus have a potential association with the induction of the overex-pression ofagrAand increased toxin production, which influ-ence the occurrinflu-ence of MRSA enteritis. Therefore, sequencing of theagrlocus and quantification ofagrAexpression provide additional information in surveys of MRSA enteritis.
ACKNOWLEDGMENTS
We thank Ikuko Fukuba and Emi Fukuda for excellent technical support and for helpful suggestions.
REFERENCES
1.Bronner, S., P. Stoessel, A. Gravet, H. Monteil, and G. Prevost.2000.
Vari-able expressions ofStaphylococcus aureusbicomponent leucotoxins
semi-quantified by competitive reverse transcription-PCR. Appl. Environ.
Micro-biol.66:3931–3938.
2.Eleaume, H., and S. Jabbouri.2004. Comparison of two standardisation methods in real-time quantitative RT-PCR to follow Staphylococcus aureus
genes expression during in vitro growth. J. Microbiol. Methods59:363–370.
3.Goerke, C., S. Campana, M. G. Bayer, G. Doring, K. Botzenhart, and C. Wolz. 2000. Direct quantitative transcript analysis of theagr regulon of
Staphylococcus aureusduring human infection in comparison to the
expres-sion profile in vitro. Infect. Immun.68:1304–1311.
4.Goerke, C., S. Esser, M. Kummel, and C. Wolz.2005. Staphylococcus aureus
strain designation byagrandcappolymorphism typing and delineation ofagr
diversification by sequence analysis. Int. J. Med. Microbiol.295:67–75.
5.Heyer, G., S. Saba, R. Adamo, W. Rush, G. Soong, A. Cheung, and A. Prince.
2002.Staphylococcus aureus agrandsarAfunctions are required for invasive
infection but not inflammatory responses in the lung. Infect. Immun.70:127–
133.
6.Jarraud, S., G. J. Lyon, A. M. Figueiredo, L. Gerard, F. Vandenesch, J. Etienne, T. W. Muir, and R. P. Novick.2000. Exfoliatin-producing strains
define a fourthagrspecificity group inStaphylococcus aureus. J. Bacteriol.
182:6517–6522.
[image:7.585.133.447.72.248.2]7.Jarraud, S., C. Mougel, J. Thioulouse, G. Lina, H. Meugnier, F. Forey, X.
FIG. 3. Integration of data from our study and other investigations. A hypothetical pathway relating MRSA enteritis to environmental changes in the gut is indicated.
on May 16, 2020 by guest
http://jcm.asm.org/
Nesme, J. Etienne, and F. Vandenesch.2002. Relationships between Staph-ylococcus aureusgenetic background, virulence factors,agrgroups (alleles),
and human disease. Infect. Immun.70:631–641.
8.Ji, G., R. Beavis, and R. P. Novick.1997. Bacterial interference caused by
autoinducing peptide variants. Science276:2027–2030.
9.Kaneko, A., T. Mori, T. Fujino, A. Nakamura, Y. Naiki, M. Mutoh, A. Nagata, and T. Kirikae.2000. An outbreak of enteritis induced by methicil-lin-resistant Staphylococcus aureus producing enterotoxin types A and C, toxic shock syndrome toxin-1 and coagulase type II. Jpn. J. Infect. Dis.
53:212–214.
10.Kodama, T., T. Santo, T. Yokoyama, Y. Takesue, E. Hiyama, Y. Imamura, Y. Murakami, H. Tsumura, K. Shinbara, N. Tatsumoto, and Y. Matsuura.
1997. Postoperative enteritis caused by methicillin-resistant Staphylococcus
aureus. Surg. Today27:816–825.
11.Koenig, R. L., J. L. Ray, S. J. Maleki, M. S. Smeltzer, and B. K. Hurlburt.
2004.Staphylococcus aureusAgrA binding to the RNAIII-agr regulatory
region. J. Bacteriol.186:7549–7555.
12.Konishi, T., Y. Idezuki, H. Kobayashi, K. Shimada, S. Iwai, K. Yamaguchi, and N. Shinagawa.1997. Oral vancomycin hydrochloride therapy for post-operative methicillin-cephem-resistant Staphylococcus aureus enteritis.
Surg. Today27:826–832.
13.Kuroda, M., T. Ohta, I. Uchiyama, T. Baba, H. Yuzawa, I. Kobayashi, L. Cui, A. Oguchi, K. Aoki, Y. Nagai, J. Lian, T. Ito, M. Kanamori, H. Matsumaru, A. Maruyama, H. Murakami, A. Hosoyama, Y. Mizutani-Ui, N. K. Taka-hashi, T. Sawano, R. Inoue, C. Kaito, K. Sekimizu, H. Hirakawa, S. Kuhara, S. Goto, J. Yabuzaki, M. Kanehisa, A. Yamashita, K. Oshima, K. Furuya, C. Yoshino, T. Shiba, M. Hattori, N. Ogasawara, H. Hayashi, and K. Hira-matsu.2001. Whole genome sequencing of meticillin-resistant
Staphylococ-cus aureus. Lancet357:1225–1240.
14.Mayumi, T., J. Takezawa, H. Takahashi, H. Yamaguchi, H. Nishimura, A. Enomoto, S. Ichiyama, and Y. Yoshikai. 1999. IL-15 is elevated in the
patients of postoperative enterocolitis. Cytokine11:888–893.
15.Mayville, P., G. Ji, R. Beavis, H. Yang, M. Goger, R. P. Novick, and T. W. Muir.1999. Structure-activity analysis of synthetic autoinducing thiolactone peptides from Staphylococcus aureus responsible for virulence. Proc. Natl.
Acad. Sci. USA96:1218–1223.
16.Morfeldt, E., L. Janzon, S. Arvidson, and S. Lofdahl.1988. Cloning of a
chromosomal locus (exp) which regulates the expression of several
exopro-tein genes in Staphylococcus aureus. Mol. Gen. Genet.211:435–440.
17.Morfeldt, E., I. Panova-Sapundjieva, B. Gustafsson, and S. Arvidson.1996. Detection of the response regulator AgrA in the cytosolic fraction of
Staph-ylococcus aureus by monoclonal antibodies. FEMS Microbiol. Lett.143:195–
201.
18.Mullarky, I. K., C. Su, N. Frieze, Y. H. Park, and L. M. Sordillo.2001.
Staphylococcus aureus agrgenotypes with enterotoxin production capabilities
can resist neutrophil bactericidal activity. Infect. Immun.69:45–51.
19.Naimi, T. S., K. H. LeDell, K. Como-Sabetti, S. M. Borchardt, D. J. Boxrud, J. Etienne, S. K. Johnson, F. Vandenesch, S. Fridkin, C. O’Boyle, R. N. Danila, and R. Lynfield.2003. Comparison of community- and health
care-associated methicillin-resistant Staphylococcus aureus infection. JAMA290:
2976–2984.
20.Novick, R. P., H. F. Ross, S. J. Projan, J. Kornblum, B. Kreiswirth, and S. Moghazeh.1993. Synthesis of staphylococcal virulence factors is controlled
by a regulatory RNA molecule. EMBO J.12:3967–3975.
21.Okii, K., E. Hiyama, Y. Takesue, M. Kodaira, T. Sueda, and T. Yokoyama.
2006. Molecular epidemiology of enteritis-causing methicillin-resistant
Staphylococcus aureus. J. Hosp. Infect.62:37–43.
22.Papakyriacou, H., D. Vaz, A. Simor, M. Louie, and M. J. McGavin.2000.
Molecular analysis of the accessory gene regulator (agr) locus and balance of
virulence factor expression in epidemic methicillin-resistant Staphylococcus
aureus. J. Infect. Dis.181:990–1000.
23.Peng, C. F., and T. S. Chen.1979. In vitro activity of midecamycin against Staphylococcus aureus. Zhonghua Min Guo Wei Sheng Wu Xue Za Zhi
12:32–33.
24.Peng, H. L., R. P. Novick, B. Kreiswirth, J. Kornblum, and P. Schlievert.
1988. Cloning, characterization, and sequencing of an accessory gene
regu-lator (agr) inStaphylococcus aureus. J. Bacteriol.170:4365–4372.
25.Recsei, P., B. Kreiswirth, M. O’Reilly, P. Schlievert, A. Gruss, and R. P. Novick.1986. Regulation of exoprotein gene expression in Staphylococcus
aureus by agar. Mol. Gen. Genet.202:58–61.
26.Regassa, L. B., R. P. Novick, and M. J. Betley.1992. Glucose and
nonmain-tained pH decrease expression of the accessory gene regulator (agr) in
Staphylococcus aureus. Infect. Immun.60:3381–3388.
27.Robinson, D. A., A. B. Monk, J. E. Cooper, E. J. Feil, and M. C. Enright.
2005. Evolutionary genetics of the accessory gene regulator (agr) locus in
Staphylococcus aureus. J. Bacteriol.187:8312–8321.
28.Romero-Vivas, J., M. Rubio, C. Fernandez, and J. J. Picazo.1995. Mortality associated with nosocomial bacteremia due to methicillin-resistant
Staphy-lococcus aureus. Clin. Infect. Dis.21:1417–1423.
29.Schiller, B., N. Chiorazzi, and B. F. Farber.1998. Methicillin-resistant
staph-ylococcal enterocolitis. Am. J. Med.105:164–166.
30.Takesue, Y., T. Yokoyama, T. Kodama, T. Santou, A. Nakamitsu, Y. Mu-rakami, Y. Imamura, K. Miyamoto, M. Okita, H. Tsumura, et al.1993. A study on postoperative enteritis caused by methicillin-resistant
Staphylococ-cus aureus. Surg. Today23:4–8.
31.Takesue, Y., T. Yokoyama, T. Kodama, T. Santou, A. Nakamitsu, Y. Mu-rakami, Y. Imamura, K. Miyamoto, M. Okita, H. Tsumura, et al.1991. Toxin involvement in methicillin-resistant Staphylococcus aureus enteritis in
gas-troenterological surgery. Gastroenterol. Jpn.26:716–720.
32.Tanaka, H., S. Miyazaki, Y. Sumiyama, and T. Kakiuchi.2004. Role of macrophages in a mouse model of postoperative MRSA enteritis. J. Surg.
Res.118:114–121.
33.Traber, K., and R. Novick.2006. A slipped-mispairing mutation in AgrA of
laboratory strains and clinical isolates results in delayed activation ofagrand
failure to translate delta- and alpha-haemolysins. Mol. Microbiol.59:1519–
1530.
34.van Leeuwen, W., W. van Nieuwenhuizen, C. Gijzen, H. Verbrugh, and A. van Belkum. 2000. Population studies of methicillin-resistant and -sensitive
Staphylococcus aureusstrains reveal a lack of variability in theagrDgene,
encoding a staphylococcal autoinducer peptide. J. Bacteriol.182:5721–5729.
35.Wachi, M., K. Osaka, T. Kohama, K. Sasaki, I. Ohtsu, N. Iwai, A. Takada, and K. Nagai.2006. Transcriptional analysis of the Escherichia colimreBCD
genes responsible for morphogenesis and chromosome segregation. Biosci.
Biotechnol. Biochem.70:2712–2719.
36.Watanabe, H., H. Masaki, N. Asoh, K. Watanabe, K. Oishi, S. Kobayashi, A. Sato, and T. Nagatake.2001. Enterocolitis caused by methicillin-resistant Staphylococcus aureus: molecular characterization of respiratory and
diges-tive tract isolates. Microbiol. Immunol.45:629–634.
37.Zhang, S., and G. C. Stewart.2000. Characterization of the promoter
ele-ments for the staphylococcal enterotoxin D gene. J. Bacteriol.182:2321–
2325.