IJPSR (2016), Vol. 7, Issue 10 (Research Article)
Received on 19 May, 2016; received in revised form, 13 June, 2016; accepted, 09 August, 2016; published 01 October, 2016
OPTIMIZATION OF VARIOUS PROCESS PARAMETERS FOR FORMULATION OF MODEL ANTI-HYPERLIPIDEMIC DRUG BY USING DRY GRANULATION METHOD
Himankar Baishya*, Athappan Chidambaram and Zhao Haitho
Senior Director, R & D, Beijing Sciecure Pharmaceuticals Co., Ltd., Beijing, China.
ABSTRACT: The Tablet manufacturing process is a complex process, influenced by several process variables The aim of this study was to optimize blending; roller compaction and tablets compression processes using design space approach for a model Anti- Hyperlipidemic drug Fluvastatin. During each processes there are several factors which may affect product quality. So the main objective of present work was to identify various parameters and optimize the parameter for formulation of better product which includes Blending time, Roller force, Compression force and machine speed which were recognized as critical process parameters and were evaluated. A scale up batch is taken to evaluate and optimize the parameters. Critical quality attributes like Blend uniformity, granules parameters, flow behavior, tablet appearance, impact on tablet physical parameters and in-vitro drug dissolution release profile is evaluated to optimize the parameters. The data & test results of blend, granules and tablets at various in-process phases were complied with the specified limits and finished product sample analysis results found to be complying within specifications. This study and results obtained assures that the manufacturing process is reproducible, robust and will yield consistent product, which meets specification.
INTRODUCTION: Quality by Design (QbD):
Recently proposed quality-by-design (QbD) regulatory initiative of pharmaceutical product and process development has encouraged researchers in pharmaceutical industry to reach the “desired state” of drug manufacturing in 21st century. Main goal of this approach is to gain a comprehensive understanding of their manufacturing processes, with an accurate estimation of their robustness and reliability.
QUICK RESPONSE CODE
DOI:
10.13040/IJPSR.0975-8232.7(10).3959-70
Article can be accessed online on:
www.ijpsr.com
DOI link: http://dx.doi.org/10.13040/IJPSR.0975-8232.7 (10).3959-70
The emphasis has changed from the need to demonstrate that the product will consistently meet relatively tight specifications to a new situation of being able to demonstrate that the product is controlled within a broader “design space” (DS). The design space (DS) concept is introduced as “the multidimensional combination and interaction of input variables (e.g., materials attributes) and process parameters that have been demonstrated to provide assurance of quality.”
Using this approach, it is essential to define relationship between critical formulation/process parameters and critical quality attributes (such as granule characteristics and tablet properties. A simplified quality assurance diagram under the QbD for drug product development is schematically represented in Fig. 1.1, 2
Keywords:
Tablet, Anti- Hyperlipidemic,
In-vitro,Granulation
Correspondence to Author: Himankar Baishya
Senior Director, R & D,
Beijing Sciecure Pharmaceuticals Co., Ltd., North Shi Zhen in the
North industrial area, shunyi district,
Beijing. China. Post code: 101301
TABLE 1: A SIMPLIFIED QUALITY ASSURANCE
DIAGRAM UNDER THE QBD FOR GENERIC DRUGS 2
Process Optimisation:
The development and commercial release of a globally marketed pharmaceutical drug product necessarily begins in the realm of the very small. Drug discovery may focus on the molecular level, and early formulation may deal with only gram quantities of material. It is at the early formulation stage, however, that a tentative sequence of physico chemical operations is initially
Proposed and developed to transform the raw materials into a drug product with the desired quality attributes (e.g., potency, dissolution, etc.) At this early stage, these experimental operations are carried out in bench top or small pilot-scale equipment, and the process knowledge in the form of raw data obtained from these experiments is specific to that scale. Process optimization is the practice by which process knowledge is developed and formulated in such a way that it can be applied effectively to guide equipment selection process parameters, process conditions, and process control strategies, irrespective of scale.3, 4
An HPMC based extended release tablet formulation of a model anti-Hyperlipidemic drug is developed by dry granulation process. The manufacturing stages involve sifting, blending, blend lubrication, roller compaction, compression and coating.
The aim of our study was to define the design space of Blending operation, dry granulation and tablet compression process. In the first part, the assessment of process and formulation factors
(critical material and process parameters) and their influence on critical quality attributes of intermediate and finished product was performed. Dry granulation parameters and compression force were varied, in order to develop new design space, evaluating their influence on tablets characteristics.
MATERIALS AND METHODS: Materials:
Materials used in the presented study for the granulation and tableting experiments were: Fluvastatin sodium (TEVA API India limited.), Glyceryl behenate (Compritol 888 ATO, Gattefosse), Pregelatinized Starch (Starch 1500 - Colorcon), Hypromellose (Methocel K100LV CR - Colorcon), Hypromellose (Methocel K15MCR - Colorcon), Potassium Hydrogen Carbonate (Merck KgaA Germany), Magnesium Stearate (Peter Graven) and Opadry Yellow 81W42236 (Colorcon)
Manufacturing procedure:
Matrix tablets were prepared by dry granulation method with the formula optimized composition as given in Table 1.
TABLE 1: FINAL FORMULA COMPOSITION TO BE PROCESS OPTIMSED FOR
Sl.no Name of the Raw Material mg/tablet
Core Tablets
1 Fluvastatin sodium 84.28
2 Glyceryl Behenate 50.00
3 Pregelatinized Starch 81.72
4 Hypromellose (Grade A) 34.00
5 Hypromellose(Grade B) 32.00
6 Potassium Hydrogen
Carbonate
13.00
7 Magnesium Stearate 5.00
Core Tablet weight 300.0
Coating agent
8 Opadry Yellow 3.00
9 Purified Water NA
Coated Tablet weight 303.0
[image:2.612.50.302.54.230.2] [image:2.612.312.558.416.593.2]desired granular material. The obtained granules were lubricated with extra granular Magnesium Stearate for 5 minutes and resulting granules were evaluated for the flow properties. Tablets were compressed using 10.0 mm round shaped punches on KORSCH XM-12 compression machine. As per the process optimization plan different critical
process parameters were evaluated and studied for their effect on critical quality attributes or quality target product profile (QTPP) of products.
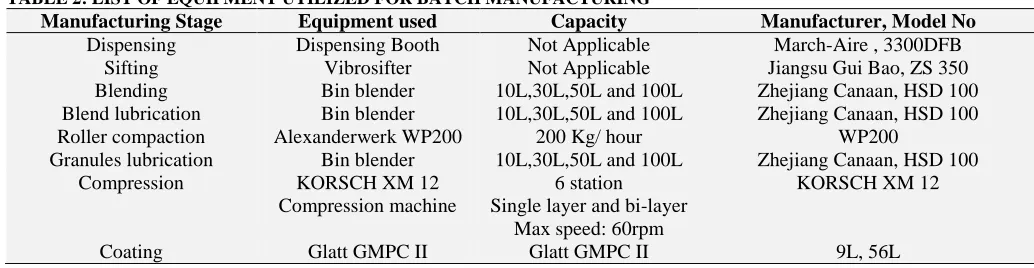
[image:3.612.45.562.169.303.2]The details of equipments used for various manufacturing process and their capacities areas listed in Table 2.
TABLE 2: LIST OF EQUIPMENT UTILIZED FOR BATCH MANUFACTURING
Manufacturing Stage Equipment used Capacity Manufacturer, Model No
Dispensing Dispensing Booth Not Applicable March-Aire , 3300DFB
Sifting Vibrosifter Not Applicable Jiangsu Gui Bao, ZS 350
Blending Bin blender 10L,30L,50L and 100L Zhejiang Canaan, HSD 100
Blend lubrication Bin blender 10L,30L,50L and 100L Zhejiang Canaan, HSD 100
Roller compaction Alexanderwerk WP200 200 Kg/ hour WP200
Granules lubrication Bin blender 10L,30L,50L and 100L Zhejiang Canaan, HSD 100
Compression KORSCH XM 12
Compression machine
6 station Single layer and bi-layer
Max speed: 60rpm
KORSCH XM 12
Coating Glatt GMPC II Glatt GMPC II 9L, 56L
Based on scientific understanding and prior knowledge, a risk assessment of the potential impact of the unit operations on the drug product CQAs was completed. Table 3 shows the result of
[image:3.612.44.573.396.486.2]the risk assessment and identifies the unit operations which require further investigation to determine the appropriate control strategy.
TABLE 3: RISK MATRIX FOR DRUG PRODUCT CQAS FOR EACH UNIT OPERATION Unit operation
DP CQAs Blending Blend
Lubrication
Roller compaction
Granules lubrication
Compression
Appearance Low Low Low Low High
Identity Low Low Low Low Low
Assay Low Low Low Low High
Content uniformity High High High High High
Dissolution Low Low High Low High
Process Optimization – Blending and Blend Lubrication Unit Operation:
The manufacturing process uses a blending step followed by roller compaction to obtain granules for compression. The blend includes approximately 26% active and 74% excipients, which is mostly Glyceryl behenate and Pregelatinized Starch. Despite the presence of roller compaction and granules blending step (lubrication) later in the process train, this processing step was deemed critical because development studies indicated that
material insufficiently blended or lubricated at this stage ultimately leads to unacceptable content uniformity of the finished drug product and roller sticking tendency during compaction respectively. Blending process was done for 12 minutes at 12 rpm with intermittent sampling was done at 4 minutes, 8 minutes and 12 minutes. The 12 minutes blended material is lubricated for 5 minutes at 12 rpm with intermittent sampling at 3 minutes and 5 minutes. Details is as listed in Table 4.
TABLE 4: PROCESS PARAMETERS FOR BLENDING AND BLEND LUBRICATION BATCH SIZE – 40, 000 TABLETS, 12.0 KG
Blending Blend Lubrication
Batch No Trial 1 Trial 2 Trial 3 Trial 1 Trial 2
Machine RPM 12 RPM 12 RPM 12 RPM 12 RPM 12 RPM
Blending time (minutes) 4 minutes 8 minutes 12 minutes 3 minutes 5 minutes
[image:3.612.51.566.682.744.2]The sampled materials are analyzed for individual blend content uniformity as per the approved method and evaluated for blend content uniformity at various blending time intervals.
Process Optimization – Roller compaction unit operation: 5, 6
The purpose of the roller compaction and milling stages is to produce granulated product that is suitable for subsequent blending and compression. The initial blend is transferred to the roller compactor where a screw-feeder drives it between two rollers, which compact the material. The compacted ribbon is then broken up and passes
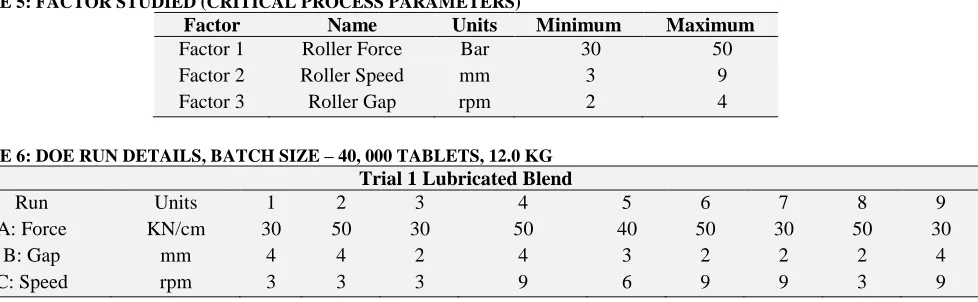
[image:4.612.73.562.266.417.2]through a rotating impellor screen mill. Critical process parameter for roller compaction process is Roller force, roller gap, roller speed and mill screen size. The parameters under evaluation are Roller force, roller gap and roller speed. A design experiment of 2 Level Factorial design with 1 center point is applied to evaluate the roller compaction parameters on critical quality attributes of drug product. The compacted granules are lubricated and compressed into tablets at pre-determined parameters. The factors and range for roller compaction parameter studied is as in Table 5.
TABLE 5: FACTOR STUDIED (CRITICAL PROCESS PARAMETERS)
Factor Name Units Minimum Maximum
Factor 1 Roller Force Bar 30 50
Factor 2 Roller Speed mm 3 9
Factor 3 Roller Gap rpm 2 4
TABLE 6: DOE RUN DETAILS, BATCH SIZE – 40, 000 TABLETS, 12.0 KG Trial 1 Lubricated Blend
Run Units 1 2 3 4 5 6 7 8 9
A: Force KN/cm 30 50 30 50 40 50 30 50 30
B: Gap mm 4 4 2 4 3 2 2 2 4
C: Speed rpm 3 3 3 9 6 9 9 3 9
For tracking and understanding the granules are coded as Trial 1-A to Trail 1-I. The impact of these parameters on Critical Quality Attributes of Drug Products and Intermediates like Bulk density, Tapped density, PSD #60 meshes Cum. % retained and tablet dissolution profile is studied.
Process Optimization – Granulation Lubrication Unit Operation:
Following the roller compaction and milling, the milled granulation is blended with extragranular
excipients in a third blending operation. The granules are mixed with 1.0% magnesium stearate (as lubricant). Based on the development data, the blending parameter targets listed in Table 7 are acceptable for the proposed commercial scale lubrication blending process. Because studies have shown that wide variations in both blending time and blender fill volume have negligible impact on any CQA, this unit operation is considered robust and has no critical process parameters.
TABLE 7: PROCESS PARAMETERS FOR GRANULES LUBRICATION Batch Size – 40, 000 Tablets, 12.0 kg
Granules Lubrication
Batch No Trial 1
Machine RPM 12 RPM
Blending time (minutes) 5 minutes
Total Revolution 60 revolutions
The sampled materials are analyzed for individual blend content uniformity as per the approved method and evaluated for blend content uniformity
Compression process parameters: 7, 8
During compression of the tablet, Compression Force (Pre-Compression and Main Compression) and machine speed should be optimized. Compression parameters for compression force and
speed stud study are shown in Table 8 and 9
[image:5.612.61.557.137.362.2]respectively. Tablets of these batches were evaluated for Thickness, Weight variation, Friability and dissolution study.
TABLE 8: COMPRESSION FORCE STUDY Batch Size – 40, 000 Tablets, 12.0 kg
Parameter Optimization batch
High compression
force
Target compression
force
Low compression force
Without pre-compression
force
Pre-compression force (Kn) 8.5 3.2 1.4 0.2
Main compression force (Kn) 36.1 23.1 17.3 13
Dosing (mm) 5.1 4.9 5.1 5.1
Machine RPM 15 15 12 12
TABLE 9: COMPRESSION MACHINE SPEED STUDY
Parameter Optimization batch
High speed – 40 RPM
Target speed - 20 RPM
Low speed - 10 RPM
Main compression force (Kn) 23.1 23.1 23.1
Dosing (mm) 4.9 4.9 4.9
Machine RPM 40 20 10
RESULTS AND DISCUSSION:
Process Optimization – Blending and Blend Lubrication Unit Operation:
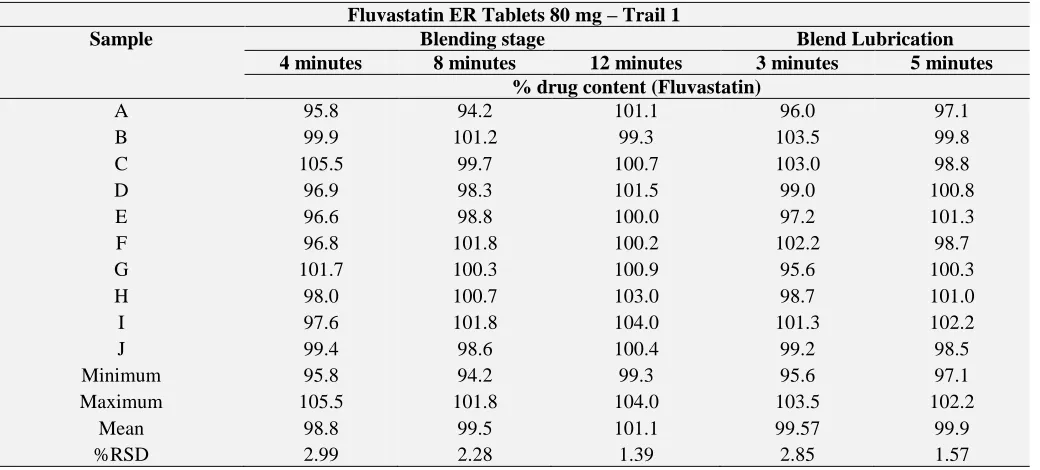
For batch No coded as Trail 1, blend uniformity data at blending stage and blend lubrication stage is tabulated in Table 9 and graphical representation of % RSD with mixing time is shown in Figure 2 and 3. From the results we can say that % RSD is
[image:5.612.49.569.509.744.2]less than 4.0% at all time intervals. At blending stage with increase in blending time from 4 minutes to 12 minutes the % RSD is minimum and content uniformity is improved. Also with blend lubrication the % RSD reduced to less than 2.0% at 5 minutes blend lubrication time. So finally 12 minutes of blending time and five minutes of blend lubrication time was finalized.
TABLE 10: BLEND UNIFORMITY DATA AT BLENDING AND BLEND LUBRICATION STAGE Fluvastatin ER Tablets 80 mg – Trail 1
Sample Blending stage Blend Lubrication
4 minutes 8 minutes 12 minutes 3 minutes 5 minutes
% drug content (Fluvastatin)
A 95.8 94.2 101.1 96.0 97.1
B 99.9 101.2 99.3 103.5 99.8
C 105.5 99.7 100.7 103.0 98.8
D 96.9 98.3 101.5 99.0 100.8
E 96.6 98.8 100.0 97.2 101.3
F 96.8 101.8 100.2 102.2 98.7
G 101.7 100.3 100.9 95.6 100.3
H 98.0 100.7 103.0 98.7 101.0
I 97.6 101.8 104.0 101.3 102.2
J 99.4 98.6 100.4 99.2 98.5
Minimum 95.8 94.2 99.3 95.6 97.1
Maximum 105.5 101.8 104.0 103.5 102.2
Mean 98.8 99.5 101.1 99.57 99.9
FIG.2: COMPARISON OF BLEND UNIFORMITY DATA AT DIFFERENT BLENDING TIME INTERVALS FOR FLUVASTATIN ER TABLETS 80 MG
FIG.3: COMPARISON OF BLEND UNIFORMITY DATA AT DIFFERENT BLEND LUBRICATION TIME INTERVALS FOR FLUVASTATIN ER TABLETS 80 MG
Process Optimization – Roller compaction unit operation:
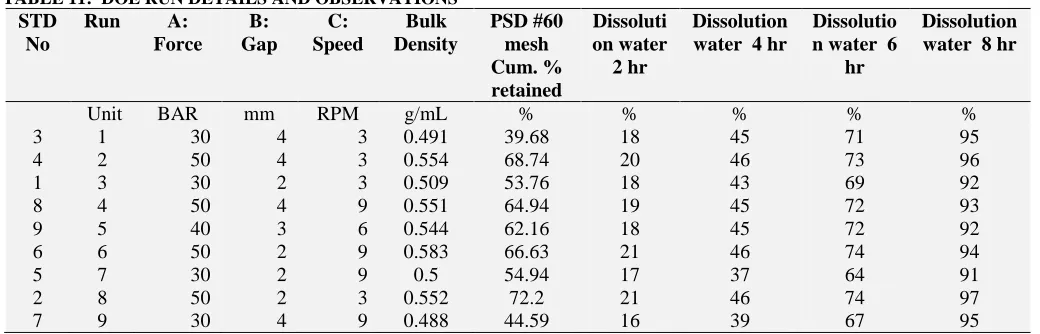
The trial batch In-process data for granules parameter and Dissolution profile for tablets at various time points is collated in tabular form. The analysed results, statistical data, Tablet parameters
and dissolution profile are tabulated in Table 10 – 13. The statistical summary for the Design of experiments factorial model is tabulated in
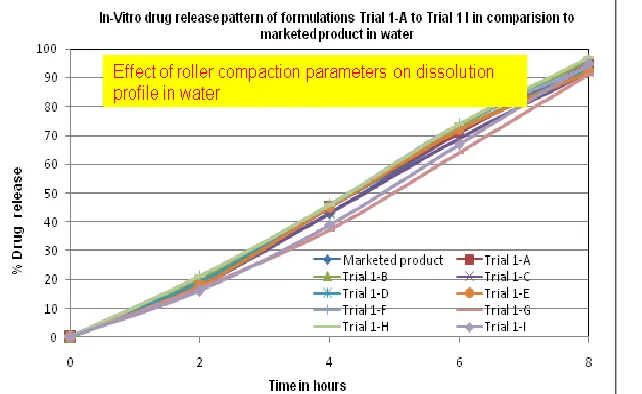
[image:6.612.150.466.54.232.2]Table10. The contour plot, Pareto chart and Overlay plot for effect of model on evaluated parameters is as in Fig. 4 and 5.
TABLE 11: DOE RUN DETAILS AND OBSERVATIONS STD
No
Run A:
Force B: Gap
C: Speed
Bulk Density
PSD #60 mesh Cum. % retained
Dissoluti on water
2 hr
Dissolution water 4 hr
Dissolutio n water 6
hr
Dissolution water 8 hr
Unit BAR mm RPM g/mL % % % % %
3 1 30 4 3 0.491 39.68 18 45 71 95
4 2 50 4 3 0.554 68.74 20 46 73 96
1 3 30 2 3 0.509 53.76 18 43 69 92
8 4 50 4 9 0.551 64.94 19 45 72 93
9 5 40 3 6 0.544 62.16 18 45 72 92
6 6 50 2 9 0.583 66.63 21 46 74 94
5 7 30 2 9 0.5 54.94 17 37 64 91
2 8 50 2 3 0.552 72.2 21 46 74 97
[image:6.612.151.473.269.446.2] [image:6.612.47.567.584.751.2]TABLE 12: DOE SUMMARY: STATISTICAL ANALYSIS ANOVA
Analysis
Bulk density PSD #60 mesh
Retained Dissolution 2 hour Dissolution 4 hour Dissolution 6 hour
Dissolution 8 hour
p- values Signal. Response effect p- values Signal. Response effect p- values Signal. Response effect p- values Signal. Response effect p- values Signal. Response effect p- values Signal. Response effect
Model 0.006 Yes 0.006 Yes 0.008 Yes 0.081 NA 0.059 NA 0.339 NA
Roller Force
0.001 Yes 0.001 Yes 0.002 Yes 0.035 yes 0.019 yes 0.2492 No
Roller Gap
0.13 No 0.061 No 0.082 No 0.648 No 0.745 No 0.3904 No
Roller Speed
0.639 No 0.801 No 0.082 No 0.099 No 0.157 No 0.2492 No
TABLE 13: TABLET PHYSICAL PARAMETERS FOR TABLETS COMPRESSED USING GRANULES COMPACTED AT DIFFERENT PARAMETERS
Parameter
Trial 1- A Trial 1-B Trial 1-C Trial 1-D Trial 1-E Trial 1-F Trial 1-G Trial 1-H Trial 1-I
Individual weight(mg)
299 - 306 306 - 313 299 - 308 300 - 305 295 - 306 291 - 306 298 - 305 298 - 308 299 – 304
Thickness(mm) 4.11 - 4.20 4.14 - 4.25 4.10 - 4.20 4.08 - 4.12 4.14 - 4.22 4.14 - 4.24 4.15 - 4.24 4.18 - 4.26 4.18 -4.24
Hardness(N) 52 - 61 52 - 68 60 - 65 52 - 65 55 - 64 39 - 50 52 - 64 50 - 64 51 – 62
Friability (1%) Nil Nil Nil Nil Nil nil nil Nil Nil
Flow Properties Good Good Good Good Good Good Good Good Good
Table 11 shows the tablet physical testing results of tablets prepared using different granules using roller compaction granulation parameter. Data show goods similarity between different roller
compaction parameter. The results also show that the speed at which the roller compactor equipment was operated at did not influence tablet crushing strength values.
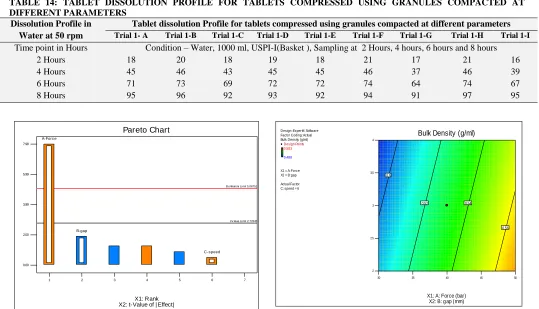
TABLE 14: TABLET DISSOLUTION PROFILE FOR TABLETS COMPRESSED USING GRANULES COMPACTED AT DIFFERENT PARAMETERS
Dissolution Profile in Water at 50 rpm
Tablet dissolution Profile for tablets compressed using granules compacted at different parameters Trial 1- A Trial 1-B Trial 1-C Trial 1-D Trial 1-E Trial 1-F Trial 1-G Trial 1-H Trial 1-I
Time point in Hours Condition – Water, 1000 ml, USPI-I(Basket ), Sampling at 2 Hours, 4 hours, 6 hours and 8 hours
2 Hours 18 20 18 19 18 21 17 21 16
4 Hours 45 46 43 45 45 46 37 46 39
6 Hours 71 73 69 72 72 74 64 74 67
8 Hours 95 96 92 93 92 94 91 97 95
0.00 2.00 3.99 5.99 7.98
1 2 3 4 5 6 7
Pareto Chart
X1: Rank X2: t-Value of | Effect|
B onferroni Limit 5.06751
t-V alue Limit 2.77645 A-Forc e
B-gap
C-s peed
Design-Expert® Software Factor Coding: Actual Bulk Density (g/ml)
Design Points
0.583 0.488
X1 = A: Force X2 = B: gap
Actual Factor C: speed = 6
30 35 40 45 50
2 2.5 3 3.5 4
Bulk Density (g/ml)
X1: A: Force (bar) X2: B: gap (mm)
0.5
0.52 0.54
0.56
[image:7.612.39.578.394.703.2]0.00 0.70 1.39 2.09 2.78 3.48 4.18 4.87 5.57 6.26
1 2 3 4 5 6 7
Pareto Chart
X1: Rank X2: t-Value of | Effect|
B onferroni Limit 5.06751
t-V alue Limit 2.77645 A-Forc e
B-gap
C-speed
Design-Expert® Software Factor Coding: Actual PSD #60 mesh Cum. % retained (%)
Design Points
72.2 39.68
X1 = A: Force X2 = B: gap
Actual Factor C: speed = 6
30 35 40 45 50
2 2.5 3 3.5 4
PSD #60 mesh Cum. % retained (%)
X1: A: Force (bar) X2: B: gap (mm)
50
60
70
Pareto Chart for effect on PSD #60 Mesh Cum. % Retained of granules12593
Contour plot for roll pressure and roller gap versus PSD #60 Mesh Cum. % Retained of granules
0.00 1.73 3.46 5.20 6.93
1 2 3 4 5 6 7
Pareto Chart
X1: Rank X2: t-Value of | Effect|
B onferroni Limit 5.06751
t-V alue Limit 2.77645 A-Forc e
B-gap C-speed
Design-Expert® Software Factor Coding: Actual Dissolution water 2 hr (%)
Design Points
21 16
X1 = A: Force X2 = B: gap
Actual Factor C: speed = 6
30 35 40 45 50
2 2.5 3 3.5 4
Dissolution w ater 2 hr (%)
X1: A: Force (bar) X2: B: gap (mm)
17
18 19
20
Pareto Chart for effect on Dissolution in water at 2 Hour Contour plot for roll pressure and roller gap versus Dissolution in dissolution at 2 Hour
0.00 1.27 2.53 3.80 5.07
1 2 3 4 5 6 7
Pareto Chart
X1: Rank X2: t-Value of | Effect|
B onferroni Limit 5.06751
t-V alue Limit 2.77645
A-Forc e
C-speed
B-gap
Design-Expert® Software Factor Coding: Actual Dissolution water 4 hr (%)
Design Points
46 37
X1 = A: Force X2 = B: gap
Actual Factor C: speed = 6
30 35 40 45 50
2 2.5 3 3.5 4
Dissolution w ater 4 hr (%)
X1: A: Force (bar) X2: B: gap (mm)
41
42 43 44 45 46
0.00 1.27 2.53 3.80 5.07
1 2 3 4 5 6 7
Pareto Chart
X1: Rank X2: t-Value of | Effect|
B onferroni Limit 5.06751
t-V alue Limit 2.77645
A-Forc e
C-s peed
B-gap
Design-Expert® Software Factor Coding: Actual Dissolution water 6 hr (%)
Design Points
74 64
X1 = A: Force X2 = B: gap
Actual Factor C: speed = 6
30 35 40 45 50
2 2.5 3 3.5 4
Dissolution w ater 6 hr (%)
X1: A: Force (bar) X2: B: gap (mm)
68
69 70 71 72 73
Pareto Chart for effect on Dissolution in water at 6 Hour Contour plot for roll pressure and roller gap versus Dissolution in dissolution at 6 Hour
0.00 1.27 2.53 3.80 5.07
1 2 3 4 5 6 7
Pareto Chart
X1: Rank X2: t-Value of | Effect|
B onferroni Limit 5.06751
t-V alue Limit 2.77645
C-speed A-Forc e
B-gap
Design-Expert® Software Factor Coding: Actual Dissolution water 8 hr (%)
Design Points
97 91
X1 = A: Force X2 = B: gap
Actual Factor C: speed = 6
30 35 40 45 50
2 2.5 3 3.5 4
Dissolution w ater 8 hr (%)
X1: A: Force (bar) X2: B: gap (mm)
93
94
95
Pareto Chart for effect on Dissolution in water at 8 Hour Contour plot for roll pressure and roller gap versus Dissolution in dissolution at 8 Hour
FIG.4: THE CONTOUR PLOT AND PARETO CHART FOR EFFECT OF MODEL ON EVALUATED PARAMETERS
Design-Expert® Software Factor Coding: Actual Overlay Plot
Bulk Density PSD #60 mesh Cum. % retained Dissolution water 2 hr Dissolution water 4 hr Dissolution water 6 hr Dissolution water 8 hr
Design Points
X1 = A: Force X2 = B: gap
Actual Factor C: speed = 3
30 35 40 45 50
2 2.5 3 3.5 4 Overlay Plot
X1: A: Force (bar) X2: B: gap (mm)
Dissolution water 4 hr: 45
Design-Expert® Software Factor Coding: Actual Overlay Plot
Bulk Density PSD #60 mesh Cum. % retained Dissolution water 2 hr Dissolution water 4 hr Dissolution water 6 hr Dissolution water 8 hr
Design Points
X1 = A: Force X2 = B: gap
Actual Factor C: speed = 6
30 35 40 45 50
2 2.5 3 3.5 4 Overlay Plot
X1: A: Force (bar) X2: B: gap (mm)
Dissolution water 4 hr: 45
Multiple Responses Overlay Plot at Roller Sped = 3 rpm
Design-Expert® Software Factor Coding: Actual Overlay Plot
Bulk Density
PSD #60 mesh Cum. % retained
Dissolution water 2 hr Dissolution water 4 hr Dissolution water 6 hr Dissolution water 8 hr
Design Points
X1 = A: Force X2 = B: gap
Actual Factor C: speed = 9
30 35 40 45 50
2 2.5 3 3.5 4
Overlay Plot
X1: A: Force (bar) X2: B: g ap (mm)
[image:10.612.179.432.63.252.2]Multiple Responses Overlay Plot at Roller Sped = 9 rpm
FIG.5: THE MULTIPLE RESPONSES OVERLAY PLOT AT DIFFERENT ROLLER SPED (3 RPM, 6 RPM AND 9 RPM)
FIG.6: IN-VITRO DRUG RELEASE PATTERN OF FORMULATIONS TRIAL 1-A TO TRIAL 1 I IN COMPARISON TO MARKETED PRODUCT IN WATER
For all the 9 different granules the granules bulk density and particle size distribution was evaluated and found to be satisfactory. There was no flow problem during compression nor tablet sticking tendency during compression.
Roller pressure is the significant factor affecting all product attributes tested, but the operating range tested is within the design space (30 – 50 Bar). Roller gap may effect on the product attributes but not significant. Therefore the design space is what the operating range tested (2 - 4 mm). Roller speed was determined not to be critical process parameters. Therefore the design space is what the operating range tested (3 - 9 rpm). However the design space (overlay plot) indicates that at roller
RPM of 9, the process gives a satisfactory properties for the granules. At 3 and 6 rpm the Dissolution at 4 hours is on the higher side out of the specification limit. Further studies to be continued to optimize the process or to identify the acceptable dissolution release profile.
1.1 Process Optimization – Compression unit operation:
[image:10.612.153.474.288.485.2]the evaluated main-compression range of 36 – 13 Kn is suitable to achieve tablets of desired quality attributes. Also with minimal pre-compression
force of 0.2 Kn the binding of tablets were still reasonably good, as depicted in tablet parameters.
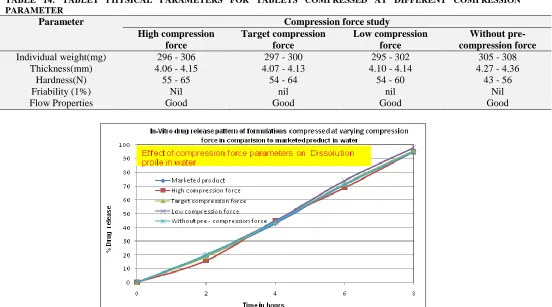
TABLE 14: TABLET PHYSICAL PARAMETERS FOR TABLETS COMPRESSED AT DIFFERENT COMPRESSION PARAMETER
Parameter Compression force study
High compression force
Target compression force
Low compression force
Without pre-compression force
Individual weight(mg) 296 - 306 297 - 300 295 - 302 305 - 308
Thickness(mm) 4.06 - 4.15 4.07 - 4.13 4.10 - 4.14 4.27 - 4.36
Hardness(N) 55 - 65 54 - 64 54 - 60 43 - 56
Friability (1%) Nil nil nil Nil
Flow Properties Good Good Good Good
FIG.7: IN-VITRO DRUG RELEASE PATTERN OF FORMULATIONS COMPRESSED AT VARYING COMPRESSION FORCE
IN COMPARISON TO MARKETED PRODUCT IN WATER
CONCLUSION: Tablet manufacturing by Dry granulation using roller compaction process is a widely used manufacturing process for poorly soluble drug having low bulk density. In manufacturing process, there are many factors which may affect final product. In this study all these critical process parameters were identified and optimized. Blending time and lubrication time in blender was also optimized. During roller compaction process the critical parameters were optimized using 3 factorial design with zero blocks. Roller compaction force is identified as the critical parameter affecting granules properties. During compression process, there was Tablet hardness which may affect release profile of drug. These parameters were also optimized. Finally its of the opinion that all the process parameters for formulation of Fluvastatin ER Tablets 80 mg by using Dry Granulation process were optimized to make the process a robust and reproducible in scale up manufacturing.
ACKNOWLEDGEMENT: We are extremely gratified to Formulation development Department and fellow colleagues, for helping us in the technical aspect of the project and also for useful scientific discussions, which produced methodical results and also for sharing their passion for drug product development and thus helping us in better understanding of critical process and quality attributes for drug development.
REFERENCES:
1. EMA, 2014. Human Regulatory, Quality by Design, Guidance Documents. Accessed on 2016.06.13
2. Edina Pallagi, Rita Ambrus, Piroska Szabó-Révész, Ildikó Csóka. Adaptation of the quality by design concept in early pharmaceutical development of an intranasal Nanosized formulation. International Journal of Pharmaceutics. 2015; 491:384 – 392.
3. B. Venkateswara Reddy, K. Navaneetha, K. Venkata Ramana Reddy. International Journal of Pharmacy and Pharmaceutical Sciences.2014; 6(4):312 – 317.
[image:11.612.43.595.113.420.2]Flowable Antiviral Formulation. Am. J. PharmTech Res. 2012; 2(4): 544 – 557.
5. Milad Khorasani et al., Process optimization of dry granulation based tableting line: Extracting physical material characteristics from granules, ribbons and tablets using near-IR (NIR) spectroscopic measurement
6. Richard Hwang, Robert M. Noack. Application of design of experiments to pharmaceutical formulation development; 2(1): 58 – 65.
7. Stephanie Sutton. Optimizing Tableting Processes with Quality by Design. Pharmaceutical Technology. 2012; 36(5).
8. Ales Belic, Igor Skrjanc, Damjana Zupancic Bozic, Franc Vrecer. Tableting process optimisation with the application of fuzzy models. International Journal of Pharmaceutics. 2010; 389(1-2): 86-93.
All © 2013 are reserved by International Journal of Pharmaceutical Sciences and Research. This Journal licensed under a Creative Commons Attribution-NonCommercial-ShareAlike 3.0 Unported License.
This article can be downloaded to ANDROID OS based mobile. Scan QR Code using Code/Bar Scanner from your mobile. (Scanners are available on Google Playstore)
How to cite this article: