INTERNAL CONTROL WEAKNESSES AND PROFITABILITY INFLUENCE OF AUDIT COMPANIES
*1
Catarina Beda Oliva do Amaral,
2Jorge de Souza Bispo and
3José Sérgio Casé de Oliveira
1
Master student in Accounting and Finance, Federal University of Bahia
2PhD in Controllership and Accounting, Professor, Federal University of Bahia,brazil
3
PhD in Economics, Professor, Federal University of Bahia
ARTICLE INFO ABSTRACT
This article aims to analyze weaknesses of internal control variables that influence the profitability of companies audited in 2018 by an independent audit firm of the State of Bahia. The influences of variables, such as internal control weaknesses, net operating revenue (NOR), net operating margin (NOM), return on invested capital (ROIC), and return on equity (ROE) on the profitability of these companies were analyzed. The results showed statistical significance only of ROIC and NOM in influencing profitability. The main limitations of the study were the small sample size and the measurement of internal control weaknesses.The research is relevant to the academic environment because it correlates the economic and financial return of companies with internal aspects, focusing on controls. Profitability is commonly related to other financial variables, and as far as controls are concerned, researches are mostly aimed at error and fraud detection.
Copyright © 2019, Catarina Beda Oliva do Amaral et al. This is an open access article distributed under the Creative Commons Attribution License, which permits unrestricted use, distribution, and reproduction in any medium, provided the original work is properly cited.
INTRODUCTION
Post-World War II economy is characterized by the widespread and free competition between companies, resulting in the constant pursuit of organizations for process and value chain improvement. Institutions identify the need to reduce costs and increase productivity in an increasingly competitive capitalist environment. In order to foster production, they endeavor to obtain funds from third parties, either through financial institutions or going public to shareholders. The new investor, an external agent to the organization and responsible for the capital contribution, is able to make decisions based on the financial statements of a company. The market considers the analysis of these statements, as well as their indicators (the result of relationships between accounts and groups of ledger accounts), of great value. The idea that the analysis of statements is a subsidy tool for internal and external users is supplemented by Brigham and Houstan (1999). Based on the same lines, in conclusion, there is significant relevance and impact of this information to business management and investment decisions. As a way of assuring the reliability of the published amounts, there is the figure of the External
Auditing professional, who reviews and issues opinions about the soundness, reliability and consistency of numbers. It is noteworthy that one cannot ignore the fact that the carrying amounts in the statements are the result of congruence of the economic and financial transactions that span all areas of an organization, i.e. processes must be aligned so that no relevant information is omitted by mistake or fraud. In 2019, the Committee of Sponsoring Organizations of the Treadway Commission (COSO) defined any process that provides the basis for “effectiveness and efficiency of operations, reliability of financial reports and compliance with applicable laws and regulations” as internal control. The reliability of analyses as result, profitability and cost effectiveness is assumed to be intrinsically linked to the quality of the applied internal controls. With the study of accounting and administrative bibliography, it becomes apparent that the internal resources of a company have a significant impact on its profitability. (Barney, 2001). After these considerations, one may establish intersections between the result of an organization and the level of internal controls. These controls are identified and mapped through External Auditing procedures and techniques. In order to investigate these correlations, this article aims to analyze the variables that influence profitability, focusing on
ISSN: 2230-9926
International Journal of Development Research
Vol. 09, Issue, 12, pp. 32768-32774, December, 2019
Article History:
Received xxxxxx, 2019 Received in revised form xxxxxxxx, 2019
Accepted xxxxxxxxx, 2019 Published online xxxxx, 2019 Article History:
Received 17th September, 2019
Received in revised form 23rd October, 2019
Accepted 06th November, 2019
Published online 31th December, 2019
Key Words:
Audit; Internal Controls; Profitability; Financial Indicators.
*Corresponding author: Catarina Beda Oliva do Amaral
RESEARCH ARTICLE
OPEN ACCESS
the internal control weaknesses of 37 companies audited in 2018 by an Independent Audit firm. Through a procedure of reading the Internal Control Reports, together with the analysis of financial statements from these 37 organizations, the problem that needs an answer after the accomplishment of this study is: “What are the effects of internal control weaknesses on the profitability of companies audited in 2018 by an External Audit firm?”
The following hypotheses were developed to answer the research question and achieve the proposed objective:
H0: Internal control weaknesses influence the profitability of
companies audited in 2018 by an independent audit firm from Bahia.
H1: Internal control weaknesses do not influence the
profitability of companies audited in 2018 by an independent audit firm from Bahia.
Control processes are commonly related to errors, fraud and corporate management. Regarding Profitability, there is a sense of relating it to other indicators, or to the size and growth of the company. The Academy lacks analyses between the beginning of an organization value chain (its processes maintained through internal controls) and its profitability, i.e. the economic and financial return generated by the business. Since organizations are profitable, it is pertinent to reveal the influence level of internal controls on a business’ profitability. Carvalho and Vieira (2015) study the reflection of internal controls on the occurrence of errors and fraud in Financial Institutions. In Maia et al. (2005), efforts are directed towards verifying the contribution of an internal control system for corporate excellence, its efficiency and effectiveness. Salman and Yazdanfar (2012) sought to elaborate a function for the profitability of Swedish microenterprises in the health, transport, trade and metal industries. It is noteworthy that no internal aspects were observed in the developed equation. Since only financial and economic factors are related to the return generated by the organization, a similar practice has been seen in Burja (2011).
This work is relevant because the research problem will be
answered by creating an ad doc indicator of internal control
weaknesses, which may contribute significantly to
professionals and scholars in the field. In addition to the Introduction, the work is structured in other four chapters. The second chapter refers to the Theoretical Framework, subdivided into three major areas: external audit, internal controls, and profitability. Then, we approach the research methodology, together with the proposed hypotheses, the econometric model, the database description and the like. Chapter four discusses the dissemination and interpretation of the obtained data. Finally, the final considerations are presented and characterized by study summary, scope ratification or not of the objective, response to the research problem, revealed results and limitations of the research construction process.
THEORETICAL REFERENCE
Audit
Audit Concept: To Attie (2011), audit is defined as an accounting improvement, which seeks to test the efficiency and effectiveness of asset control with the purpose of
expressing an opinion on certain content. Boynton, Johnson and Kell (2002) state that audit is:
A systematic process of objectively obtaining and evaluating evidence about statements regarding economic actions and events, to determine the degree of correspondence between established statements and criteria, and to communicate results to interested users. (BOYNTON, JOHNSON AND KELL, 2002). According to the concepts shown, it is understood that the auditor is the professional who will give an opinion about the effectiveness, reliability and adequacy of the due processes. Over the decades, the concept of accounting audit evolves, changes and is adapted. Such changes occur in order to reflect the needs of organizations and society, that is, users of information. It is noteworthy that Audit can be classified among several types. In Oliveira et al (2008), Audit can be stratified into: Accounting, Internal, Operational, Management and System. However, the current study will restrict its approach to Accounting Audit by independent auditors. The external accounting audit is performed by an independent auditor, who is the competent professional for analysis and verification of transactions and operations, as well as the equity position of an institution, both recorded in its financial statements. At the end of their work, the auditors will give their opinion on the trustworthiness and reliability of the evidenced data. Due to the need to raise external resources, organizations no longer see the process of reviewing their practices as a legal duty to be fulfilled, because having their statements and controls evaluated bring relevant information for formulating strategies and action plans, as well as granting greater reliability and consistency of the company before society.
External Audit and Internal Controls: A relevant aspect to be mentioned is that in addition to accounting balance analysis, the auditor makes efforts to review internal controls of the audited organization. By fostering value chain-related culture and process management, organizations, along with their auditors, have been focusing more attention on internal control deficiencies. According to ISA 265 – Report of Internal Control deficiencies, such weaknesses occur when the control is unable to prevent or detect misstatements in the financial statements, or when such control is not prepared. The use of techniques and procedures in these controls appears initially as a way to mitigate risks on the occurrence of errors and frauds. In Colares e Silva (2014), the research object involves the adoption of internal controls as a measure to reduce errors and frauds, not focusing on the economic benefit in the implementation of internal processes.
aspects. However, it is well known that internal controls generate economic and financial benefits, just as business efficiency is linked to the quality and correct application of these processes. For Boyton, Johnson and Kell (2002), these controls are enforceable by all parties involved in operations and are intended to meet and comply with the reliability of financial information, compliance with applicable laws and regulations, and effectiveness and efficiency of operations. In 2019, COSO published that the application of the processes cited at that session enables the achievement of strategic objectives, the provision of financial reports to stakeholders, the maintenance of operations efficiently and effectively, the compliance with applicable laws and, finally, the protection of assets. Over the decades, the scope and functionality of controls have evolved and gradually incorporated economic and financial aspects. However, with regard to the academy, the approach varies significantly. In 2005, Filho, Jacques and Marian show that internal processes and controls are not only interconnected with Accounting, they are a constituent part of all corporate management. A decade ahead, Carvalho and Vieira (2015) still make efforts to demonstrate the relationship between internal audit, internal control, fraud and errors.
Profitability: The purpose of Accounting is to analyze, measure, recognize and disclose their economic and financial transactions so that information users are able to make decisions. It is important to mention that the static position of these movements is evidenced by what is known by financial and accounting statements. ASSAF (2017) states that it is from the study of these statements that opinions about the equity structure, its evolution, results, margins, return on investment and profitability are made. Therefore, in relation to the Analysis of Statements, the benchmark instrument capable of measuring the relationship between assets, liabilities, revenues and expenses is called economic and financial indicators. According to literature, the indicators can be divided into Liquidity, Capital Structure and Profitability Indices. As the dependent variable of the present study refers to profitability, the indexes related to it will be collected and described. The profitability ratios are intended to measure the economic capacity of an organization, i.e. the user will have data on the return that the invested capital has generated by them, according to Ribeiro (2018). It can be said that profitability validates the economic and financial situation of the company. In Assaf (2017), the parameter of these indices is mostly the net income for the period. For Wernke (2008), the observation of these quotients enables the investor to have the power to decide on possible capital contributions or withdrawals.
In the present study, the profitability indicators used as control variables will be: Operating Net Margin, Return on Invested Capital (ROIC) and Return on Equity (ROE).
Net Operating Margin (NOM): Net Margin or Return on Sales is obtained by the ratio of net income on net sales. This index enables to verify how much net profit the company obtained for each billing unit. Regarding interpretation, Ribeiro (2018) states that “the higher, i.e. the closer to one this quotient is, the higher the profits made by the company will be.
Return on the invested capital (ROIC): Indicator used to express the economic capacity and performance of an organization. Commonly confused with ROE, ROIC differs from the former, as it analyzes return based on all capital
invested, either itself or from third parties. For Popa and Ciobanu (2014), this indicator is characterized by the measure of the efficiency in generating profits of its assets before the effects of financing.
Return on Equity (ROE): Based on Wernke (2008), this is the quotient that shows whether the investment made in the organization is more profitable than the alternatives offered in the market, which is known as opportunity rate in literature. As in Assaf (2012), the return on equity is expected to be at or above the mentioned rates.
METHODOLOGY
Data collection and samples: The research sample firstly included 49 companies, however 3 of them did not have enough data for an initial assessment of its profitability. In addition, companies with negative net worth were removed, because once the damages were analyzed, the financial return would be positive, mathematically. Finally, 2 companies were removed during the elaboration of the test statistics, because they presented outliers. Thus, the results that will be presented used financial reports and reports of internal controls of 37 audit companies as database, in the year of 2018, by an Independent Audit firm from Bahia State. This database was chosen due to information availability, considering it was necessary to access reports of weaknesses elaborated by External Auditors. The software used for performing the econometric tests was R 3.5.1.
Used model Variables
Dependent variable: Similar to Salman and Yazdanfar (2012) and in Yazdanfar D. (2013), the dependent variable of this research is Profitability. In the mentioned studies and in the present one, the profitability index was calculation based on the relation between operational results and total assets.
Control Variables
In order to find the regression model that would explain the profitability of companies reliably, which is the study basis, the following control variables were considered:
Internal Control Weaknesses: After review of internal control reports of the companies forming the database of this article, the following procedures were conducted and were able to measure the identified weaknesses:
Reading of all the reports of Internal Controls from
37 companies;
Standardization of the nomenclature of observed
weaknesses;
Segregation of weaknesses between financial and
non-financial companies;
Analysis and classification of financial weaknesses
between weak, medium, and strong;
Attribution of value to classifications of weak,
medium, and strong;
Calculation of internal control weaknesses for each
company.
It is noteworthy that these weaknesses were proposed through
based on information verified during the work period, and that it has the purpose of working for the present study. The classification between financial and non-financial weakness
was defined based on the following question: "Does the
existence of weakness impact the formation and reliability of the economic and financial indicators evaluated in this
article?". In the event there was a positive answer, the
weaknesses were considered as financial. The classification of these weaknesses as weak, medium and strong were intentionally determined by the authors because they needed to feel their effects before elaborating a scientific and more elaborate process, despite their limitation. We assigned weights to the weaknesses, as the following scale:
Weak – weight 0.1 Medium – weight 0.3 Strong – weight 0.6
The definitions of the variables used in this work are presented as:
Net operating revenue (ROL): Amount that the company obtains by selling products or providing services. Net operating revenue is the result of gross revenue less taxes on sales, discounts and abatements.
Net Operating Margin (NOM): This indicator aims to measure the efficiency of companies’ net sales, which is calculated based on the relation between the operating income and net operating revenues.
Return on the invested capital (ROIC): As seen in item 2.3.1 of this study, this indicator is used to assess the economic capacity of the company. Its calculation is obtained by the ratio of operating income minus taxes and carrying amount of Invested capital.
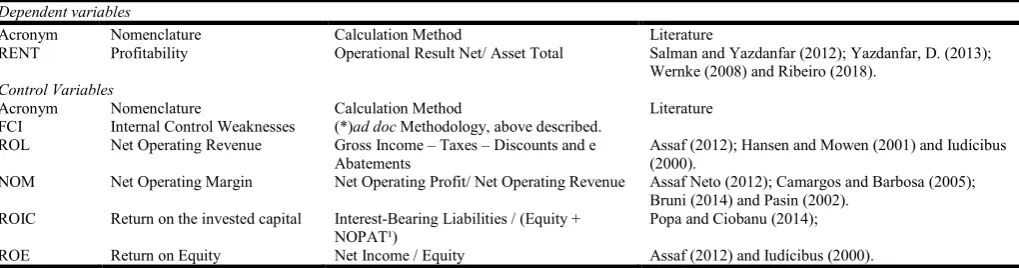
Return on Equity (ROE): This indicator is calculated as the ratio of Net Income on Equity and is commonly used as a comparison factor for investment decisions. Figure 01 presents a summary of information about the dependent and control variables, such as: acronym, formula for calculation, and the reviewed literature that mention them.
Proposed statistical model: It is noteworthy that, in order to validate the research objective, which examines the influence of internal control weaknesses on the profitability of 37 companies audited in 2018 by an Independent Audit firm from
Bahia State, the following econometric model was defined through the equation:
Yt = Bo + B1 FCI1i,t + B2 Ln ROL2i,t + B3 NOM3i,t + B4
ROIC4i,t + B5 ROE5i,t + t
Where:
Y = Profitability; Bo = Intercept; Ln: Natural logarithm;
= error terms assumed as: t N (0, 2).
B1, B2, B3, B4, B5 are parameters associated with the
respective independent variables included in the model.
It is noteworthy that the model was estimated with ordinary least squares, and its properties were analyzed in specific tests that will be more detailed in item 4 of this article. The demonstrated multiple linear regression is based on a
cross-sectional data set, which is also known as cross-section.This
data typology consists of a sample defined for a given period and that is widely used in applied social science studies. Regarding the level of statistical significance of each described coefficient, the values of their respective p-values at levels of significance ranging from 1%, 5% to 10% were taken as a basis for decision.
ANALYSIS OF RESULTS
[image:4.595.46.556.80.214.2]Descriptive Statistics: Table 01, which is listed below, presents the descriptive statistics of indicators used in the model specified in item 3.3. Based on what was mentioned, the dependent variable, Profitability, ranges from -0.34, as lower value, to 0.74, which means that the model includes unprofitable companies, such as companies with high profitability indexes. Regarding internal control weaknesses, the median and mean are close, between 4.6% and 5%, to the maximum point, since it was measured at 15.4%. Based on the provided data, in conclusion, the ROL of the companies that make up the research database does not vary significantly, although they belong to different segments. The net operating margin of these companies is 20%, on average, which is a low percentage when compared to the maximum of the sample, which is 92%. Regarding the own and third-party return on invested capital, represented by ROIC in Table 01, the sample includes companies with significant economic capacity, generating up to a 307% return on what was initially invested.
Figure 1. Definition of variables
Dependent variables
Acronym Nomenclature Calculation Method Literature
RENT Profitability Operational Result Net/ Asset Total Salman and Yazdanfar (2012); Yazdanfar, D. (2013); Wernke (2008) and Ribeiro (2018).
Control Variables
Acronym Nomenclature Calculation Method Literature
FCI Internal Control Weaknesses (*)ad doc Methodology, above described. ROL Net Operating Revenue Gross Income – Taxes – Discounts and e
Abatements
Assaf (2012); Hansen and Mowen (2001) and Iudícibus (2000).
NOM Net Operating Margin Net Operating Profit/ Net Operating Revenue Assaf Neto (2012); Camargos and Barbosa (2005); Bruni (2014) and Pasin (2002).
ROIC Return on the invested capital Interest-Bearing Liabilities / (Equity + NOPAT¹)
Popa and Ciobanu (2014);
ROE Return on Equity Net Income / Equity Assaf (2012) and Iudícibus (2000). ¹NOPAT = EBIT x (1-Taxes), where EBIT = Profit Before Interests and Lucro antes de Juros e Imposto de Renda
However, on the other hand, there are companies with negative return of 56%. This distinction is even more pronounced when this capital is restricted to itself, i.e. the focus is on the ROE. This indicator has a minimum return of -499%, an average of 20% and a maximum of 551%, which proves the heterogeneity of returns in the used sample.
RESULTS
After verification and analysis of data from the used sample, we start with the result of the initially proposed model. As described in the methodology, the level of statistical significance of each described coefficient had their respective p-values as a decision criterion. Table 2. Describes the presented amounts:
Based on the values shown above, only Net Operating Margin and Return on Invested Capital were statistically significant for a 5%confidence level, i.e. their respective p-values are lower than 0.05. Based on these results, there is not enough evidence to reject the H0 hypothesis that internal control weaknesses interfere in the profitability of 37 pillar companies for the study, considering the coefficient that represents the level of weaknesses is the FCI and its p-value is 0.2408, that is, higher than the 5% one defined as the study confidence level.
As for residues, the information obtained is listed in Table 03, as follows:
According to Gujarati and Porter (2011), multiple R² is how the variation proportion of the dependent variable is measured, i.e. profitability here, which is explained by the control
variables. That is, it analyzes the adjustment quality and, according to the authors, "it is" better "the closer R² is to 1". It is noteworthy that the multiple R² presented was 0.7813, that is, a highly satisfactory 78.13% adjustment. In addition, according to the literature mentioned in this paragraph, R² can be adjusted by the degrees of freedom associated with the sum of squares, which was 215 gl in the current sample for the residues. This measure is called adjusted R² and amounts to 0.746, which is the same as 74.6%. Table 04 reports the Analysis of Variance, commonly known as ANOVA. The aforementioned technique aims to ratify that the angular coefficients are all equal to zero. Econometric studies prove that the sum of total squares is equal to the sum of explained squares and the sum of squares of residuals (SQT = SQE + SQR).
The F ratio occurs based on the relation of square sum with degrees of freedom; thus, using the F Statistics, we can draw
conclusions about the relationship between the
coefficients.After obtaining the data, table F was used to determine the critical value of F, at a 5% significance level, which was approximately 2.53. Thus, the F value, shown in the table above, exceeds the critical mentioned amount. Therefore, considering that errors are normally distributed, the hypothesis that all angular coefficients are simultaneously equal to zero is rejected.
[image:5.595.68.523.254.328.2]Meeting MQO Assumptions: In order to validate compliance with the assumptions of the used method, i.e. ordinary least squares, as well as to verify if there was violation to the assumptions of the classical linear regression model, the following tests were performed.
Table 1. Descriptive Statistics
Variable Minimal Median Mean Maximal
Profitability -0.340 0.020 0.053 0.740
FCI 0.200 4.600 5.030 15.400
ROL 5.780 7.405 7.230 8.46
NOM -0.370 0.170 0.202 0.920
ROIC -0.560 0.050 0.177 3.070
ROE -4.990 0.040 0.207 5.510
Legend: FCI – Internal Control Weaknesses; ROL – Net Operating Revenue; NOM –Net Operating Margin; ROIC – Return on the
[image:5.595.128.464.378.452.2]Invested Capital, ROE – Return on Equity. Source: Elaborated by the authors.
Table 2. Regression Results
Coefficients Estimators Standards Error t-value p-value
(Intercept) -0.125348 0.144612 -0.867 0.3927
FCI -0.004459 0.003728 -1.196 0.2408
ROL 0.018412 0.020373 0.904 0.3731
NOM 0.145562 0.064038 2.273 0.0301*
ROIC 0.217108 0.030184 7.193 4.35e-08***
ROE -0.001131 0.010266 -0.110 0.9130
Legend: FCI – Internal Control Weaknesses; ROL – Net Operating Revenue; NOM –Net Operating
Margin; ROIC – Return on the Invested Capital, ROE – Return on Equity. Source: Elaborated by the authors.
Table 3. Result of Residues
Item Minimal 1st Quartile Median 3rd quartile Maximal Residue -0.196150 -0.045333 -0.001235 0.045107 0.189802 Source: Elaborated by the authors.
Table 4. ANOVA
Variation source gl SQ MSQ F-value P-value
Due to Regression (SQE) (k-1) = 5 0.76657 0.153314 22.146 2.142e-09*** Due to residues (SQR) (n-k)= 31 0.21460 0.006923
Normality test: Jarque Bera and Kolmogorov – Smirnov tests were performed to confirm that the errors follow a normal distribution. For the Jarque Bera test, the p-value was set to 0.4155, while Smirnov's test resulted in p-value close to 0.0000. Thus, based on the first test, the model meets the normality criteria for a 5% significance level.
Heteroscedasticity Test: Violation of the homoscedasticity hypothesis means that the model is heteroscedastic and, consequently, its estimator is inefficient. To validate compliance with this hypothesis, the following tests were applied: Goldfeld-Quandt and Breusch-Pagan and Koenker, for which p-values of 0.9957, 0.3788 and 0.1638, respectively, were verified.
Serial autocorrelation test: Gujarati and Porter (2011) define autocorrelation as “correlation between members of series of observations ordered in time, such as time series, or in space as in cross-sectional data”. Observations are ordered in space for the present study, because data were collected from a 2018 cross section. Durbin-Watson and Breusch-Godfrey tests were applied in order to validate the hypothesis that there is no autocorrelation in the proposed model, and the p-value results obtained were 0.6553 and 0.5643, respectively. They are sufficient to not reject the mentioned hypothesis.
Multicollinearity Test: Finally, Tables 06 and 07 show the results obtained for the applied multicollinearity tests. The literature points out that the expected VIF for which there is no multicollinearity in the model must be lower than 3, 5 or 10. Thus, the VIF showed that there is no violation of multicollinearity. It is noteworthy that the Analysis of the Number of Conditions was performed, and the value presented cannot be higher than 30 for this test. The test showed an amount higher than this, therefore the assumption was violated in the model.
FINAL CONSIDERATIONS
This research aimed to analyze the influence of internal control weaknesses, as well as other financial variables, on the profitability of 37 companies audited in 2018 by an independent auditing company from Bahia State. Data were collected through cross section, and the inverse relationship between internal control weaknesses and profitability was obtained. It is noteworthy that all the other analyzed variables maintained a positive relationship with profitability, except for ROE. Net Operating Margin and Return on Invested Capital were the only variables that were statistically significant for a 5% confidence level. This result is similar to the one presented in Burja (2010), in which the level of indebtedness is
significant in relation to profitability, but studies differ with regard to ROE. For Burja (2010), there were enough statistics to validate the influence of variables. In Popa and Ciobanu (2014), emphasis is given to macroeconomic aspects; however, the study statistics proved to be sufficient to prove the influence of ROIC and ROE on the returns of the surveyed companies. The base database for the study did not provide sufficient test statistics to verify the influence of other variables and profitability. In response to the proposed H0 hypothesis, there was no sufficient evidence to reject the H0 hypothesis that internal control weaknesses influence the profitability of the companies audited in 2018 by an independent audit firm from Bahia State. The econometric data presented multiple R² and adjusted R² of 78.13% and 74.60%, respectively. According to literature, the values are better the closer to 1. Thus, the adjustment of the dependent variable to the independent variable is highly significant. The study is relevant to the academic environment because it makes efforts to correlate the economic and financial return of companies with internal aspects, focusing on controls. Profitability is commonly related to other financial variables, and as far as controls are concerned, researches are mostly aimed at error and fraud detection. The main limitations of the research were the small sample, the time taken to collect internal control reports from other companies to measure internal control weaknesses. Thus, future research should create an indicator capable of measuring the internal control weaknesses of organizations, as well as the extent of the used sample, bearing in mind the need not only for the audit opinion report, but also for the report of internal control aspects identified in their work.
REFERENCES
ASSAF NETO, Alexandro. Estrutura e análise de balanços: um enfoque econômico-financeiro. 10.ed. São Paulo: Atlas, 2012.
ASSAF, A. N. Valuation - Métricas de valor e Avaliação de Empresas. 2 ed. - São Paulo: Atlas, 2017.
ATTIE, W. Auditoria: conceitos e aplicações. 6. ed São Paulo: Atlas, 2011.
Barney, J. (2001). Resources-based theories of competitive advantage: A ten-year retrospective on the resource based view. Journal of Management, 27(6), 643-650.
Bhutta, N. T, e Hasan, A. Impact of Firm Specific Factors on Profitability of Firms in Food Sector. Open Journal of Accounting, 2013, 2, 19-25.
[image:6.595.61.529.157.195.2]BOYNTON, William C.; JOHNSON, Raymond N.; KELL, Walter G.; tradução José Evaristo dos Santos. Auditoria. São Paulo: Atlas, 2002.
Table 5. Multicollinearity Test – VIF Table
VIF Control Variables
FCI ROL NOM ROIC ROE
1.071716 1.107042 1.197210 1.498042 1.289764
Source: Elaborated by the authors.
Table 6. Multicollinearity Test – Condition Analysis
Analysis of Conditions Control Variables
FCI ROL NOM ROIC ROE
3,092.2628 339.1893 82.8420 8.9287 1.6272
Brigham, E.F., e Houston, J.F. Fundamentos da moderna administração financeira. Fundamentos da Moderna Administraçã Financeira. Trad.:Maria Imilda da Costa e Silva. Rio de Janeiro: Campus, 1999.
BRUNI, Adriano Leal. A análise contábil e financeira. 3.ed. São Paulo: Atlas, 2014.
Burja, C. Factors Influencing The Companies‘ Profitability. Annales Universitatis Apulensis Series Oeconomica, 13(2), 2011.
CAMARGOS, M. A.; BARBOSA, F. V. Análise do desempenho econômicofinanceiro e da criação de sinergias em processos de fusões e aquisições do mercado brasileiro ocorridos entre 1995 e 1999. Caderno de Pesquisas em Administração USP, São Paulo, v. 12, n. 2, p. 99-115, abr./jun. 2005.
Carvalho, A. R., e Vieira, E. T. V. A Importância da Auditoria Interna e do Controle Interno, na Redução de Fraudes nas Instituições Financeiras. REPAE – Revista Ensino e Pesquisa em Administração e Engenharia. Volume 1, número 2 – 2016.
CFC - CONSELHO FEDERAL DE CONTABILIDADE. NBC TA 265 – Comunicação de deficiências de Controle Interno. Disponível em: Acesso em
Colares, O. M., e Silva, J.L. A Implantação de Controle Interno Adequado às Exigências da Lei Sarbanesoxley em empresas brasileiras - Um Estudo de Caso. Revista Base (Administração e Contabilidade) da UNISINOS, vol. 4, núm. 2, mayo-agosto, 2007, pp. 160-170.
COSO. Internal Control — Integrated Framework: An Implementation Guide for the Healthcare Provider Industry. 2019
COSO. Internal Control — Integrated Framework: Executive Sumamary. September, 1992.
Filho, R.A., Jacques, E. A., e Marian, P. D. O controle interno como ferramenta para o sucesso empresarial. Revista
Eletrônica de Contabilidade. v. 2, n. 1 (2005).
Gujarati, D. N., & Porter, D. C. 2011. Econometria Básica. 5. ed. Porto Alegre.
HANSEN, Don R.; MOWEN, Maryanne M. Gestão de custos: contabilidade e controle. Tradução Robert Brian Taylor. São Paulo: Editora Pioneira, 2001.
IUDÍCIBUS, Sérgio de. Análise de custos: uma abordagem quantitativa. São Paulo: Editora Atlas, 2000.
Maia, M. S et al. Contribuição Do Sistema De Controle Interno Para A Excelência Corporativa. Revista Universo Contábil, ISSN 1809-3337, Blumenau, v. 1, n. 1, p 54 – 70, jan./abr. 2005
MARION, José Carlos. Análise das demonstrações contábeis: contabilidade empresarial. 6.ed. São Paulo: Atlas, 2010. 289.
OLIVEIRA, L. M.; et al. Curso básico de auditoria. 2. ed. São Paulo: Atlas, 2008.
PASIN, R. M. Fusões e aquisições na indústria de alimentos do Brasil: um estudo sobre a gestão financeira das empresas. In: BUSINESS ASSOCIATION OF LATIN AMERICAN STUDIES, 26., 2002, Flórida (USA). Anais... Flórida: BALAS, 2002.
Popa, A., e Ciobanu, Radu. The Financial factors that Influence the Profitability of SMEs. International Journal of Academic Research in Economics and Management Sciences. July 2014, Vol. 3, No. 4.
Ribeiro, O. M. Estrutura e análise de balanços. 12. ed. - São Paulo: Saraiva Educação, 2018.
Salman, A. K., e Yazdanfar, D. Profitability in Swedish Micro Firms: A Quantile Regression Approach. International Business Research. Vol. 5, Nº 8, 2012.
WERNKE, Rodney. Gestão Financeira: Ênfase em Aplicações e Casos Nacionais. Rio de Janeiro: Saraiva, 2008.
Yazdanfar, D. (2013), "Profitability determinants among micro firms: evidence from Swedish data", International Journal of Managerial Finance, Vol. 9 No. 2, pp. 151-160.