N O T E
Open Access
Trophic position and diet shift based on
the body size of
Coreoperca kawamebari
(Temminck & Schlegel, 1843)
Jong-Yun Choi
*, Seong-Ki Kim, Jeong-Cheol Kim and Jung-Do Yoon
Abstract
Background:Fish body size is a major determinant of freshwater trophic interactions, yet only a few studies have explored the relationship between the fish body size and trophic interactions in river upstream. In this study, we investigated the relationship between the body size and trophic position (TP) ofCoreoperca kawamebari(Temminck & Schlegel, 1843) in an upstream of the Geum River.
Results:A stable isotope analysis (based onδ15N) was used to determine the TP based on the body size ofC. kawamebari. The regression analysis (n= 33,f= 63.840,r2= 0.68) clearly showed the relationship between the body length and TP ofC. kawamebari. The TP ofC. kawamebariwas clearly divided by body size into the following classes: individuals of size < 10 cm that feed on insects and individuals of size > 10 cm feed on juvenile fish. This selective feeding is an evolutionarily selective tendency to maximize energy intake per unit time. Furthermore, the diet shift ofC. kawamebariwas led by different spatial distributions. The littoral zone was occupied by individuals of size < 10 cm, and those of size > 10 cm were mainly in the central zone. The littoral zone can be assumed to be enriched with food items such as ephemeropterans and dipterans.
Conclusion:The TP ofC. kawamebari, as a carnivorous predator, will have a strong influence on biotic interactions in the upstream area of the Geum River, which can lead to food web implication.
Keywords:Aquatic plant, Carnivorous fish, Freshwater food web, Stable isotope, Trophic guild
Background
In freshwater ecosystems, moving in and out of animal populations is strongly influenced by the interaction between biological communities (Thevenon et al., 2011; Craig et al., 2017). Biological interactions, such as com-petition and predation, have the potential to influence these fundamental demographic parameters and deter-mine the trophic position (TP) of organisms (Brett and Goldman1997). Animal community with a high TP (i.e., predator) regulates the distribution and population size of low level (i.e., prey) communities (Sih et al. 1985; Royauté and Pruitt2015). Empirical studies investigating the determinants of community structure have shown that predation is one of the major influencing forces within a freshwater community (Power 1992; Stoks and
McPeek2003). In particular, the influence of community structure on predation in freshwater ecosystems has been well documented between fish and zooplankton communities (Aksnes et al. 2004; Hintz and Relyea 2017). Therefore, understanding the ecological role of organisms based on biological interactions is essential for a wide range of ecological studies. Moreover, the TP of an organism provides the framework for studies on cascading trophic interactions (Parker and Schindler 2006; Post et al. 2008) and ecological energetics and efficiency (Shurin and Seabloom2005).
Freshwater fish play important roles as top consumers utilizing food sources such as zooplankton, invertebrates, and juvenile fish. Some studies have suggested the influ-ence of prey community distribution by fish predation (He and Kitchell 1990; Barnes et al. 2010; Kai and Marsac 2010). Fish predators have shown non-random consumption of available prey, which might result from differences in prey visibility, capture rate, and food
© The Author(s). 2019Open AccessThis article is distributed under the terms of the Creative Commons Attribution 4.0 International License (http://creativecommons.org/licenses/by/4.0/), which permits unrestricted use, distribution, and reproduction in any medium, provided you give appropriate credit to the original author(s) and the source, provide a link to the Creative Commons license, and indicate if changes were made. The Creative Commons Public Domain Dedication waiver (http://creativecommons.org/publicdomain/zero/1.0/) applies to the data made available in this article, unless otherwise stated.
* Correspondence:[email protected]
preference (Figueiredo et al. 2015). Prey size has been the primary variable considered in studies on selectivity of fish (Gliwicz et al. 2010; Holmes and McCormick 2010). The variation in the length of fish and prey influ-ences the relationship between foraging selectivity and relative prey size. This prey selectivity for large size leads to diet shift in accordance with the growth stage of fish, and consequently, adult fish are in a high TP as piscivor-ous predator in freshwater ecosystems (Szedlmayer and Lee2004). However, a shift in fish diet depends not only on the body size, but also on food composition and abundance in a habitat. Duffy et al. (2010) suggested that the large mouse bass displays apparent diet shift between invertebrates and juvenile fish in accordance with spatial and temporal distribution of prey items. Although ani-mals spend considerable time feeding, and their foraging success is essential for reproductive success and fitness, it is often difficult to quantify foraging in free-living aquatic organisms. Furthermore, the diet shift of fish leads to their ambiguous ecological role in a freshwater food web.
Stable isotopes can be used as natural tracers to help monitor the foraging history of fish. The natural stable isotopic composition of animals is determined by their diets. Isotopic variations are passed up the food web as animals accumulate tissue C and N from their diets. Most studies on stable isotopes have focused on determining the influence of potential food source on predator in freshwater food webs (Brooke et al. 2010; McCauley et al. 2012), but natural isotopic tracers can also be used to monitor animal behavior. For example, animals feeding in some locations acquire a unique diet shift in foods, resulting in the assimilation of different average isotopic compositions.
We hypothesized that the utilization of food source by C. kawamebari differs according to their body size and
that it could influence the TP and ontogenetic diet shift pattern. The primary objective of our study was to understand the TP and diet shift of the carnivorous fish, C. kawamebari (Temminck & Schlegel 1843) using a stable isotope analysis. Furthermore, the interaction be-tween animal community based on the TP and diet shift of C. kawamebari is discussed. This study will advance our current understanding of the ecological role of C. kawamebari, which was newly discovered or translo-cated in the upstream region of the Geum River.
Results and discussion
TP and diet shift ofC. kawamebari
We used a stable isotope to analyze 33 individuals of different body sizes among a total of 89 C. kawamebari individuals collected during the fish survey. The body size of 89 C. kawamebari was within the range of 2.3– 14.7 cm; individuals of diverse body sizes were observed. In empirical studies, considering C. kawamebari have shown body size less than 15 cm, the size range of collectedC. kawamebariindicates that they were present in all life stages (Kim et al. 2012). The results also indi-cated that the newly discovered C. kawamebari in the upstream area of the Geum River has a stable settlement and continued population growth.
Kim et al. (2012) suggested that C. kawamebari com-monly plays a role as a top predator that utilizes insects and juvenile fish as a food source within the freshwater food web. Among trophic guilds, detritivores had the lowest mean TP (2~3) followed by omnivores (2~4), in-sectivores (3~5), and piscivores (3~5) (Vander Zanden et al., 1997; Rybczynski et al. 2008; Ou et al. 2017). In this study, the TP ofC. kawamebarireflected the trophic position proposed by previous studies. The results of the stable isotope analysis revealed that C. kawamebari
mostly depended on insects such as ephemeropterans and dipterans, but some individuals consumed small fish such asPungtungia herziandCoreoleuciscus splendidus.
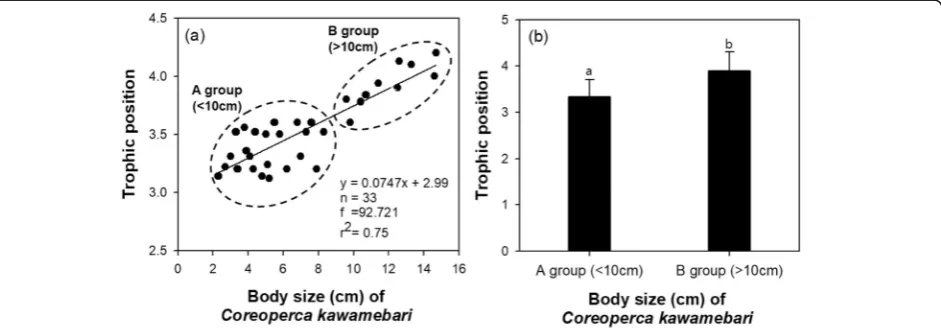
Prey selectivity ofC. kawamebaridepends on its body size (Fig.1). The regression analysis (Fig.2a;n= 33,f= 92.721, r2 = 0.75) clearly showed the relationship between the body length and TP of C. kawamebari. The TP of C. kawamebari showed a tendency of in-crease with inin-crease in body size. The small-sized fish (< 10 cm) stage showed characteristics of insectivores, but shifted to piscivorous in the adult stage. Based on this diet shift, C. kawamebari was clearly divided into the following groups: individuals of size < 10 cm that feed on insects and individuals of size > 10 cm that feed on small-sized prey fish. TP between two groups were display statistical different (one-way ANOVA, DF = 1,F = 148.2,p< 0.0001).
The food preference of C. kawamebari was different between the two groups divided based on the body size
(Fig. 2).Coreoperca kawamebariindividuals of size < 10 cm mainly depended on ephemeropterans and dipterans as a food source, but individuals of > 10 cm tended to depend on small-sized fish. This diet shift has also been found in previous studies on food selectivity of other fish species. Barbiero et al. (2009) suggested that planktivorous fish often choose large prey items and drive the structure of plankton populations toward smaller taxa or smaller individuals within a taxon. Juvenile fish are less likely than adults to choose the largest available prey items (Galarowicz et al.2006; Garrido et al.2007), and the pre-ferred prey size increases with fish size (Kawakami and Tachihara 2005). Selective feeding is an evolutionarily selected tendency to maximize energy intake per unit time (Schoener1987). Thus, when fish increase in size, the size spectrum of ingested prey increases; it is probably an effect of low gape size (Nilsson and Brönmark,2000). For small 0-group fish, it is important to consider that the size of the mouth might restrict their potential diet.
Spatial distribution related to body size ofC. kawamebari
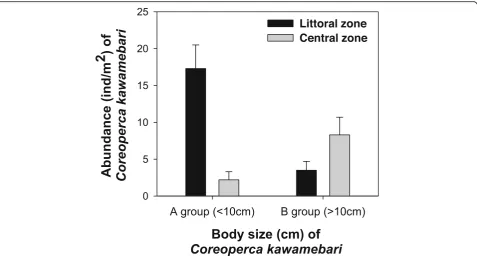
The two groups of C. kawamebari divided based on its body size were present in the littoral and central zones (Fig. 3). Individuals of size < 10 cm were mainly distrib-uted in the littoral zone, and the central zone supported a relatively small number of those individuals. On the contrary, individuals of > 10 cm were mainly distributed in the central zone. This different spatial distribution of C. kawamebarirelated to body size is strongly associated with prey selectivity. The river littoral zone is supported by high abundance of aquatic plants and creates a heterogeneous microhabitat in the water, providing a suitable food supply for fish (O’Hare et al. 2006, Smokorowski and Pratt 2007). This different spatial distribution of food source related to aquatic plants ex-plains why C. kawamebariindividuals of body size < 10 cm are mainly distributed in the littoral zone. Previous studies (Heck and Crowder 1991; Warfe and Barmuta 2004; Choi et al.2014) have also reported that the food source (zooplankton and small-sized invertebrate) mainly consumed by juvenile fish of size < 10 cm is abundant in spaces extensively covered by aquatic plants. Moreover, a complex habitat structure created by plants significantly regulates biological interactions such as predation and competition (Jeppesen et al. 2012; Hansen et al. 2013), and consequently, it contributes to the continuous population growth of juvenile fish. On the contrary, individuals of size > 10 cm might have diffi-culty in securing sufficient food source in the littoral zone from the perspective of optimal energy acquisition for a given cost. The foraging activity of individuals of size > 10 cm were clearly decreased in littoral area was highly covered by aquatic plants. However, they do not migrate far from the littoral area, and they utilize food
source originated from the littoral area. The central area far from the littoral area was supported by low individ-uals of C. kawamebari. In relation to this, a previous study suggests that piscivorous fish have restricted for-aging activity under high abundance of aquatic plants, and thus, they are distributed mainly in the open water zone or edge of plant beds (Jacobsen and Perrow1998). Consequently, a high abundance of aquatic plants in the littoral zone can largely contribute to the sustainable growth and development of youngC. kawamebari.
Influence of native fish community on size-dependent trophic level ofC. kawamebari
A previous study has reported that C. kawamebari is distributed across a narrow area of Tamjin, Youngsan, and Nakdong Rivers in South Korea (Kang et al. 2013). This distribution pattern is less effective for fish commu-nity, even though they are carnivorous predators. In the upstream area of the Geum River, however, we consid-ered that the invasion and stable settlement ofC. kawa-mebari affected in distribution and interaction of native fish community. Although small individuals consumed invertebrates in the littoral area, adults stayed in the middle of the river and utilized the large food source such as small-sized fish. Generally, ontogeny and inva-sion of individuals in ecosystems lead to changes in the food web structure, which strongly influences trophic levels. It has often been proposed that the characteristic-ally high levels of recruitment variability that exists in most freshwater systems can obscure any evidence of
underlying processes, and there has been considerable debate over whether post settlement or pre settlement processes result in the patterns observed in community structure (Vilà et al.2011). There has also been consid-erable debate over whether “top-down” or “bottom-up” processes are important in governing these communities (Power 1992; Shurin et al. 2012). Based on these find-ings, the presence of top predators, such asC. kawame-bari, leads to potentially limited available food resources and thus factors affecting abundance will cascade up the system and affect population dynamic of prey and their predators (Zavaleta et al.,2001). Therefore, translocation and sustainable population growth ofC. kawamebari in the Geum River can influence not only the food web change upstream of the Geum River, but also the ecosys-tem health. Based on the data obtained in this study, there is a need to continuously monitor the effects ofC. kawamebari distribution and trends in the ecosystem food web.
Conclusions
The isotope values ofC. kawamebarishowed its TP as a piscivorous fish. The TP of C. kawamebari showed in-creasing tendency with increased body size (regression analysis; n = 33, f= 63.840, r2= 0.68), showing mainly piscivorous characteristics in the adult stage. The TP of C. kawamebariwas clearly divided by body size as indi-viduals of size < 10 cm that feed on insects and individ-uals of size > 10 cm that feed on small-sized fish. This diet shift is an evolutionarily selected tendency to
maximize energy intake per unit time. Such prey selectiv-ity of C. kawamebari led to an apparent variation in spatial distribution in the upstream area of the Geum River. The littoral zone supported individuals of size < 10 cm, and individuals > 10 cm in size were mainly distrib-uted in the central zone. Empirical studies suggested that the littoral zone is enriched with food items such as ephe-meropterans and dipterans preferred by juvenile fish. As a carnivorous predator, the TP ofC. kawamebariinfluences biotic interactions in the upstream area of the Geum River and is expected to lead to food web changes.
Methods
Site description and fish collection
The Geum River, which has an approximate drainage area of 9885 km2, is one of the largest river systems in South Korea and is approximately 394.79 km long. Water flow in the upstream area of the Geum River is regulated by the Youngdam Dam. The riversides were reorganized by the River Refurbishment Project in 2012; large areas of waterside have vanished due to the expan-sion of human society.
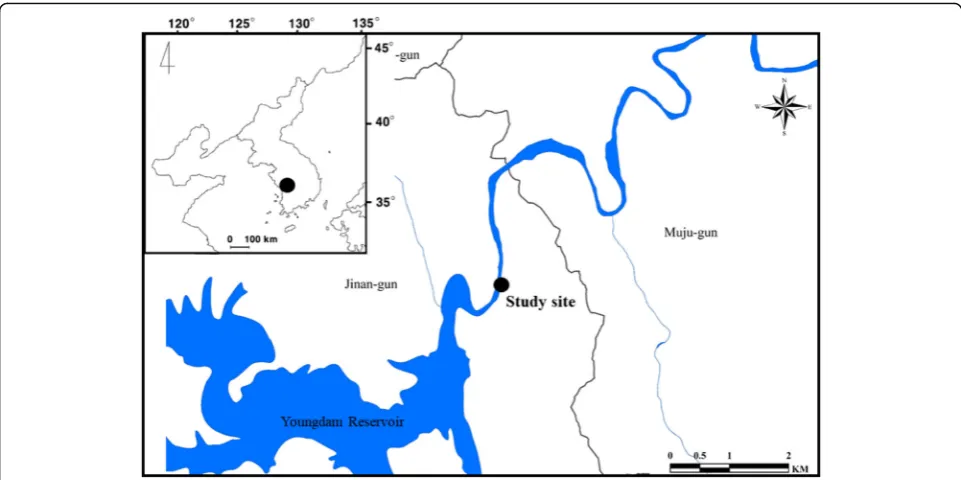
The study sites are the riverside areas located in the upstream region of the Geum River, 11 km downstream of the Youngdam Dam (Fig. 4). The fish were collected from late September to early October 2018 (over a period of 4 weeks). We randomly selected the following 12 sampling points in the study site considering the habitat characteristics ofC. kawamebari: six points were in the littoral zone (area covered by aquatic plants) and
six were in the open water zone (area covered by boul-ders, and there are no plants). The sampling points were randomly selected based on virtual grids constructed over the map of the upstream region of the Geum River.
The target species C. kawamebari individuals were caught using cast nets (7 mm × 7 mm mesh size) and scoop net (5 mm × 5 mm mesh size). We used only scoop nets in the sampling points extensively covered by aquatic plants and boulders. In the other sampling points, the cast and scoop nets were used for 30 and 20 min, respectively. The body length (cm) of fish was measured after being classified and counted according to Kim and Park (2002). The body length was used to analyze the TP ofC. kawa-mebari. The influence of TP on the body size of C. kawamebariwas analyzed using a regression analysis. The individuals were divided by body size into two groups based on the TP and food utilization of C. kawamebari. We analyzed using ANOVA test the differences of TP between two groups related to body size of C. kawame-bari. All statistical analyses, including regression and ANOVA, were conducted using the statistical package SPSS version 20 (IBM Corp., Armonk, NY, USA).
To analyze the TP of C. kawamebari, we conducted additional collections on potential food sources in sam-pling points of collected C. kawamebari. Potential food collection was also conducted for approximately 30 to 40 min using a stainless steel sampler (200 mm diameter, 600-μm mesh size). The collected individuals were di-vided as four food sources such as ephemeropterans, dipterans, odonates, and juvenile fish.
Stable isotope analysis and trophic position calculation
To determine the TP of C. kawamebarion the gradient of body length, we implemented the stable isotope analysis. For the stable isotope analysis, the fish muscle tissue samples were obtained from the flank near the base of the dorsal fin. We were permitted by the Minis-try of Environment to obtain the tissue samples from the endangered species. Furthermore, we collected only little tissue (0.1~0.3 g) of dorsal fin to avoid the risk of an endangered species being injured or killed. Most of the individuals survived after the removal of tissue, and there was nothing wrong with swimming. The fish tissue samples were preserved in salt and processed following the method of Arrington and Winemiller (2002). In the laboratory, the tissue samples were soaked in distilled water for 4–5 h, rinsed, and dried in an oven at 60 °C for 48 h (Post 2002). Dried samples were ground into fine powder using an electronic ball-mill grinder, and then stored in clean glass vials. Subsamples were weighed (0.02 mg) and packed into Ultra-Pure tin capsules. All samples were freeze-dried and homogenized using a mortar and pestle, and the powdered samples were maintained frozen (−70 °C) until further analysis. Car-bon and nitrogen isotope ratios were determined by continuous-flow isotope mass spectrometry. Dried samples were combusted in an elemental analyzer (EuroVector), and the resultant gas (CO2 and N2) was
introduced into an isotope ratio mass spectrometer (CF-IRMS, Isoprime Micromass) via continuous flow, with helium gas as a carrier. Data are expressed as the relative concentration (‰) difference between sample and conventional standards of Pee Dee Belemnite carbonate (PDB) for C and atmospheric N2, according to
the following equation:
δXð Þ ¼‰ Rsample=Rstandard
−1
1000
where X is 13C or 15N and R is the 13C:12C or 15N:14N ratio. Secondary standard of known relation to the inter-national standard was used as a reference material. The standard deviations of δ13C and δ15N for 20 replicate analyses of the peptone standard were ± 0.1 and ± 0.2 (‰), respectively.
Stable isotopes of N have been widely used to estimate the TP of target fish species in food web studies (Post 2002). The TP of C. kawamebari was calculated using the following formula (Zanden and Rasmussen 1999): TP = (δ15Nconsumers − δ15Nfood source)/2.5 + 1, where
δ15
Nconsumers is δ15N signature of C. kawamebari and
δ15
Nfood source is the mean δ15N value of potential food
sources, namely, ephemeropterans, dipterans, odonates, and juvenile fish. The value of 2.5 represents trophic fractionation of the isotopic ratio (the shift that occurs in material between its ingestion by a consumer and its
assimilation in the consumer’s tissue); here, we used the mean trophic fractionation value derived from a meta-analysis of laboratory feeding studies involving diverse metazoan consumers (Vanderklift and Ponsard 2003). When calculating the TP of C. kawamebari, the mean δ15
N of primary production sources was based on sam-ples obtained from the same survey locality where the fish were collected.
To determine the potential food sources predomin-antly assimilated by C. kawamebari, we calculated the proportional contribution of each food source using an isotope mixing model (Parnell et al.2010). The fraction-ation factors (average ± SD) used for C. kawamebari were 0.5 ± 0.2‰ for δ13C and 3.0 ± 0.5‰ for δ15N (Syväranta et al.2011).
Abbreviations
SD:Standard deviation; SPSS: Statistical Package for Social Science; TP: Trophic position
Acknowledgements
This research was supported by the Basic Science Research Program through the‘Research and evaluation of ecological space in the Youngsan and Seomjin River’funded by the Ministry of Environment (No. 20190107B4A-00).
Authors’contributions
JYC and SKK participated in the design of the study, field survey, and data analyses and wrote the manuscript draft. JCK and JDY conceived the study, participated in the design of study, edited the manuscript draft, and secured the funding. All authors read and approved the final manuscript.
Funding
This research was supported by the Basic Science Research Program through the‘Research and evaluation of ecological space in the Youngsan and Seomjin River’funded by the Ministry of Environment (No. 20190107B4A-00).
Availability of data and materials
The datasets generated during and/or analyzed during the current study are available from the corresponding author on reasonable request.
Ethics approval and consent to participate Not applicable.
Consent for publication Not applicable.
Competing interests
The authors declare that they have no competing interests.
Received: 11 September 2019 Accepted: 9 December 2019
References
Aksnes DL, Nejstgaard J, Sædberg E, Sørnes T. Optical control of fish and zooplankton populations. Limnol Oceanogr. 2004;49(1):233–8.
Arrington DA, Winemiller KO. Preservation effects on stable isotope analysis of fish muscle. Trans Am Fish Soc. 2002;131(2):337–42.
Barbiero RP, Balcer M, Rockwell DC, Tuchman ML. Recent shifts in the crustacean zooplankton community of Lake Huron. Can J Fish Aquat Sci. 2009;66(5):816–28.
Barnes C, Maxwell D, Reuman DC, Jennings S. Global patterns in predator–prey size relationships reveal size dependency of trophic transfer efficiency. Ecology. 2010;91(1):222–32.
Brett MT, Goldman CR. Consumer versus resource control in freshwater pelagic food webs. Science. 1997;275(5298):384–6.
Henderson petrelPterodroma atrata: evidence from the field, stable isotopes and population modelling. Endanger Species Res. 2010;11(1):47–59. Choi JY, Jeong KS, Kim SK, La GH, Chang KH, Joo GJ. Role of macrophytes as
microhabitats for zooplankton community in lentic freshwater ecosystems of South Korea. Ecol Inform. 2014;24:177–85.
Craig LS, Olden JD, Arthington AH, Entrekin S, Hawkins CP, Kelly JJ, Kennedy TA, Maitland BM, Rosi EJ, Roy AH, Strayer DL, Tank JL, West AO, Wooten MS. Meeting the challenge of interacting threats in freshwater ecosystems: a call to scientists and managers. Elem Sci Anth. 2017;e5.
Duffy EJ, Beauchamp DA, Sweeting RM, Beamish RJ, Brennan JS. Ontogenetic diet shifts of juvenile Chinook salmon in nearshore and offshore habitats of Puget Sound. Trans Am Fish Soc. 2010;139(3):803–23.
Figueiredo BR, Mormul RP, Benedito E. Structural complexity and turbidity do not interact to influence predation rate and prey selectivity by a small visually feeding fish. Mar Freshw Res. 2015;66(2):170–6.
Galarowicz TL, Adams JA, Wahl DH. The influence of prey availability on ontogenetic diet shifts of a juvenile piscivore. Can J Fish Aquat Sci. 2006; 63(8):1722–33.
Garrido S, Marçalo A, Zwolinski J, Van der Lingen CD. Laboratory investigations on the effect of prey size and concentration on the feeding behaviour of Sardina pilchardus. Mar Ecol Prog Ser. 2007;330:189–99.
Gliwicz ZM, Szymanska E, Wrzosek D. Body size distribution inDaphnia populations as an effect of prey selectivity by planktivorous fish. Hydrobiologia. 2010;643(1):5–19.
Hansen GJ, Hein CL, Roth BM, Vander Zanden MJ, Gaeta JW, Latzka AW, Carpenter SR. Food web consequences of long-term invasive crayfish control. Can J Fish Aquat Sci. 2013;70(7):1109–22.
He X, Kitchell JF. Direct and indirect effects of predation on a fish community: a whole-lake experiment. Trans Am Fish Soc. 1990;119(5):825–35.
Heck KL, Crowder LB. Habitat structure and predator-prey interactions in vegetated aquatic systems. In: Bell SS, McCoy ED, Mushinsky HR, editors. Habitat structure. Dordrecht: Springer; 1991. p. 281–99.
Hintz WD, Relyea RA. A salty landscape of fear: responses of fish and zooplankton to freshwater salinization and predatory stress. Oecologia. 2017;85(1):47–156. Holmes TH, McCormick MI. Size-selectivity of predatory reef fish on juvenile prey.
Mar Ecol Prog Ser. 2010;399:73–283.
Jacobsen L, Perrow MR. Predation risk from piscivorous fish influencing the diel use of macrophytes by planktivorous fish in experimental ponds. Ecol Freshw Fish. 1998;7(2):78–86.
Jeppesen E, Sondergaard M, Sondergaard M, Christofferson K. The structuring role of submerged macrophytes in lakes (Vol. 131). Springer Science & Business Media; 2012.
Kai ET, Marsac F. Influence of mesoscale eddies on spatial structuring of top predators’communities in the Mozambique Channel. Prog Oceanogr. 2010; 86(1-2):214–23.
Kang H, Park MY, Jang JH. Effect of climate change on fish habitat in the Nakdong River watershed. J Korea Water Resour Assoc. 2013;46(1):1–12. Kawakami T, Tachihara K. Diet shift of larval and juvenile landlocked Ryukyu-ayu
Plecoglossus altivelis ryukyuensisin the Fukuji Reservoir, Okinawa Island. Japan. Fish Sci. 2005;71(5):1003–9.
Kim CK, Lee TW, Lee KT, Lee JH, Lee CB. Nationwide monitoring of mercury in wild and farmed fish from fresh and coastal waters of Korea. Chemosphere. 2012;89(11):1360–8.
Kim IS, Park JY. Freshwater fish of Korea. Ltd., Korea: Kyo-Hak Publishing Co.; 2002. McCauley DJ, Young HS, Dunbar RB, Estes JA, Semmens BX, Micheli F. Assessing
the effects of large mobile predators on ecosystem connectivity. Ecol Appl. 2012;22(6):1711–7.
Nilsson PA, Brönmark C. Prey vulnerability to a gape-size limited predator: behavioural and morphological impacts on northern pike piscivory. Oikos. 2000;88(3):539–46.
O’Hare MT, Baattrup-Pedersen A, Nijboer R, Szoszkiewicz K, Ferreira T. Macrophyte communities of European streams with altered physical habitat. In: Furse MT, Hering D, Brabec K, Buffagni A, Sandin L, Verdonschot PFM, editors. The ecological status of european rivers: evaluation and intercalibration of assessment methods. Dordrecht: Springer; 2006. p. 197–210.
Ou C, Montaña CG, Winemiller KO. Body size–trophic position relationships among fishes of the lower Mekong basin. Royal Society open science. 2017; 4(1):e160645.
Parker BR, Schindler DW. Cascading trophic interactions in an oligotrophic species-poor alpine lake. Ecosystems. 2006;9(2):157–66.
Parnell AC, Inger R, Bearhop S, Jackson L. Source partitioning using stable isotopes: coping with too much variation. PLoS One. 2010;5:e9672. Post DM. The long and short of food-chain length. Trends Ecol Evol. 2002;
17:269–77.
Post DM, Palkovacs EP, Schielke EG, Dodson SI. Intraspecific variation in a predator affects community. Ecology. 2008;89(7):2019–32.
Power ME. Top-down and bottom-up forces in food webs: do plants have primacy. Ecology. 1992;73(3):733–46.
Royauté R, Pruitt JN. Varying predator personalities generates contrasting prey communities in an agroecosystem. Ecology. 2015;96(11):2902–11. Rybczynski SM, Walters DM, Fritz KM, Johnson BR. Comparing trophic position of
stream fishes using stable isotope and gut contents analyses. Ecol Freshw Fish. 2008;17(2):199–206.
Schoener TW. A brief history of optimal foraging ecology. In: Schoener T.W. (1987) A brief history of optimal foraging ecology. In: Kamil AC, Krebs JR, Pulliam HR, editors. Foraging behavior. Boston: MA. Springer; 1987. p. 5-67. Shurin JB, Clasen JL, Greig HS, Kratina P, Thompson PL. Warming shifts top-down
and bottom-up control of pond food web structure and function. Philos Trans R Soc B: Biol Sci. 2012;367(1605):3008–17.
Shurin JB, Seabloom EW. The strength of trophic cascades across ecosystems: predictions from allometry and energetics. J Anim Ecol. 2005;74(6):1029–38. Sih A, Crowley P, McPeek M, Petranka J, Strohmeier K. Predation, competition,
and prey communities: a review of field experiments. Annual Reviews inc. 1985;16(1):269–311.
Smokorowski KE, Pratt TC. Effect of a change in physical structure and cover on fish and fish habitat in freshwater ecosystems–a review and meta-analysis. Environ Rev. 2007;15:15–41.
Stoks R, McPeek MA. Antipredator behavior and physiology determineLestes species turnover along the pond-permanence gradient. Ecology. 2003;84(12): 3327–38.
Syväranta J, Högmander P, Keskinen T, Karjalainen J, Jones RI. Altered energy flow pathways in a lake ecosystem following manipulation of fish community structure. Aquat Sci. 2011;73(1):79–89.
Szedlmayer ST, Lee JD. Diet shifts of juvenile red snapper (Lutjanus campechanus) with changes in habitat and fish size. Fishery Bulletin. 2004; 102(2):366–75.
Thevenon F, Graham ND, Herbez A, Wildi W, Poté J. Spatio-temporal distribution of organic and inorganic pollutants from Lake Geneva (Switzerland) reveals strong interacting effects of sewage treatment plant and eutrophication on microbial abundance. Chemosphere. 2011;84(5):609–17.
Vander Zanden MJ, Cabana G, Rasmussen JB. Comparing trophic position of freshwater fish calculated using stable nitrogen isotope ratios (δ15N) and literature dietary data. Can J Fish Aquat Sci. 1997;54(5):1142–58. Vanderklift MA, Ponsard S. Sources of variation in consumer-dietδ15N
enrichment: a meta-analysis. Oecologia. 2003;136:169–82.
Vilà M, Espinar JL, Hejda M, Hulme PE, Jarošík V, Maron JL, Pergl J, Schaffner U, Sun Y, Pyšek P. Ecological impacts of invasive alien plants: a meta-analysis of their effects on species, communities and ecosystems. Ecol lett. 2011;14(7):702–8.
Warfe DM, Barmuta LA. Habitat structural complexity mediates the foraging success of multiple predator species. Oecologia. 2004;141(1):171–8. Zanden MJV, Rasmussen JB. Primary consumerδ13C andδ15N and the trophic
position of aquatic consumers. Ecology. 1999;80:1395–404.
Zavaleta ES, Hobbs RJ, Mooney HA. Viewing invasive species removal in a whole-ecosystem context. Trends Ecol Evol. 2001;16(8):454–9.
Publisher’s Note