Themed Section: Science and Technology
Comparison and Performance Evaluation of ECG Classification
Techniques Trained with Shorter Database
Indasukshisha Wankhar, Ibalawanpynhun Wriang, Priya Debnath, Preetisha Bordoloi, R. P. Tripathi, Dinesh Bhatia*, Sristi Jha
Department of Biomedical Engineering, School of Technology, North Eastern Hill University, Shillong793022, Meghalaya, India
ABSTRACT
Diagnosis of cardiovascular diseases can be done effectively with the classification based on analysis of different electrocardiogram (ECG) features. Different algorithms for different data mining techniques have been put forward by the researchers for diagnosing the heart diseases. In our research we have compared three classification techniques namely, Pattern Recognition, Naive Bayes Classifier (NBC) and Support Vector Machine (SVM) in classification of different heart diseases. Based on the performance we have concluded that which one of the above techniques is much effective and accurate especially if a short database of ECG features is used for training the model. The data used in this study is collected from the cardiac patients from a hospital. The observations indicate that NBC is found to be more accurate and effective than SVM and Pattern Recognition when the model is trained by a sort training database.
Keywords: Electrocardiogram, Comparison, Artificial neural network, Naive Bayes Classifier, Support Vector Machine.
I.
INTRODUCTIONNow-a-days, people suffering from heart diseases are increasing at a faster rate. According to World Health Organization around 17.7 million people died from CVDs in 2015 accounting for 31% of all global deaths [1]. However, diagnosis at an early stage with a proper treatment can save a huge amount of lives but correct diagnosis of heart diseases at an initial phase is quite a challenging task because of various factors having complex inter dependence. Exact estimation of the risk factors associated with the heart diseases is equally important for diagnosis and treatment purposes [2].
ECG has been extensively used for diagnosing various heart conditions. The ECG is a graphical representation of the electrical activity of the heart
muscles (depolarisation and repolarisation) [2]. Classification of ECG into different heart diseases is a complex pattern recognition task and it can be successfully achieved by finding patterns in the ECG that can be differentiate effectively between the required heart diseases. Classification is achieved on the basis of the ECG parameters such as QRS complex, RR interval, R amplitude, ST height, T amplitude and P duration. A wide number of data mining techniques have been used by the researchers to assist healthcare practitioners for finding the effective accuracy in the diagnosis of heart disease. Decision Tree, Naïve Bayes, Neural Network, Genetic Algorithm, Support Vector Machine, and direct kernel self-organizing map are some techniques used so far in the diagnosis of heart disease.
classifying heart diseases, namely the Naïve Bayes classifier, Pattern Recognition and Support Vector Machine (SVM). Our main aim of the study is to find out the most suitable machine learning technique for a short database.
II.
METHODOLOGYFor recording of the ECG signal and SpO2 from the patients as well as from the healthy subjects we have used an Equivital EQ02 Life Monitor device. The device consists of a sensor electronics module (SEM) worn on the body connected to a fabric chest belt. The Equivital EQ02 Life Monitor provides two leads of ECG sharing a common reference electrode (Left Hand Front location).
Figure 1: Equivital Life Monitor
The database was created from recording the ECG signals of patients reported at the department of Cardiology, North Eastern Indira Gandhi Regional Institute of Health and Medical Sciences (NEIGRIHMS) Shillong, Meghalaya, India.
Procedure of collecting the data:
1. The Bluetooth dongle is connected to the personal computer (PC) via USB and the SEM is also connected to the PC via USB using the SEM to USB lead.
2. Appropriate sized sensor belt is fitted to the subject. The SEM is connected to the belt after inserting it into the pouch on the belt. The devices are connected to the labchart software through a Bluetooth device. The pulse monitor is worn on the left hand for recording SpO2 and blood pressure is also taken from the patients using a digital sphygmomanometer.
3. The Labchart software installed in the PC is opened and recording is done for two minutes by pressing the Start button. The patient is advised to relax while the data is recorded.
4. After the recording the data is saved and export as a text file with an appropriate name.
5. The data collected is analyzed in the labchart software itself in which all the different ECG features are obtained.
III.
METHODS OF CLASSIFICATIONA. Pattern Recognition:
In the last 15 years, neural networks have been very popular in ECG classification [3].It is a mathematical or computational models of the nervous system, to study and apply the computational concept. The computational system is inspired by structure, processing method and learning ability of a biological brain. For developing different pattern it also depends upon the different type of activities of organism . Pattern Recognition is powerful for its ability to detect patterns and extract data structure without expert knowledge. It is the most important part of image processing. It is the study of machines that how it works and it used to distinguish between the patterns of interest from the background. They implemented an artificial neural network (ANN) trained for further result. It gives the 99.01% of accuracy for the classification [3].
Characteristics of pattern recognition:
1. Cognitive architecture: It gives the theory result of structure of human brain. It also states the activity of neurons which are organised in the manner of excitatory and inhibitory signals through which signals can be exchanged between them.
Supervised learning: both the output and input signals are provided to the circuit. According to the targeted outputs all the adjustments are done to the system to make closer to the desired output.
Unsupervised learning: it affects the neural network to get the targeted output in general the targets shows the result as same as the inputs[4]
Basically Neural Network can be group in different ways. They are just a simple group of neurons by creating layers and interconnections. The information’s that we get from the neurons are collected in human mind and further it is processed in dynamic, interactive and self-organizing way[6].
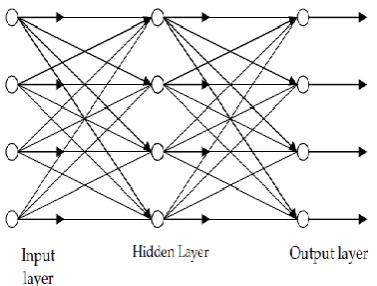
In a general architecture of ANN there are 3 types of layers for network applications: input, hidden and output. The input layers receive all the data from input files and the output layer sends the information to the secondary computer devices. Between these two layers there are hidden neurons. All the signals are received from the neurons which are found in hidden layer. After completing the process the signals are passed to the output layer [5].
Figure 2 : General architecture of three layered ANN [6]
There are 4 steps for the implementation of pattern recognition to classify the ECG data:
Import the data set to workspace of MATLAB R2017a.
Let categorised the data set as input and target.
Use ANN tool for creating and training the pattern recognition model.
Get the final result of confusion graph
B. Naive -Bayes classifier:
Naive-Bayes classification method is named after Thomas Bayes who proposed the Bayes theorem which has been studied extensively since 1950s.It represents a supervised learning method as well as a statistical method for the classification and it assumes that the value of a particular feature is independent irrespective to any other features. Naïve-Bayes classifier is an easy and fast method to predict the class of dataset and is very useful for large dataset. It also performs the multi class prediction and real time prediction. Till now most of the application of the method is reported for text classification, spam filtering and also for sentiment analysis [7].
Naïve-Bayes classifier classifies the data in two simple steps: training step and the prediction step. In training step, the training data is used and an estimation of the probability distribution parameter is obtained and assuming that the predictors are conditionally independent given the class. In prediction step it computes the posterior probability of sample belonging to each class of the test data and then it classifies these data according the largest posterior probability [8].
The word naive means assumption of all variables Xi, where Xi is the distribution variable of set of n variables{X1, X2...Xn}. Let Xi be denoted as πi set of nodes.
In conditional probability distribution, the common formula is:
P(X1,...Xn)=Πni=1 P(Xi|πi)………(1)
According to the joint distribution: P(C,X1, . . . ,Xn)= Πni=1 P(Xi|C). When the variable C is observed in training data, Naïve-Bayes classifier can be used for classification after that it can be clustered [9]
C. Support Vector Machine
Support Vector Machine (SVM) also known as Support Vector Network first introduced by Vladimir Vapnik, in 1995.[10], [11]. SVM is originally designed for Binary Classification and it is a kernel-based supervised learning algorithm. It is a popular class of machine learning algorithms which specialized in both classification and pattern recognition purposes. SVMs are based on the idea of creating a hyperplane between datasets to show which class it belongs to. For best result the hyper plane should have the largest distance to the nearest training data points of any class. The support vectors are the data points that are nearest to the separating hyperplane. However, SVM has been widely used and studied for ECG beat classification and optimization. SVM is very accurate and works better on smaller and cleaner datasets because for a larger data sets the training time can be high [12][13].
Let there be m training examples (xi,yi),yi=
Then there exist a hyper plane w.x+b=0, which separates the positive and negative training examples using the decision function :
( )
( ) ( ) {
(2)
Where w and b are known as weight vector and bias respectively. We see that yi(wixi + b)>0,for all i=1,2,3,...,m.[10][11].
Figure 3 shows the maximum-margin linear classifier which is an example of a simple linear SVM classifier
with the maximum margin. The data points on the margin are called the support vectors.
Figure 3 : Maximum Margin Hyper plane[10]
For mathematical calculations we have implicitly define (w, b) such that (w.x + b)=1 for positive class and (w.x+b)= -1 for negative class(figure 3). From figure there are two hyperplane and the space between the two hyperplane is called the margin band, given by which is to be maximize or minimize
subject to the constraints :
yi(wixi + b) 1, for all
i=1,2,3,...,m ………(3)
The primal problem is converted into dual problem and applying Karush-Kuhn-Tucker(KKT) conditions we obtain
∑ ….………... (4)
Using the kernel function decision, function becomes
( ) (∑ ( ) )
……… (5) Maximize w( )=∑ ∑ ( ), for all i= 1,2,3,....,m ……… (6) with ∑ = 0
IV.
RESULTS AND DISCUSSIONSA
B
C
Figure 4 : Receiver Operating Characteristics of A. Pattern Recognition B. NBC C. SVM
In the fig 4 , the coloured lines represents ROC curves which is a plot of true positive rate versus false
positive rate as the activation threshold is varied, therefore, the value of TPR should be higher as possible ideally it should be 1 that is 100 % TPR. As per the results obtained and presented in figure 5(A), (B), and (C) Pattern Recognition shows 80% sensitivity and 80% specificity, NBC shows 99% sensitivity and 90% of specificity and SVM shows 90% sensitivity and 90% of specificity. Also upon observing the area under the curve for each classifier, NBC covers the maximum area under the curve. These findings indicate that NBC performance better in classification of ECG signals as compared to the SVM and Pattern recognition.
In the fig 4 , the coloured lines represents ROC curves which is a plot of true positive rate versus false positive rate as the activation threshold is varied, therefore, the value of TPR should be higher as possible ideally it should be 1 that is 100 % TPR. As per the results obtained and presented in figure 5(A), (B), and (C) Pattern Recognition shows 80% sensitivity and 80% specificity, NBC shows 99% sensitivity and 90% of specificity and SVM shows 90% sensitivity and 90% of specificity. Also upon observing the area under the curve for each classifier, NBC covers the maximum area under the curve. These findings indicate that NBC performance better in classification of ECG signals as compared to the SVM and Pattern recognition.
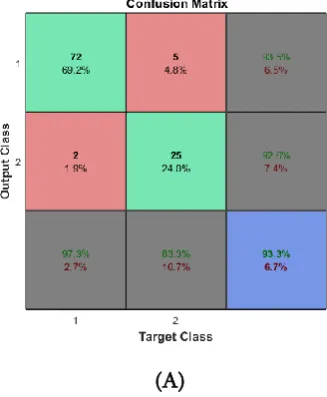
The confusion matrices for all three techniques are shown in figure 5 (A), (B) and (C). To test the trained classifiers, we have used a dataset which consists of 104 instances out of which 74 are patients and 30 are healthy subjects. From figure 5A we can conclude that pattern recognition was able to successfully classify 72 patients and 25 healthy subjects out of which 2 patients and 5 healthy subjects are misclassified respectively. Figure 5B presents confusion matrix for NBC, NBC successfully classifies all 74 patients and 27 healthy subjects out of which 3 healthy subjects are misclassified. Similarly confusion matrix shown in figure 5C shows the classification results in case of SVM classifier, SVM successfully classify all 73 patients and 25 healthy subjects out of which 1 patient and 5 healthy subjects are misclassified. Thus, pattern recognition, NBC and SVM accuracy comes out to be 93.3%, 97.1% and 94.2% respectively. Therefore we can conclude that NBC is a better classifier than pattern recognition and SVM. The result is summarised in table 1.
V.
CONCLUSION
In our study, we have found that Naïve Bayes Classifier performs better when assumption of independence holds but in real life, it is almost impossible to get a set of predictors which are completely independent and NBC works best with larger datasets. Pattern recognition and
SVM can be used for both regression and classification purposes. However, Pattern recognition works best with more data points (more inputs) whereas SVM works well on larger datasets as training time with SVMs can be high for larger datasets.
METHOD PATTERN RECOGNITION NBC SVM
CLASS NORMAL ABNORMAL NORMAL ABNORMAL NORMAL ABNORMAL
CLASSIFIED 25 72 27 74 25 73
MISCLASSIFIED 5 2 3 0 5 1
PERCENTAGE ACCURACY(%)
93.3 97.1 94.2
VI.
REFERENCES
1. World Health Organization. "Cardiovascular diseases (CVD). Fact sheet# 317." WHO Media centre, http://www. who. int/mediacentre/factsheets/fs317/en/index. html, accessed Dec 9 (2013).
2. Resources for Types of Arrythmia Diseases. http://www.heart.org/HEARTORG/Conditions/ Arrhythmia/Arrhythmia_UCM_00
2013_SubHomePage.jsp 3.
http://www.cse.unr.edu/-bebis/MathMethods/NNs/lecture.pdf
4. Computational techniques for ECG analysis and interpretation in light of their contribution to medical advances: AuroreLyon1 , Ana Minchole'1 , Juan Pablo Marti'nez2 , Pablo Laguna2 and Blanca Rodriguez1
5. https://cs.stanford.edu/people/eroberts/courses/s
oco/projects/neural-networks/History/history1.html
6. https://www.omicsonline.org/telecommunicatio n/artificial-neural-network-latest-research-papers.php
7. Naive Bayes Models for Probability Estimation: Daniel Lowd [email protected]
Pedro Domingos
Department of Computer Science and Engineering, University of Washington, Seattle, WA 98195-2350, USA
8. Analytical Modeling and Artificial Neural Network (ANN) Simulation of Current-Voltage Characteristics in GrapheneNanoscroll Based Gas Sensors M. Khaledian1 Razali Ismail1 Elnaz Akbari1
9.
http://www.let.rug.nl/-tiedeman/ml05/03_bayesian_handout.pdf 10. BernhardScholkopf, and Alexander J. Smola.
Learning with kernels: support vector machines, regularization, optimization, and beyond. MIT press, 2001.
11. Burges C., "A tutorial on support vector machines for pattern recognition", In "Data Mining and Knowledge Discovery". Kluwer Academic Publishers, Boston, 1998, (Volume 2).
12. V. Vapnik, S. Golowich, and A. Smola. Support vector method for function approximation, regression estimation, and signal processing. In M. Mozer, M. Jordan, and T. Petsche, editors, Advances in Neural Information Processing Systems 9, pages 281-287, Cambridge, MA, 1997. MIT Press.

![Figure 3 : Maximum Margin Hyper plane[10]](https://thumb-us.123doks.com/thumbv2/123dok_us/9141163.1450481/4.595.322.543.84.257/figure-maximum-margin-hyper-plane.webp)