On a separating method for mixed-modes crack growth in
wood material using image analysis
R. Moutou Pitti1, F. Dubois2,a and O. Pop2
1Clermont Université, Université Blaise Pascal, Laboratoire de Mécanique et Ingénierie, EA 3867, BP 206, 63000 Clermont-Ferrand, France
2
GEMH – GCD Laboratory, Limoges University, Civil Engineering, 19300 Egletons France
Abstract. Due to the complex wood anatomy and the loading orientation, the timber elements are subjected to a mixed-mode fracture. In these conditions, the crack tip advance is characterized by mixed-mode kinematics. In order to characterize the fracture process function versus the loading orientation, a new mixed-mode crack growth timber specimen is proposed. In the present paper, the design process and the experimental validation of this specimen are proposed. Using experimental results, the energy release rate is calculated for several modes. The calculi consist on the separation of each fracture mode. The design of the specimen is based on the analytical approach and numerical simulation by finite element method. The specimen particularity is the stability of the crack propagation under a force control.
1 Introduction
In timber structure design, the negligence of mixed-mode effects may lead to significant errors in strength prediction, and mixed-mode fracture criteria are thus of great importance for predicting failure of notched wood components. Generally the timber elements are subject to complex loadings and the fracture process is characterized by the mixed mode crack propagation. The fracture process often results from the addition of opening and shear modes (i.e. mode I and II). In this context, the propose of the study is to characterise the energy release rate in mixed mode configurations. In order to evaluate the part of each mode it’s necessary to developed analytical and experimental tools. From these observations the aims of this study is the development of a timber specimen allowing the characterization of mixed modes fracture parameters.
The paper is structured in three parts. In the first section the compliance method is recalled. This method is employed to calculate the energy release rate during the crack propagation. The M integral approach is based on conservative law and a combination of real and virtual displacement fields. Actually, this integral is only performed in a finite element approach. The numerical data are obtained by finite element method. In this context the present paper deals with an experimental application of this non-path dependent. Next, the material and methods employed in experimental
a
e-mail : [email protected]
tests were presented. In order to characterise the specimen crack growth stability the experimental test are performed for different load configuration. The experimental tests use several methods in order to characterise the mechanical behaviour of the specimen and the fracture parameters. In the third part, the experimental results are compared with the numerical approach. In order to validate the specimen design, the experimental results are confronted with numerical data.
2 Invariant integral and Compliance method
According to a finite element approach, the mixed mode fracture separation is usually obtained by using an invariant integral M developed by [1], [2], for isotropic media. The separation method involves the use of virtual displacement fields (i) and virtual stress tensors (
ij()) in accordance
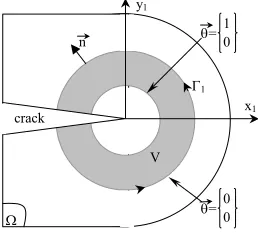
with the virtual work principle. Its application for timber elements requests an adaptation of the method for orthotropic material. The main idea is the introduction of singular displacements and stresses proposed by Shih [3] in the crack tip vicinity, [4]. For plane configurations, the M form is recalled in the next equation in which designates the surface domain (Fig. 1):
( ) ( )
, , ,
1
d 2
u v
i j i k j
ij ij k
M v u
The virtual work principle requests a coupling between virtual fields and real mechanical fields defined, in terms of displacements and stresses, by ui and (
ij(u)), respectively. A virtual integration
crown is materialized by a continuously and derivable vector field (Fig.1) [5]. Boundary conditions are noted in Fig. 1. In the crack tip vicinity, the M can be defined according to a physical interpretation. Mechanical fields are locally by a specific singular form for stresses according to stress intensity factors. For plane configurations, uK1 and uK2 designate SIF for open and shear
modes, respectively. Displacements are obtained by employing reduced elastic compliance C1 and
C2. In this context, the total energy release rate is written as follow:
2
21 2
1 8 2 8
uK uK
G C C
The formulation (2) can be adapted for the M-integral as follow:
1 1 2 2
1 8 2 8
uK vK uK vK
M C C
Where: K1 and K2 are two arbitrary virtual stress intensity factors in accordance with ij().
Judicious choices for K1 and K2 allows the isolation of open and shear modes as follow :
1 2
1
1
1; 0 8
v v
uK M K K
C
And:
1 2
2
2
0; 1 8
v v
uK M K K
C
= 0 0
= 1 0
1
V n
x1
y1
crack
Fig. 2: Integral domain for M
Finally, the contribution of expressions (2), (3) and (4) enables us to define two specific parts of the energy release rate : its open part G1 and its shear part G2 such as:
2 11 1 8
uK
G C
22
2 2 8
uK
G C
This energy approach can now be completed by experimental considerations. In this context, it is usually compliance method, which allows the determination of the dissipated energy during the crack growth process. According to an energy release rate concept, the compliance method is capable of calculating the critical value of the energy release rate noted Gc. The method is based on
the determination of the external work variation during the crack tip advance. Considering a fracture test in which we control external force F and it correspondent displacement point U, we can define the global stiffness R and the global compliance C such as:
F R U or U C F
Supposing a stationary crack, the external work is defined by:
2 2
1 1 1
2 2 2
ext
W F U C F R U
The critical energy release rate allows the evaluation of the dissipated energy due to the crack length evolution a. Its variation results in a disruption of the external work such as:
1 ext
c
W G
b a
In the same time, the crack tip advance instant is characterized by critical values of force and displacement, Fc and Uc, respectively. In order to isolate energy variation (8), the compliance method
2 2
2 2
c c
c
F U
U R F C
G
b a b a
We can note that compliance method is not able to separate mixed modes. So, considering equations (2), (5) and (9) we can extrapolate this expression as follow:
1 2
c
G G G
With:
1 2
1 2 1
c c
G G
G G
Where: Gc1 and Gc2 are critical value of the energy release rate for pure open and shear modes,
respectively.
3 Material and methods
3.1 2MCG specimen
As indicated in introduction, our study regroups two approaches. Firstly, the experimental specimen design is definite using the numerical simulations. In the other hand the analytical and numerical approaches are validated by the experimental tests using the experimental specimen. The detail of mixed mode specimen geometry is developed in [6]. Let us present a brief remind of specimen design.
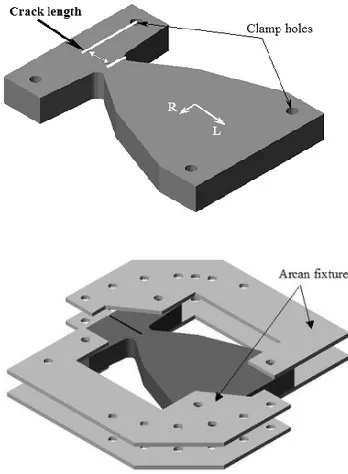
The mixed mode fracture response measurements were performed using Mixed-Mode Crack Growth (2MCG) specimen. This geometry answers has two criterions: a stable crack growth in mixed-mode and the absence of stress singularities in connection element vicinity. For this reason a specimen, with variable inertia, is proposed. Note that, this geometry regrouped two specimen geometries: DCB - Double Cantilever Beam [7] and CTS - Compact Tension Shear [8]. The crack growth stability is obtained by employing an increase of the transverse section versus the crack length. The stress singularities are limited by a reinforcement of fixations. The geometry, retained for experimental tests, is represented in Fig. 2. The loading orientation is realised using Arcan fixture made in PVC. Various force orientations allow different mixed mode ratios. The loading is applied according to the holes machined on PVC the fixtures.
Fig. 2. 2MCG specimen with Arcan Fixtures.
Moreover, the initial cracks don’t exceed the crack growth stability observed by numerical simulations. The preliminary analysis by finite element method puts in evidence an interval of crack growth stability different for each mode. Remind that the crack growth stability during the test is necessary in order to have the energy release evolution function for several crack length. Due to the wood anatomy and the behaviour of the material, which is enough uncertain, the interesting of the specimen is the possibility to characterise fracture parameters for several crack length.
Concerning the characteristic specimen preparation, the exterior surface of sample is painted in white in order to have a good contrast between the crack line and the specimen background. After the test, the crack length is measured on the image records during tests. The specimen form is characterised by parallel rings in R direction. In this case, the crack tip propagation is localised in L direction.
In order to correlate the load-displacement evolution and the crack length, the video acquisition is synchronised with the testing machine data acquisition.
3.1 Setup
A Zwick testing machine was used under displacement control (0,01 mm/s). The experimental machine is an electromechanical press with mobile cross-bare. The inferior part of specimen is interconnected with the immobile table. Beside, the superior part is interconnected with the cross-bare. These aspects are very importants, in order to definite the boundary conditions of the numerical approach.
Specimen with Arcan fixtures
Ring’s orientation
Experimental setup
Fig. 3: 2MCG specimen configuration with Arcan Fixtures and experimental setup
4 Results and discussion
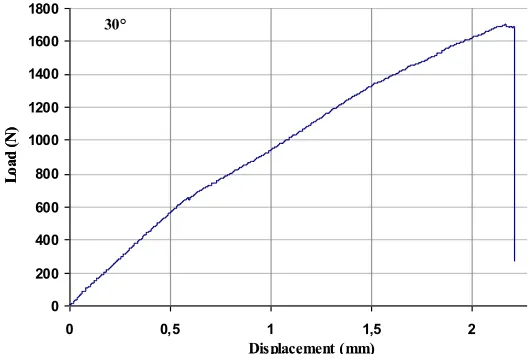
Several tests are realized for different mixed mode ratios. The global mechanical behaviour of sample during the test can be evaluated across the experimental evolutions of load and the displacements plotted in Figs. 4 and 5. Experimental results are obtained for an angle between the crack line and the load of 30° and 60°. By analysing the load-displacement evolution, we can observe the presence of loading picks associated to the crack advance. Another aspect illustrated by the load displacement evolution is the stability of the crack growth. This aspect is very important in order to characterize the fracture process in mixed mode. These results confirm, beside, the specimen design retained for the experimentation.
Note that the plot illustrated in Figs. 4 and 5 are recorded by the electromechanical press devices, and the displacement in abscises corresponding to the cross-bare. In order to evaluate the crack advancement for each pick, images recorded during the test are analysed, and the crack length is measured using these same images.
0 200 400 600 800 1000 1200 1400 1600 1800
0 0,5 1 1,5 2 2,5
Displacement (mm)
Lo
ad
(
N
)
30°
0 200 400 600 800 1000 1200 1400 1600 1800
0 0,5 1 1,5 2 2,5
Displacement (mm)
Lo
ad
(
N
)
30°
0 200 400 600 800 1000 1200 1400 1600 1800
0 0,5 1 1,5 2 2,5 3
Displacement (mm) Lo ad ( N ) 60° 0 200 400 600 800 1000 1200 1400 1600 1800
0 0,5 1 1,5 2 2,5 3
Displacement (mm) Lo ad ( N ) 60°
Fig. 5:Load-displacement evolution in mixed mode for an angle between the loading and the crack line of 60°
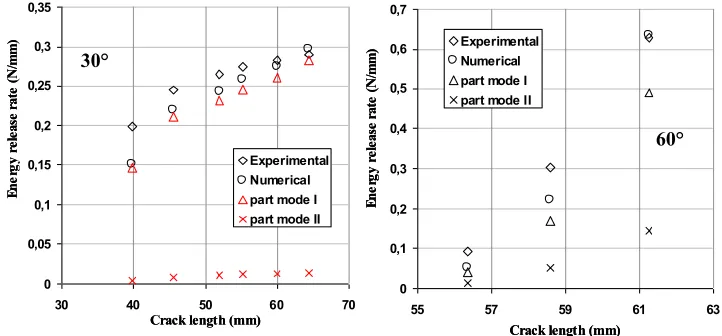
Using the experimental results the energy release rate is calculated for each case 30 and 60° (see Fig. 6). The comparison between the experimental results and the numerical values show a good agreement.
In order to evaluate the energy release rate by numerical approach a finite element mesh is generated using the experimental specimen dimensions. The numerical analysis is realized in 2D. The boundary conditions associated to numerical model corresponding to experimental conditions.
Crack length (mm)
En er gy r el ea se r at e (N /m m ) 0 0,1 0,2 0,3 0,4 0,5 0,6 0,7
55 57 59 61 63
Experimental Numerical part mode I part mode II
Crack length (mm)
En er gy r el ea se r at e (N /m m ) 0 0,1 0,2 0,3 0,4 0,5 0,6 0,7
55 57 59 61 63
Experimental Numerical part mode I part mode II
0 0,05 0,1 0,15 0,2 0,25 0,3 0,35
30 40 50 60 70
Experimental Numerical part mode I part mode II
Crack length (mm)
En er gy r el ea se r at e (N /m m ) 0 0,05 0,1 0,15 0,2 0,25 0,3 0,35
30 40 50 60 70
Experimental Numerical part mode I part mode II
Crack length (mm)
En er gy r el ea se r at e (N /m m ) 30° 60°
Fig. 6:Load-displacement evolution: mixed mode at 30°
Using the analytical expressions of integral invariant, presented in the first part of paper, the energy release rate is separated. In this case the part of energy in opening mode and in shear mode are calculated for each mixed mode.
This approach allowing the analyse of each mode the contribution in the fracture process. By analyzing the two evolutions, we can remark that the opening mode dominated, and the amplitude of shear mode is most important.
4 Conclusion
In this study, a new specimen design and a new technique is proposed in order to characterize the mixed mode fracture in wood specimen. The experimental specimen requests a stable crack growth and the possibility to alternate the mixed mode ratios. For these reasons the specimen design regroups the DCB (Double Cantilever Beam) and the CTS (Compact Tension Shear) specimens. The experimental tests are performed using the specimen made of pseudotsuga menziesii.
Experimental tests realized for different mixed mode ratios confirm the specimen design and the stability interval of the crack propagation observed in the numerical approach. The crack propagation stability is lighted in the load displacement curves observed during the test. Using the experimental results and the compliance method, the energy release rate is evaluated. The experimental compliance is calculated using the load-displacement curve. The crack length associated to load-displacement evolution is measured using the recorded images during the test. In order to calculate the energy release rate, the crack length associated for each compliance value is measured.
The comparison between experimental results and numerical data obtained by finite element method show a good agreement. This aspect allows to valid our approach for the viscoelastic orthotropic media loaded in mixed mode.
In perspective the separation of the mixed mode using the compliance method is conceivable. In order to separate the mixed mode the optical full fields are considerate.
References
1. F. H. K. Chen, R. T. Shield: Conservation laws in elasticity of the J-integral type, Journal of Applied Mechanics and Physics, 28 (1), 1-22, (1977).
2. J. F. Yau, S. S. Wang, H. T. Corten: A mixed mode crack analysis of isotropic solids using conservation laws of elasticity, ASME J. Appl. Mech., 47, 335-341, (1980).
3. G. C. Sih, Strain energy density factor applied to mixed mode crack problems, Int. J. Fracture 17, 305–321, (1974).
4. R. Moutou Pitti, F. Dubois, C. Petit, N. Sauvat: Fracture of wood under mixed mode loading: numerical approach by the M-integral, 9th World Conference of Timber Engineering (WCTE), Portland OR, USA, August 6-10, (2006).
5. P. Destuynder, M. Djaoua, S. Lescure : Quelques remarques sur la mécanique de la rupture élastique, Journal de Mécanique Théorique et Appliquée, 2, (1) : 113-135, (1983).
6. R. Moutou Pitti, F. Dubois, O. Pop : Sur une éprouvette assurant la stabilité de la propagation de fissure en mode mixte dans le matériau bois, Comptes Rendus Mécanique, 336 (9), 744-749, (2008).
7. F. Dubois, C. Chazal, C. Petit : Viscoelastic crack growth process in wood timber: an approach by the finite element method for mode I fracture, International Journal of Fracture. 113 (4): 367-388, (2001).
8. H. A. Richard. A new compact shear specimen. International Journal of Fracture, 17(5), 105-107, (1981)
9. S.-C. Yen, J.N. Craddock, K.T. Teh : Evaluation of a modified arcan fixture for the in-plane shear test of materials, Experimental Techniques, 12(12), 22-25, (2008).