48 |
P a g e
COMPARATIVE STUDY OF BUILDING
PERFORMANCES WITH AND WITHOUT SHEAR
WALL USING PUSHOVER ANALYSIS
Miss. Nair Veena V.
1, Prof. Dr. D. N. Shinde
21
Author Student, Department of Civil Engineering, P.V.P.I.T. Budhgaon, Maharashtra, (India)
2
Associate Professor, Department of Civil Engineering, P.V.P.I.T. Budhgaon, Maharashtra, (India)
ABSTRACT
Pushover analysis is a static, nonlinear procedure using simplified nonlinear technique to estimate seismic
structural deformations. It is an incremental static analysis used to determine the force-displacement
relationship, or the capacity curve, for a structure or structural element. The analysis involves applying
horizontal loads, in a prescribed pattern to the structure incrementally, i.e. pushing the structure and plotting the
total applied shear force and associated lateral displacement at each increment, until the structure or collapse
condition. In technique a computer model of the building is subjected to a lateral load of a certain shape (i.e.,
inverted triangular or uniform). The seismic response of RC building frame in terms of various parameters such
as base shear, storey displacement, performance point and the effect of earthquake forces on multi storey
building frame with the help of pushover analysis is carried out in this paper. In the present study a building
frame without shear wall and with shear wall is designed as per Indian standard i.e. IS 456:2000 and IS
1893:2002. The main objective of this study is to check the kind of performance a building can give when
designed as per Indian Standards and also to determine the effect of providing shear wall to building frame. The
pushover analysis of the building frame is carried out by using structural analysis and design software SAP
2000.
Keywords: Base Shear, Capacity Curve, Non Linear Static Analysis, Performance Point,
Pushover Analysis.
I. INTRODUCTION
Pushover analysis is an approximate analysis method in which the structure is subjected to monotonically
increasing lateral forces with an invariant height-wise distribution until a target displacement is reached.
Pushover analysis consists of a series of sequential elastic analysis, superimposed to approximate a
force-displacement curve of the overall structure. A two or three dimensional model which includes bilinear or
tri-linear load-deformation diagrams of all lateral force resisting elements is first created and gravity loads are
applied initially. A predefined lateral load pattern which is distributed along the building height is then applied.
The lateral forces are increased until some members yield. The structural model is modified to account for the
reduced stiffness of yielded members and lateral forces are again increased until additional members yield. The
process is continued until a control displacement at the top of building reaches a certain level of
deformation or structure becomes unstable. The roof displacement is plotted with base shear to get the global
49 |
P a g e
For obtaining performance point a building frame of G+10 floors is considered. It is consisting of two bays in
both the directions. The spacing along X and Y directions is 5.0m and the storey height is taken as 3.0m. The
frame is located in seismic zone III.
2.1 Design Data
Live load : 4.0 kN/m2 at typical floor
: 1.5 kN/m2 on terrace
Floor finish : 1.0 kN/m2
Water proofing : 2.0 kN/m2
Earthquake load : As per IS – 1893 : 2002 (part I)
Type of soil : Type II, Medium As per IS – 1893
Storey height : 3.0 m
Walls : 230mm thick masonry wall
Seismic zone : Zone III
2.2 Description of Building Frame
No. Bays along X axis : 2
No. Of bays along Y axis : 2
Spacing along X axis : 5.0m
Spacing along Y axis : 5.0m
Storey height : 3.0m
No. Of floors : G + 10
Size of column : 600×500mm
Size of beam : 300× 600mm
Slab : 150mm thick
50 |
P a g e
2.4 Elevation of Building Frame without and With Shear Wall
III. CALCULATION OF DESIGN BASE SHEAR
For obtaining the performance point of the building frame in terms of base shear the design base shear is
calculated for determining the safety of the frame. The intersection of demand spectrum and capacity spectrum is
the performance point of the structure. If the base shear at performance point is greater than design base shear
then the structure is safer. The design base shear is calculated as per IS: 1893:2002 [2] as follows:
The seismic weight of building is found to be 25630.55 kN (Wi)
The infill walls in upper floors may contain large openings, although the solid walls are considered in load
calculations. Therefore, fundamental time period (T) is obtained by using the following formula
Ta = 0.075 h0.75 (IS 1893 Part 1:2002, Clause 7.6.1)
Ta = 0.075 x (30)0.75
Ta = 0.96 sec.
Zone factor, Z = 0.16 for Zone III (IS: 1893 Part1:2002, Table 2)
Importance factor, I = 1.0,
Medium soil site and 5% damping
51 |
P a g e
In similar manner the designed base shear is calculated in case of building frame without shear wall and is found
to be 516.58 kN
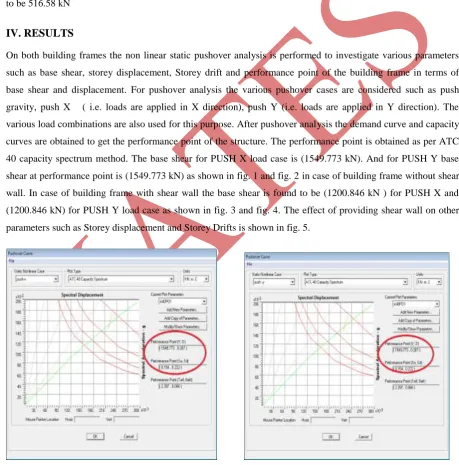
IV. RESULTS
On both building frames the non linear static pushover analysis is performed to investigate various parameters
such as base shear, storey displacement, Storey drift and performance point of the building frame in terms of
base shear and displacement. For pushover analysis the various pushover cases are considered such as push
gravity, push X ( i.e. loads are applied in X direction), push Y (i.e. loads are applied in Y direction). The
various load combinations are also used for this purpose. After pushover analysis the demand curve and capacity
curves are obtained to get the performance point of the structure. The performance point is obtained as per ATC
40 capacity spectrum method. The base shear for PUSH X load case is (1549.773 kN). And for PUSH Y base
shear at performance point is (1549.773 kN) as shown in fig. 1 and fig. 2 in case of building frame without shear
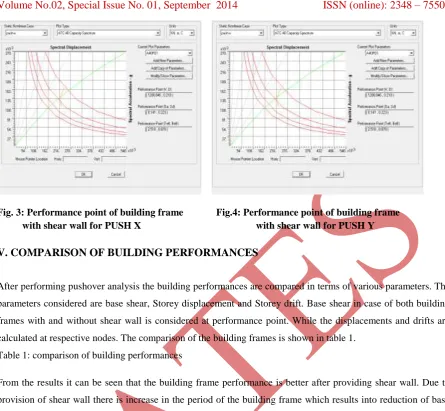
wall. In case of building frame with shear wall the base shear is found to be (1200.846 kN ) for PUSH X and
(1200.846 kN) for PUSH Y load case as shown in fig. 3 and fig. 4. The effect of providing shear wall on other
parameters such as Storey displacement and Storey Drifts is shown in fig. 5.
52 |
P a g e
Fig. 3: Performance point of building frame Fig.4: Performance point of building frame with shear wall for PUSH X with shear wall for PUSH Y
V. COMPARISON OF BUILDING PERFORMANCES
After performing pushover analysis the building performances are compared in terms of various parameters. The
parameters considered are base shear, Storey displacement and Storey drift. Base shear in case of both building
frames with and without shear wall is considered at performance point. While the displacements and drifts are
calculated at respective nodes. The comparison of the building frames is shown in table 1.
Table 1: comparison of building performances
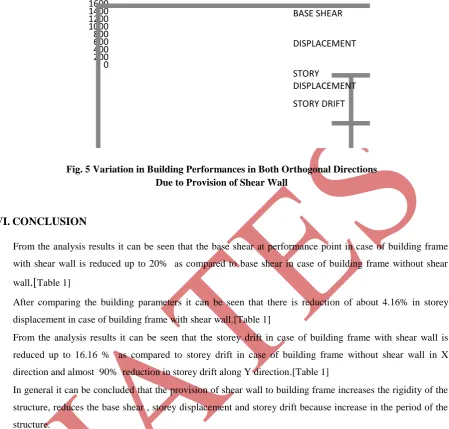
From the results it can be seen that the building frame performance is better after providing shear wall. Due to
provision of shear wall there is increase in the period of the building frame which results into reduction of base
shear. The variation in above parameters is as shown in figure below.
Parameter
Frame without shear wall Frame with shear wall
X Y X Y
Base shear at performance
point 1549.773 kN 1549.773 kN 1200.846 kN 1200.846 kN
Displacement at
performance point 0.267 m 0.267 m 0.210 m 0.210 m
Storey displacement 0.48 m 0.48 m 0.46 m 0.0032 m
Storey drift
0.06 m 0.06 m 0.05 m 0.003 m
Spectral acceleration
0.154 m/s2 0.154 m/s2 0.141 m/s2 0.141 m/s2
Spectral displacement
53 |
P a g e
Fig. 5 Variation in Building Performances in Both Orthogonal Directions Due to Provision of Shear Wall
VI. CONCLUSION
From the analysis results it can be seen that the base shear at performance point in case of building frame with shear wall is reduced up to 20% as compared to base shear in case of building frame without shearwall
.[
Table 1] After comparing the building parameters it can be seen that there is reduction of about 4.16% in storey
displacement in case of building frame with shear wall.[Table 1]
From the analysis results it can be seen that the storey drift in case of building frame with shear wall is
reduced up to 16.16 % as compared to storey drift in case of building frame without shear wall in X
direction and almost 90% reduction in storey drift along Y direction.[Table 1]
In general it can be concluded that the provision of shear wall to building frame increases the rigidity of the
structure, reduces the base shear , storey displacement and storey drift because increase in the period of the
structure.
REFERENCES
[1] Konuralp Girgin and Kutlu Darılmaz “Seismic Response of Infilled Framed Buildings Using Pushover
Analysis.” Department of Civil Engineering, Istanbul Technical University, 34469, Maslak, Istanbul,
Turkey. .(December 2007) volume 54, number 5.
[2] IS:456:2000 Plain and Reinforced code of practice, IS: 875 Code of practice for design loads,
IS:1893(Part-1):2002 Criteria for earth quake resistant design of structure, IS:13920:1993 Ductile detailing
of RCC structure subjected to earth quake force.
[3] Chopra A.K. and Goel R.K. “A Modal Pushover Analysis Procedure to Estimating Seismic Demands for
Buildings: Theory and Preliminary Evaluation”, PERR Report, Pacific Earthquake Engineering Research
Centre, University of California (2001/03)
[4] Dalal Sejal P., Vasanwala S.A., Desai A.K “Performance based seismic design of structure: A review”,
54 |
P a g e
[5] Mohammed S. Al-Ansari), “Formulating building response to Earthquake loading”, International Journal
of Civil and Structural Engineering (2011) Vol. 2, No 1.
[6] Sudipta Chattopadyaya and Amlan K. Sengupta “Modelling of tall walls for pushover analysis of
reinforced concrete buildings” , The Indian concrete journal ,(2011), pp 7-14
[7] Y. Fahjan, B. Doran, B. Akbas, J. Kubin “ Pushover analysis for performance based – seismic design of RC
frames with shear walls”, 15 WCEE, (2012)
[8] Murthy C.V.R, Learning earthquake design
[9] Agrawal, Shrikhande Mansih, Earthquake resistant design of structures
[10] Chopra A.K., Dynamics of structures- theory and applications to earthquake engineering
[11] Peter Fajafar M.EERI “A non linear analysis method for Performance based seismic design”, Earthquake