Abstract—This paper presents the experiment of a new form herringbone ribbed cable dome with the diameter of 10m. The new configuration improves the rigidity of the dome when compared to the traditional cable domes. The aim of this paper is to demonstrate the basic static performance of the new form cable dome. The assembly and prestressing procedures of the dome were conducted at first. Then, the structural behavior of the model during the full span loading test was investigated. The experimental results of structural displacements and internal forces were compared with the numerical results obtained by ANSYS software. The comparison results indicated that the static behavior of the dome can be well predicted by numerical simulation. Furthermore, the half span loading test demonstrated that asymmetric load distribution had an adverse effect on the cable dome's performance.
Index Terms—Asymmetric load, herringbone ribbed cable dome, static experiment, mechanical behaviors, tensegrity.
I. INTRODUCTION
Inspired by the Fuller’s innovative ideas about tensegrity, Geiger et al. [1] proposed cable dome and took it into practice in Seoul, Korea, starting a new era for long span structures. The light weight, economical and highly efficient advantages of cable domes have attracted large number of designers’ attention since the 1990s. The booming new forms of cable domes extend the scope of application and constantly improve the performance of this cable-strut form structures. In addition to the Geiger form, the existing structural forms include Levy form [2], Kiewitt form, bird’s nest form, some hybrid forms [3], etc. Nowadays, a lot of different forms cable domes have been developed into practical engineering around the world, such as Redbird Arena in Bloomington-Normal, IL, Georgia dome in Atlanta, GA, and Amagi Dome in Japan.
Recently, a new form cable dome named herringbone ribbed cable dome was proposed by Dong and Liang [4]. The major difference between the new form cable dome with the previous traditional cable domes is that the design concept is not consistent with the idea of tensegrity from Fuller’s that the compression elements become small islands in a sea of continuous tension [5]. The traditional vertical strut in the cable dome is replaced by two herringbone struts. So, isolated compression islands are connected to each other to become a ring-shaped compression continent.
Over the past years, some experimental tests have been carried out on different type cable domes, such as Geiger form [6], [7], Levy form [8], Kiewitt form [9], etc. But the
Manuscript received September 15, 2016; revised November 15, 2016. This work was supported by the National Natural Science Foundation of China (Grant No. 51278461 and 51578492).
Xiaotian Liang is with the Space Structures Research Center, Zhejiang University, Hangzhou 310058, China (e-mail: [email protected]).
experiment of herringbone ribbed cable dome has not been conducted yet. To have a better understanding and obtain the basic mechanical property of the new form cable dome, a 10m span model was established by the space structure research center in Hangzhou, China. The design, assembly and prestressing procedures were illustrated in this paper. The experimental results of full span loading test and half span loading test were achieved to obtain the static behavior of the cable dome.
II. HERRINGBONE RIBBED CABLE DOME MODEL
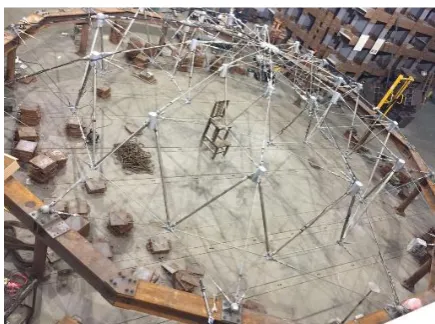
The experimental model of the herringbone ribbed cable dome was shown in Fig. 1. The model comprised 8 parts: external columns, external beams, spherical support joints, cable-support joints, ridge cables, diagonal cables, hoop cables and compressed struts.
Fig. 1. Experimental model of herringbone ribbed cable dome.
A. Configurations
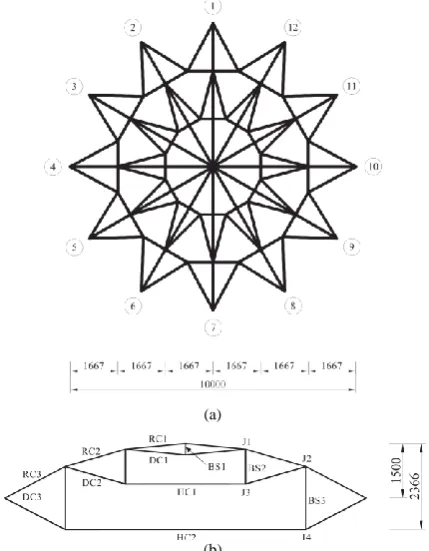
The span of the dome was 10m and the height from the top to the support was 1.5m. A total of 98 cables and 49 struts were applied in the structure. 12 outer nodes were connected to the pin supports and the remaining 62 free nodes were designed as hinge joints. The detailed layout was shown in Fig. 2.
B. Section Parameters and Mechanical Properties
The section parameters and length for cables and struts used for the cable dome were shown in Table I.
The section parameter of all strand ropes was 1×19, which means the cable was made up of 1 strand with 19 wires. 304 stainless steel round tubes were chosen as compressed struts. The Young’s modulus of elasticity of struts and cables were
Es=206,000 N/mm2 and Ec=160,000 N/mm2, respectively. The ultimate tensile strength of the cables was 1,670 MPa.
Static Experiment of Herringbone Ribbed Cable Dome
(a)
(b)
Fig. 2. Geometry of the cable dome: (a) plan view; (b) section view.
TABLE I: PARAMETERS OF CABLES AND STRUTS
Title Member type Type Length
(mm)
Ridge cable (RC)
RC1 Φ12 1433
RC2 Φ12 1520
RC3 Φ12 1651
Diagonal cable (DC)
DC1 Φ10 1383
DC2 Φ10 1616
DC3 Φ10 1873
Hoop cable (HC) HC1 Φ12 5363
HC2 Φ16 10722
Brace strut (BS)
BS1 Φ120×5 300
BS2 Φ25×3 863
BS3 Φ45×3 1636
C. Design of Free Joints
For the herringbone ribbed cable dome, as the number of members connected to a same joint was relatively more than that of other types of cable domes, the joint should be carefully designed to make the intersection of the related members converge at one point. There were four kinds of free joints in the cable dome. The upper joints connected cables and struts were designed as casting cylindrical joints. The members could be embedded to the joint through ear plates on the joint, while the lower joints were steel cable clamp connection. The hoop cables could be fixed in the cable clamps by anti-sliding screws. The detailed design of the joints was illustrated in Fig. 3.
D. Lateral Support System
The boundary constraint condition of the theoretical model was designed to be fixed pin support. To accomplish the purpose of pin joints for the model, the lateral support system consisted of external columns, external beams and spherical support joints. The section of the column was circular steel tube Φ159×10. 12 H-beams, whose section were H250×250×20×20, were used as external beams. Two adjacent beams were connected by flanges with high strength bolts. The upper flange in the middle of the beam was
connected to the ball joint and the lower flange was bolted with vertical beams. The integral ring beam was utilized to balance the tension force on the ball joint. The lateral support system was shown in Fig. 4.
(a) (b) (c) (d)
Fig. 3. Details of free joints: (a) internal upper joint (J1); (b) external upper joint (J2); (c) internal lower joint (J3); (d) external lower joint (J4).
(a) (b) (c)
Fig. 4. Lateral support system: (a) lateral column; (b) lateral beam; (c) spherical support joint.
The design position and the practical measured position of the support joints were shown in Table II. The horizontal errors of span 1-7, 2-8, 3-9, 4-10, 5-11 and 6-12 were 0.029 m, 0.032 m, -0.005 m, -0.020 m, -0.058 m and -0.025 m, respectively. The maximum error was 0.58% of the structure span.
TABLE II: COORDINATES OF THE SUPPORTS
Support number Design coordinate (m) Actual coordinates (m) Vertical error (m)
x y z x y z
1 5.000 0.000 1.450 5.013 0.019 1.455 0.005 2 4.330 2.500 1.450 4.354 2.516 1.447 -0.003 3 2.500 4.330 1.450 2.512 4.322 1.450 0.000 4 0.000 5.000 1.450 0.009 4.978 1.447 -0.003 5 -2.500 4.330 1.450 -2.502 4.303 1.449 -0.001 6 -4.330 2.500 1.450 -4.343 2.482 1.453 0.003 7 -5.000 0.000 1.450 -5.016 0.000 1.451 0.001 8 -4.330 -2.500 1.450 -4.336 -2.497 1.446 -0.004 9 -2.500 -4.330 1.450 -2.497 -4.327 1.450 0.000 10 0.000 -5.000 1.450 0.002 -5.002 1.448 -0.002 11 2.500 -4.330 1.450 2.476 -4.303 1.449 -0.001 12 4.330 -2.500 1.450 4.320 -2.462 1.453 0.003
III. ASSEMBLY AND PRESTRESSING OF THE DOME
The assembly process of the cable dome is as follows, 1) Firstly, a temporary scaffold was set up in the center of
the structure. The central strut (BS1) was placed on the scaffold;
2) Then, ridge cables were connected with each other through upper joints from BS1 to external beams; 3) Afterwards, diagonal cables and struts were connected
to the appropriate upper joints;
respectively. And diagonal cables were connected to the corresponding lower joints;
5) Finally, DC3 were linked in the cable dome. So far, the structure was assembled.
The distribution of the initial prestress of the structure could be determined by the method of integral feasible prestress [10] through the equilibrium matrix theory. The theoretical analysis indicated that there was only one integral feasible prestress for the herringbone ribbed cable dome. It means that if one type of cables reached the design prestress, all the members would achieve the expected prestress value. External diagonal cables (DC3) were selected to import prestress into the whole structure.
The DC3 were designed to have the ability to change their length through adjustable units in cables, as shown in Fig. 5. The adjustment unit was made of a thread casting connection. The clockwise rotation of the connection led to the contraction of the cable and anti-clockwise rotation led to the elongation of the cable conversely. Therefore, the design internal force could be attained by changing the length of the adjustable units through torque wrenches.
(a) (b)
Fig. 5. Detailed view of active unit: (a) diagrammatic sketch; (b) test model.
20 40 60 80 100
5 10 15 20 25 30 35 40
No. 1-1 No. 1-2 No. 1-3 No. 1-4 No. 1-5 No. 1-6
Axial f
orce (
kN)
Torque value (N·m) (a)
20 40 60 80 100
5 10 15 20 25 30 35 40
No. 2-1 No. 2-2 No. 2-3 No. 2-4 No. 2-5 No. 2-6
Axial f
orce (
kN)
Torque value (N·m) (b)
20 40 60 80 100
5 10 15 20 25 30 35 40
No. 3-1 No. 3-2 No. 3-3 No. 3-4 No. 3-5 No. 3-6
Axial f
orce (
kN)
Torque value (N·m) (c)
20 40 60 80 100
5 10 15 20 25 30 35 40
No. 4-1 No. 4-2 No. 4-3 No. 4-4 No. 4-5 No. 4-6
Axial f
orce (
kN)
Torque value (N·m) (d)
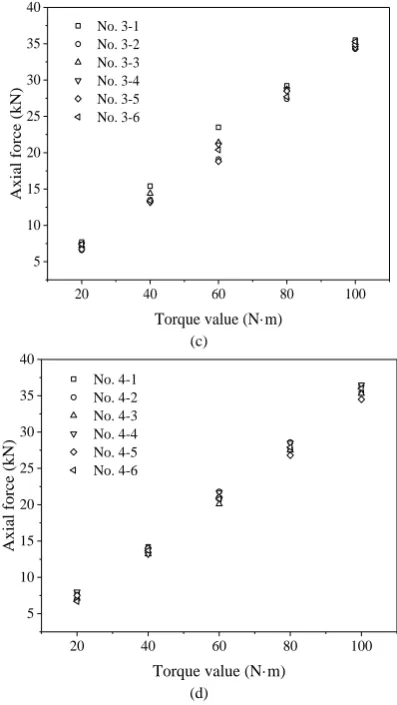
Fig. 6. Relationship between the external diagonal cable forces and torque values.
In order to acquire the internal force of DC3, the cables need to be calibrated first to get the relationship between the torque value of torque wrenches and the axial force of cables. 24 external diagonal cables were calibrated as shown in Fig. 6. The relationship between axial force of cables and torque value approximated to the linear dependence within the calibration range. The average value of the axial forces was 13.67 kN when the torque wrenches gave the value of 40 N·m. This value was set to be the initial design value of external diagonal cables for the prestressing design.
(a) (b)
Fig. 7. Force measuring instruments: (a) cable force sensor; (b) cable dynamometer.
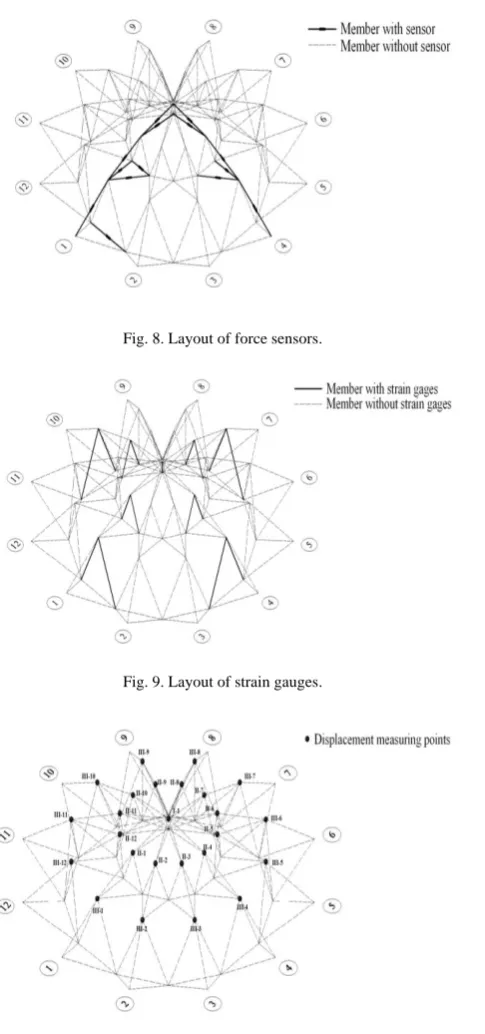
Fig. 8. Layout of force sensors.
Fig. 9. Layout of strain gauges.
Fig. 10. Layout of displacement measuring points.
As every adjustment of the cable would lead to the force redistribution of all structurral members, an appropriate prestressing procedure was needed for making 24 external diagonal cables attain the same prestress value at the same
time. The prestressing procedure of the dome is as follows, 1) Firstly, the value of torque wrenches was set to be 20
N·m. The DC3 in axis 1 and axis 7 were adjusted simultaneously in the first place. Then, the rest DC3 were adjusted to the design value in a counter clockwise direction (Fig. 11), diagonal cables in axis 2-8, 3-9, 4-10, 5-11 and 6-12 successively;
2) Secondly, the value of torque wrenches was increased to 30 N·m and the length of 24 cables were adjusted with the same sequence;
3) Thirdly, torque wrenches’ value was improved to 40 N·m and the adjustment procedure was repeated again. 4) Finally, the internal force of each DC3 was checked by
the cable dynamometer and the cable length was fine-tuned in an iterative procedure. The prestressing procedure was ended when the forces of all the external diagonal cables were close to the design value.
Fig. 11. Adjustment sequence diagram.
The comparison of the theoretical and experimental initial prestress of members was shown in Table III. The experimental value I stands for the force received from the force sensors and strain gauges.
TABLE III: INTERNAL FORCE IN STRUCTURAL MEMBERS OF THE DOME
Member type Theoretical value (kN) Experimental value I (kN)
RC1 4.839 3.937
RC2 10.329 9.326
RC3 23.276 22.317
DC1 5.130 4.889
DC2 5.764 5.761
DC3 13.667 -*
HC1 19.289 16.588
HC2 37.907 31.280
BS1 -5.524 -5.068
BS2 -1.678 -1.966
BS3 -6.332 -6.233
* No sensors in DC3
RC1 RC2 RC3 DC1 DC2 DC3 HC1 HC2 0
5 10 15 20 25 30 35 40
Theoretical
value (kN)
Theoretical value Experimental value I Experimental value II
Fig. 12. Comparison of cable internal force.
IV. STATIC LOADING TEST
The numerical model for the cable dome was established by ANSYS software. Element type LINK 8 and LINK 10 were applied to simulate struts and cables respectively for the geometrically nonlinear analysis. 12 external nodes of the structure were set as fixed pin supports.
A. Full Span Loading Test
Steel blocks were chosen to be static load for loading test. Each of the steel weights was 20kg. The weights were hung through wire ropes to the upper joints of the structure. The loads were evenly distributed on every upper joint and the layout of loading point distribution was shown in Fig. 13. There were 25 loading points in total. The scheme of five steps loading process was made for the test and each loading step was 20kg. Eventually, the load value reached 100kg on each upper joint.
(a) (b)
Fig. 13. Full span loading test: (a) layout of loading point; (b) loading experiment.
0 20 40 60 80 100
-3.5 -3.0 -2.5 -2.0 -1.5 -1.0 -0.5 0.0 0.5
Force var
iation (kN)
Load value (kg) RC1 numerical value RC1 experimental value RC2 numerical value RC2 experimental value RC3 numerical value RC3 experimental value
(a)
0 20 40 60 80 100
-1.5 -1.0 -0.5 0.0 0.5
Force var
iation (kN)
Load value (kg) DC1 numerical value DC1 experimental value DC2 numerical value DC2 experimental value
(b)
0 20 40 60 80 100
0.0 0.5 1.0 1.5 2.0 2.5 3.0
Force
variation
(kN)
Load value (kg) HC1 numerical value HC1 experimental value HC2 numerical value HC2 experimental value
(c)
0 20 40 60 80 100
0 1 2
Force
variation
(kN)
Load value (kg) BS1 numerical value
BS1 experimental value BS2 numerical value BS2 experimental value BS3 numerical value BS3 experimental value
(d)
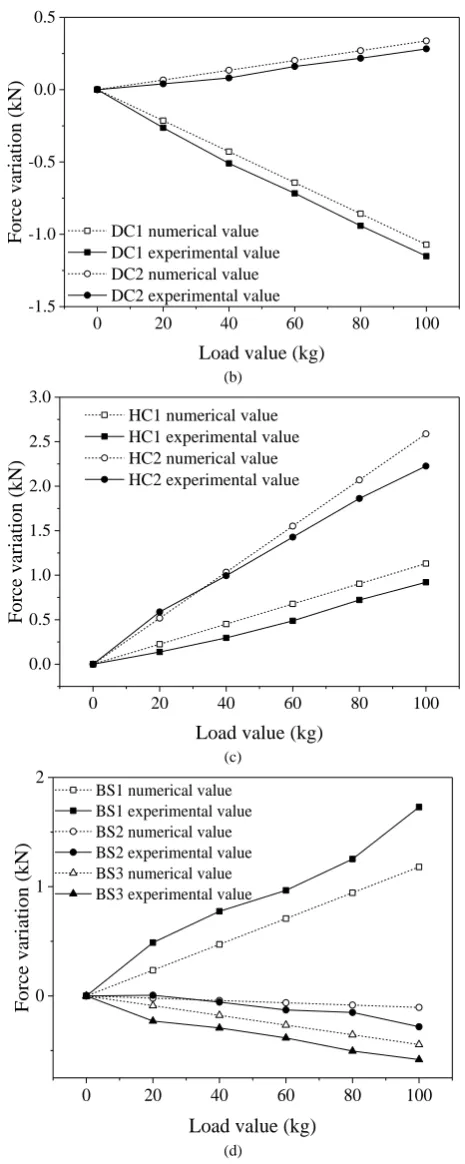
Fig. 14. Internal force variation of full span loading test: (a) ridge cables; (b) diagonal cables; (c) hoop cables; (d) brace struts.
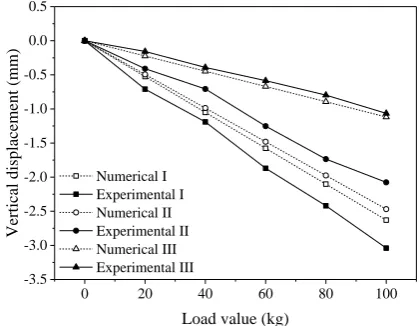
strain gauges are difficult to obtain the accurate date. The vertical displacement of upper joints during the full span loading test was shown in Fig. 15. The test results included the vertical displacement of the central node, I; the mean value of inner ring nodes, II; and the mean value of outer ring nodes, III. Fig. 15 indicated that the measured data were close to the theoretical value, and the maximum error was less than 0.5mm.
0 20 40 60 80 100
-3.5 -3.0 -2.5 -2.0 -1.5 -1.0 -0.5 0.0 0.5
Vertical dis
placement (mm)
Load value (kg) Numerical I
Experimental I Numerical II Experimental II Numerical III Experimental III
Fig. 15. Vertical displacement of upper joints under full span load.
B. Half Span Loading Test
For half span loading test, the line combines axis 1 and axis 7 was selected as the dividing line. Then, the structure was divided into two areas, the loading area and the non-loading area (Fig. 16). In the loading area, the loading quantity was the same as that for full span loading test. The loading quantity on the boundary line was half of that in the loading zone, which was 10kg in every loading step. Structural internal force distribution under half span load was not symmetric about axis 1-7. As force sensors were located at axis 1(boundary line) and axis 4 (loading area), both test results from cables forces of axis 1 and axis 4 were compared with numerical results as shown in Fig. 17. Basically, the experimental results were consistent with expectations. Nevertheless, several types of cables did not fit in with numerical results well, such as RC3 in axis 1 and HC2. The numerical value of RC3 which is in the dividing line (Fig. 17b) indicated that the force variation exhibited nonlinear characteristics during the loading procedure.
(a) (b)
Fig. 16. Half span loading test: (a) layout of loading point; (b) loading experiment.
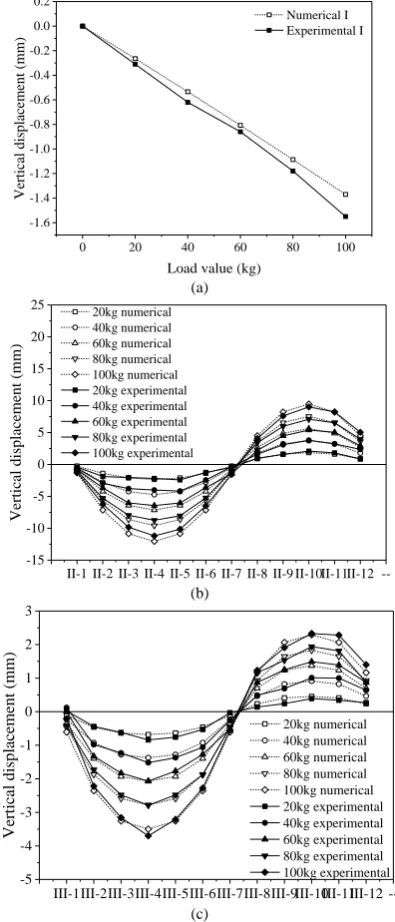
For half span load test, the vertical displacements of joints in the inner ring and outer ring no longer had the same value. Experimental results of 25 nodes were compared with the numerical results as shown in Fig. 18.
0 20 40 60 80 100
-2.0 -1.8 -1.6 -1.4 -1.2 -1.0 -0.8 -0.6 -0.4 -0.2 0.0 0.2
Force variation (kN)
Load value (kg) RC1 numerical value RC1 experimental value RC2 numerical value RC2 experimental value RC3 numerical value RC3 experimental value
(a)
0 20 40 60 80 100
-1.4 -1.2 -1.0 -0.8 -0.6 -0.4 -0.2 0.0 0.2
Force variation (kN)
Load value (kg) RC1 numerical value
RC1 experimental value RC2 numerical value RC2 experimental value RC3 numerical value RC3 experimental value
(b)
0 20 40 60 80 100
-1.0 -0.5 0.0 0.5 1.0 1.5 2.0
Force variation (kN)
Load value (kg) DC1 numerical value DC1 experimental value DC2-1 numerical value DC2-1 experimental value DC2-2 numerical value DC2-2 experimental value
(c)
0 20 40 60 80 100
-0.4 -0.3 -0.2 -0.1 0.0 0.1 0.2 0.3 0.4 0.5 0.6 0.7 0.8
Force variation (kN)
Load value (kg) DC1 numerical value DC1 experimental value DC2-1 numerical value DC2-1 experimental value DC2-2 numerical value DC2-2 experimental value
0 20 40 60 80 100 -0.2 0.0 0.2 0.4 0.6 0.8 1.0 1.2 1.4 1.6
Force variation (kN)
Load value (kg) HC1 numerical value HC1 experimental value HC2 numerical value HC2 experimental value
(e)
Fig. 17. Internal force variation of half span loading test: (a) ridge cables-axis 1; (b) ridge cables-axis 4; (c) diagonal cables-axis 1; (d) diagonal cables-axis
4; (e) hoop cables.
0 20 40 60 80 100
-1.6 -1.4 -1.2 -1.0 -0.8 -0.6 -0.4 -0.2 0.0 0.2 Vertical displacem ent (mm)
Load value (kg)
Numerical I Experimental I
(a)
II-1 II-2 II-3 II-4 II-5 II-6 II-7 II-8 II-9 II-10II-11II-12 ---15 -10 -5 0 5 10 15 20 25 Vertical displacem ent (mm) 20kg numerical 40kg numerical 60kg numerical 80kg numerical 100kg numerical 20kg experimental 40kg experimental 60kg experimental 80kg experimental 100kg experimental (b) III-1III-2III-3III-4III-5III-6III-7III-8III-9III-10III-11III-12 ---5 -4 -3 -2 -1 0 1 2 3 Vertical displacem ent (mm) 20kg numerical 40kg numerical 60kg numerical 80kg numerical 100kg numerical 20kg experimental 40kg experimental 60kg experimental 80kg experimental 100kg experimental (c)
Fig. 18. Vertical displacement of upper joints under half span load: (a) central node I; (b) inner ring nodes II; (c) outer ring nodes III.
Fig. 18 showed that the numerical and experimental results
were pretty close. Nodes in the loading area had downward displacements and nodes in the non-loading area occurred reverse displacements. The nodal displacements in the loading area and non-loading area were distributed in a parabola, respectively. The comparison of maximum vertical displacement under full span load and half span load was shown in Table IV.
TABLE IV: COORDINATES OF THE SUPPORT
Load type Node type I (mm)
Node type II (mm)
Node type III (mm) Full span load -3.040 -2.077 -1.065 Half span
load -1.550
-11.190 / +9.010
-3.700 / +2.330
The maximum downward displacement under half span load occurred at node II-4 and the maximum upward displacement appeared at node II-10. The maximum downward displacement of nodes in the outer ring of half span load was more than three times than the displacement of full span load. Moreover, the maximum downward displacement of nodes in the outer ring under half span load reached more than five times than that of full span load. In addition, the reverse displacements in non-loading area led to the disadvantage of structural performance. The asymmetrical deformation may result in tearing and wrinkling of membranes.
V. CONCLUSIONS
This paper demonstrated the assembly, prestressing and static loading test of a new form herringbone ribbed cable dome.
The design initial prestress of the structure can be achieved by adjusting the length of external diagonal cables, the experimental values agrees well with the theoretical prediction. However, due to the deviations of the node coordinate in the structure, the theoretical prestress is hardly to be reached accurately and the internal force of the same type members are also different.
The static load test indicates that the measured force variation and displacement are in good agreement with the theoretical value. The relationships between force variation and load value, nodal displacement and load value are both basically linear dependence which shows that the structure has a good integral rigidity.
The maximum displacement of the joints in the half span load test is much bigger than that in the full span load test which may lead to tearing and wrinkling of upper membranes in practical engineering. Furthermore, the structure is more likely to fail when subjected to asymmetric load.
REFERENCES
[1] D. H. Geiger, A. Stefaniuk, and D. Chen, “The design and construction of two cable domes for the Korean Olympics,” in Proc. the IASS Symposium on Shells, Membranes and Space Frames, Osaka, 1986, pp. 265-272.
[2] M P. Levy, “The Georgia dome and beyond: Achieving lightweight-longspan structures,” in Proc. the Spatial, Lattice and Tension Structures, ASCE, Atlanta, 1994, pp. 560-562.
[4] S. Dong and H. Liang, “Mechanical characteristics and analysis of prestressing force distribution of herringbone ribbed cable dome,”
Journal of Building Structures, vol. 35, pp. 102-108, Jun. 2014, (in Chinese)
[5] B . F. Richard, “Tensile-integrity structures,” U.S. Patent 3063521, Nov. 1962.
[6] D. A. Gasparini, P. C. Perdikaris, and N. Kanj, “Dynamic and static behavior of cable dome model,” Journal of Structural Engineering, vol. 115, pp. 363-381. Feb. 1989.
[7] A. Zhang, X. Liu, L. Jian et al., “Static experimental study on large-span cable dome structure,” Journal of Building Structures, vol. 33, pp. 54-59, Apr. 2012 (in Chinese)
[8] J. Zheng, S. Dong, and W. Zhan, “Experimental research on construction process of levy type cable dome,” Journal of Building Structures, vol. 27, pp. 112-116, Jan. 2006.
[9] L. Chen and S. Dong, “Theoretical and experimental study on the construction of cable domes,” China Civil Engineering Journal, vol. 39, pp. 33-36. Nov. 2006.
[10] X. Yuan and S. Dong “Nonlinear analysis and optimum design of cable domes,” Engineering Structures, vol. 24, pp. 965-977. Jul. 2002.
Xiaotian Liang was born in China, July 28, 1990. He