Abstract—Traditionally, construction quality control relies on final inspection and rework if the output is not fit-for-purpose. However, this reactive approach does not guarantee compliance with the requirements. By focusing on checking to completed product, a proactive approach to prevent poor quality is thus hampered. Studies have shown that poor quality of key resources commonly results in a number of production-related problems. The premise of this paper is that inadequate resources, such as deficient material, will not only result in unacceptable product quality but also in wasted time for handling and repair. It investigates the causal relationship between process input (i.e. resource) and output quality, as the basis for a pro-active control scheme. A field test was executed to look specifically at the quality of a prefabricated material, steel reinforcing bars (rebar), as it relates to its staging for final assembly. A discussion of correlations between attributes of input quality regarding rebar and the productivity of placement will complete the paper.
Index Terms—Causality analysis, dynamic quality control, multiple regression analysis, preventive control, resource control.
I. INTRODUCTION AND BACKGROUND
Quality control is vital for completing a project successfully [1]. In the 1950s, Deming [2] emphasised the significant effect of input (or resource) quality on other managerial aspects such as productivity, safety, and cost. As of today, the construction quality control is performed mostly through product inspections to assert if the final quality is acceptable according to the predefined requirement and/or standards [3]. This kind of reactive approach makes it impossible to identify and eliminate production problems that can result from poor resource quality. Bernold has shown that the deficiency of critical resource, such as an unskilled equipment operator, will impact the efficiency of an entire process [4]. Within an Input-Process-Output (IPO) framework, the collection of resources required to start and maintain an operation are considered process inputs or simply inputs. The objective of a competent manager is to secure high quality resources and control their use without creating process wastes that includes idleness, injuries and squandering materials.
To ensure the effectiveness of managerial control, this presented work applies a proactive dynamic quality control (DQC) approach. The DQC relies on feed-forward information about the marshalled process inputs (resources) in order to predict problems. When input characteristic is
Manuscript received February 14, 2013; revised May 23, 2013. The authors are with the School of Civil and Environmental Engineering, University of New South Wales, UNSW Sydney, 2052, Australia (e-mail: [email protected], [email protected]).
expected to affect the process output, this preventive control should be able to forecast an expected difficulty and recommend actions to avoid process disruptions beforehand [5]. The alternative is a corrective control approach to fix a problem reactively, which is more expensive and inefficient in the majority of cases[2], [5], [6].
Because DQC is predictive in nature, it depends on intelligence that allows it to link the characteristics or quality of process inputs to the quality of the output. The knowledge can be based on causal relationships between input and output. This relationship has been established through a causality analysis designed to understand the essential mechanism of the process, and the future effect of the process inputs. The comprehensive understanding of process is one of the most significant requirements for preventive control not only in construction but also in medicine as prevention is much more effective than treatment. For example, a vaccine against the disease is able to be to protect people from further infection.
The establishment of causalities has to consider the importance of individual and cluster relationships. In addition, priority of control need to be set [7] as it is almost impossible to deal with all required resources simultaneously. The following sections will present a causality model before discussing the hypotheses for this paper.
II. THEORETICAL REVIEW AND HYPOTHESES
A. Schematic Causality Model
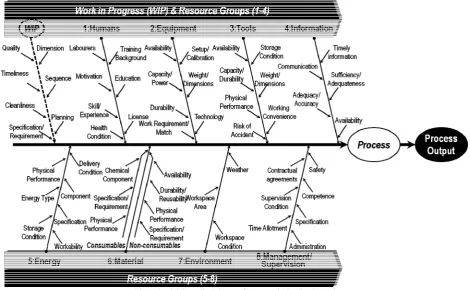
As most construction operations are repetitive in nature, the Input-Process-Output (IPO) modelling method is commonly used to study them. Fig. 1 integrates the IPO of a process with a structured map linking input factors with the output. Process inputs are clustered into work-in-process (WIP) and eight resource groups representing the 5M system which stands for Man (Humans), Machine (Equipment and Tools), Material, Management and Environment. Of course, each group has many members with similar characteristics. In particular, Group 1: Humans includes all about operators, drivers, labourers, supervisors, etc.
Following the principles of the fishbone diagram method, each resource group is analysed separately, and the relevant main impact factors are graphed as arrows that feed into the associated master bone. For example, a crane operator, belonging to Group1: Humans, will control the upcoming process involving cranes in many ways. Besides, a human performance is ruled by a series of aspects such as motivation, health condition, education, and experience.
Process output can be assessed using a variety of measures to include: a) production, b) productivity, c) quality, d) physical waste, e) delays, f) damages, g) noise, h) dust, and i)
Causality Analysis for Dynamic Quality Control in
Construction
injuries. The experimental analysis in this paper measured the productivity from observing workers. One has to expect that each outcome will be linked to its own list of resource factors
to each with a different influence on process output. Naturally, this causality model is a simplification but is useful in explaining this module of the DQC model.
Fig. 1. Partial Causality Diagram for Dynamic Quality Control
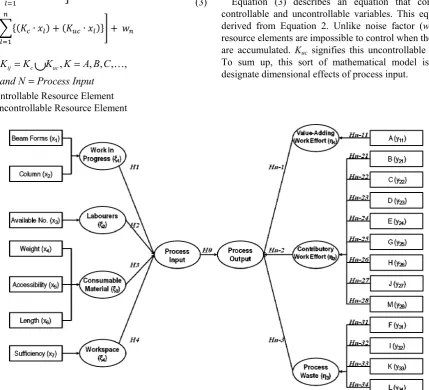
In order to focus the experimental work, only a selected number of resource inputs were chosen: a) WIP, b) labourers, c) consumable material, and d) workspace. For the assessment of process output, the time study of workers placing rebar was conducted. To guide the experimental work, the following hypotheses were formulated.
H1: Work in Progress (WIP) has a significant causal relationship with process productivity.
H2: Labourers in the resource group 1: Humans have a significant causal relationship with process productivity. H3: Consumable material in the resource group 6: Material has a significant causal relationship with process productivity.
H4: Workspace in the resource group 7: Environment has a significant causal relationship with process productivity. H5: Process productivity is able to be estimated by the causality analysis.
B. Statistical Causality Analysis for Dynamic Quality
Control (DQC)
In this section, a statistical method is introduced to compute dimensional causality between process input and output. It is important to be consistent in the modelling analysis, and the data from process inputs gathered by observation should be measurable and repeatable. Furthermore, cases that require multivariate causality analysis require the statistical model to investigate and grasp the multiple relationships sufficiently.
The following equations (1)-(3) represent mathematical models based on the causal relationship in Fig. 1. These equations are able to assign the weight of process input, which depicts its future effect on process output. For these reasons, in the manufacturing industry, the stream of variation (SoV) method has been actively applied to analyse causal relationships in the multi-stage processes. SoV analysis is conducted to reduce the variation across the process and to identify the variation flow and behaviour mathematically [8]. One the other hand, this research focuses on the features of process input to estimate its negative effect on process output.
The features of process input are represented by Kij that stands for Aij, Bij, Cij…, and Nij. With these variables, process output is calculated as the matrix in Equation 1. Based on this matrix, Equation 2 presents the general causality equation.
PO =
⋯
⋮ ⋱ ⋮
⋯
⋮ ⋮ (1)
; ;
∙
∙ ∙ ∙ ⋯
∙ ∙
; ;
∙
∙ ∙
(3)
where, Kij Kc K Kuc, A B C, , , ,
and N Process Input
= = …
=
∪
Kc: Controllable Resource Element
Kuc: Uncontrollable Resource Element
PO: Amount of Process Output
wn: Inherent Process Error (Noise Factor)
Equation (3) describes an equation that consists of controllable and uncontrollable variables. This equation is derived from Equation 2. Unlike noise factor (wn), some resource elements are impossible to control when their errors are accumulated. Kuc signifies this uncontrollable variable. To sum up, this sort of mathematical model is able to designate dimensional effects of process input.
Fig. 2. Experimental Causality Model in Rebar Placement Work
III. EXPERIMENTAL CAUSALITY ANALYSIS OF REBAR
PLACEMENT WORK
A. Description of Construction Site
The experimental analysis in this paper focused on the rebar placement work for a multi-story building. The construction site is located in Kensington, New South Wales 2052, Australia. As mentioned earlier, four process inputs were the subject of this experiment, which are WIP, labourers, consumable material (rebar) and workspace. For the process outputs, the sequence of workers placing rebar was observed. According to previous research [4, 9], rebar placement work is comprised of fourteen specified works as shown in Table I. Again, this list is sorted into three classifications,
value-adding work effort, contributory work effort, and
process waste. On the basis of this list, the time study was
conducted focusing on beams in rebar placement work. Three beams were selected, and the man-hour spent was measured.
B. Correlation Analysis and Hypothesis Testing (H1-4)
Fig. 2 describes the structural causality model between process input and output. It also presents hypotheses in this experiment schematically. This model was organised by
latent variable and observed variable. Correlation analysis was conducted within observed variables directly, so no estimation error was considered. Seven process inputs are designated into four input latent variables, and three output latent variables comprise thirteen outputs as shows in Fig. 2. In total, 91 hypotheses were verified as shown in Appendix.
TABLE I: REBAR PLACEMENT WORK IN CONSTRUCTION Category of Work Classification
A Direct Work Value-Adding Work Effort (η1) B Carrying tools and materials within the staging area Contributory Work Effort (η2) C Work related communications Contributory Work Effort (η2) D Staging/rehandling with crane Contributory Work Effort (η2) E Measuring and other minor contributory work Contributory Work Effort (η2) F Walking empty-handed Process Waste (η3) G Searching for rebar Contributory Work Effort (η2) H Obtaining tools and rebar outside the staging area Contributory Work Effort (η2)
I Waiting for tools, materials, etc. Process Waste (η3) J Correcting/replacing rebar Contributory Work Effort (η2) K Idle (unexplained) Process Waste (η3) L Non-work related communications Process Waste (η3) M Reviewing the Drawings Contributory Work Effort (η2)
Table II represents the hypothesis testing of the relationship between labourers and process output. Among thirteen hypotheses, eight hypotheses have statistically significant results. Firstly, H2-1 is accepted, and the correlation coefficient is 0.624. This means a high available number of workers will increase the value-adding work effort. In regard to contributory work effort, four hypotheses were verified. All hypotheses are rejected. This means that the
contributory work effort has a negative effect on available
number of workers. For example, it is demonstrated that Category H (obtaining tools and rebar outside the staging area) reduced the number of workers at the level of -0.267.
Three hypotheses on process waste were verified. H2-32 is accepted, and H2-33, 34 were rejected. Category K (Unexplained Idle) increased, as the number of available workers increased (0.262). On the other hand, Category I (Waiting for tools, materials, etc) and L (Non-work related communications) were influenced negatively by the number of workers at the levels of -0.223 and -0.432 respectively. The hypothesis testing of H2 shows that the labourers are important to increase the value-adding work effort at the level of 0.624. Therefore, Category L (non-work related communications) should be controlled by priority, by the highest correlation coefficient (-0.432).
TABLE II: HYPOTHESIS TESTING OF H2 [H2] Labourers have positive causal relationship with
process output. Co. Sig.
[H2-1] Labourers have positive causal relationship with
value-adding work effort. .624 Sig**
[H2-2] Labourers have positive causal relationship with
contributory work effort. D, G, H, and J
[H2-21] Labourers have positive causal relationship with
B. -.053 Non-Sig
[H2-22] Labourers have positive causal relationship with
C. -.031 Non-Sig
[H2-23] Labourers have positive causal relationship with
D. -.254 Sig*
[H2-24] Labourers have positive causal relationship with
E. -.110 Non-Sig
[H2-25] Labourers have positive causal relationship with
G. -.216 Sig*
[H2-26] Labourers have positive causal relationship with
H. -.267 Sig*
[H2-27] Labourers have positive causal relationship with
J. -.223 Sig*
[H2-28] Labourers have positive causal relationship with
M. -.116 Non-Sig
[H2-3] Labourers have positive causal relationship with
process waste. K, I, and L
[H2-31] Labourers have positive causal relationship with
F. .108 Non-Sig
[H2-32] Labourers have positive causal relationship with
K. .262 Sig*
[H2-33] Labourers have positive causal relationship with
I. -.223 Sig
*
[H2-34] Labourers have positive causal relationship with
L. -.432 Sig**
**Correlation is significant at the 0.01 level (2-tailed). **Correlation is significant at the 0.05 level (2-tailed).
Considering WIP, all hypotheses could not have any statistically significant results. Furthermore, it was verified that consumable material has an effect on process output. In particular, accessibility of resources strongly influences
value-adding work effort (H3-11; 0.545), Category D (H3-23;
-0.368; staging/rehandling with crane), and Category G (H3-25; -342; searching for rebar). As accessibility improves, productivity will increase. However, Category D and G will decrease with better accessibility. Workspace has a positive
causal relationship with value-adding work effort at the level of 0.252. The following section presents an estimation model for productivity (value-adding work effort) based on this causality analysis.
C. Value-Adding Work Effort Estimation Model and
Hypothesis Testing (H5)
Multiple regression analysis (MRA) was applied to this estimation model. This model aims to estimate the
value-adding work effort (i.e. productivity) by the causal
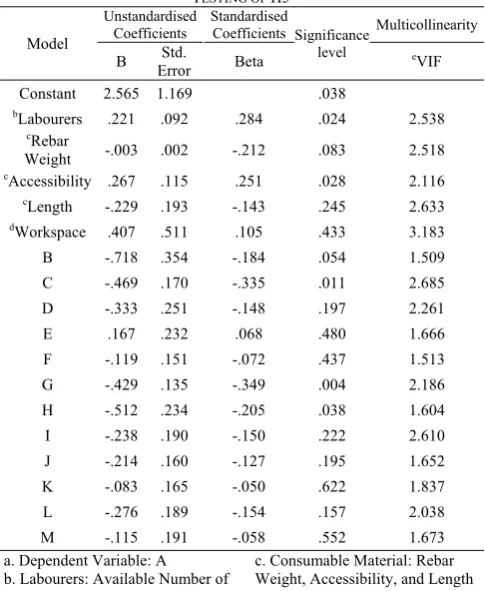
relationship between process input and output. Table III shows the result of MRA. The analysis shows that all variance inflation factors (VIFs) are less than 10. Thus, it is considered that no multicollinearity exists [10].
TABLE III: MULTIPLE REGRESSION ANALYSIS (MRA) FOR HYPOTHESIS TESTING OF H5
Model
Unstandardised Coefficients
Standardised
Coefficients Significance level
Multicollinearity
B ErrorStd. Beta eVIF
Constant 2.565 1.169 .038
bLabourers .221 .092 .284 .024 2.538
cRebar
Weight -.003 .002 -.212 .083 2.518
cAccessibility .267 .115 .251 .028 2.116
cLength -.229 .193 -.143 .245 2.633
dWorkspace .407 .511 .105 .433 3.183
B -.718 .354 -.184 .054 1.509
C -.469 .170 -.335 .011 2.685
D -.333 .251 -.148 .197 2.261
E .167 .232 .068 .480 1.666
F -.119 .151 -.072 .437 1.513
G -.429 .135 -.349 .004 2.186
H -.512 .234 -.205 .038 1.604
I -.238 .190 -.150 .222 2.610
J -.214 .160 -.127 .195 1.652
K -.083 .165 -.050 .622 1.837
L -.276 .189 -.154 .157 2.038
M -.115 .191 -.058 .552 1.673
a. Dependent Variable: A b. Labourers: Available Number of Workers
c. Consumable Material: Rebar Weight, Accessibility, and Length d. Workspace: Sufficiency e. Variance Inflation Factor (VIF)
Through the coefficients, the amount of influences of each variable on productivity is able to be identified. Focusing on process inputs, the labourers have the highest standardised coefficient, 0.284. This means adding one labourer increases productivity by 2.84%. Among process outputs, the coefficient for Category G (searching for rebar) was -0.349, and turned out to the most influential variable.
p 1 3 7 11 12
A = +α β(Labourers)+β (Accessibility)+βC+β G+β H
TABLE IV: EXTERNAL VALIDATION OF ESTIMATION MODEL Actual Productivity Estimated Productivity
N 20 20
Mean .395 (39.5 %) .397 (39.7 %)
Std. Error of Mean .024 .022
Median .400 .409
Std. Deviation .109 .099
Minimum .200 .237
Maximum .600 .545
Sum 7.900 7.951
IV. SUMMARY AND CONCLUSION
Reactive inspection is still the main approach to ensure quality in construction. This paper discusses a proactive approach that applies the principles of dynamic quality control (DQC) and the casual relationship between process input quality and output quality. Based on the presented work,
it is focused on the problem of establishing valid relationship functions. It is shown how the causality analysis is able to provide feed-forward information to activate pro-active control action. In addition, the analysis defines the extent of the effect of process input on output. Thus, DQC is able to prioritise different process inputs.
The rebar placement process was selected as an example to demonstrate the concept. The causality analysis resulted in 91 hypotheses that were subsequently tested with data that had been collected on a construction site. With a level of 0.624, the number of workers turned out to be the most influential resource factor impacting the amount of value-adding output factor (production). In a second step, the causality functions were used to predict the productivity of rebar placement. This model fitted the actual value well at the level of 86.3 %. The estimated productivity has only 0.2% difference compared to actual productivity.
APPENDIX [CORRELATION COEFFICIENTS]
Variables 1 2 3 4 5 6 7 8 9 10 11 12 13 14 15 16 17 18
(1)ANo 1
(2)Wei -.155 1 (3)Acc .190 .062 1 (4)Len .151 -.554** -.141 1 (5)Suff -.044 .188 .600** -.274* 1 (6)A .624** -.223* .545** .010 .254* 1 (7)B -.053 -.073 -.126 .109 -.149 -.231* 1 (8)C -.031 -.063 -.008 .250* -.035 -.184 -.022 1 (9)D -.254* -.080 -.368** .165 -.158 -.361** -.053 -.145 1 (10)E -.110 -.037 .071 -.122 .103 .020 -.069 .308** -.116 1 (11)F .108 .134 .132 -.214* .067 .086 -.193 -.197 .123 -.137 1 (12)G -.216* .281* -.342** -.317** -.138 -.435** .017 -.189 .158 .037 .028 1 (13)H -.267* -.008 .075 -.012 .081 -.236* .025 -.148 -.070 -.147 .078 .046 1 (14)I -.223* -.070 -.115 .086 .102 -.180 -.065 -.312** .317** -.043 -.113 -.069 .297** 1 (15)J .262* -.047 .079 .043 .128 .171 -.127 -.148 -.071 -.178 -.039 -.142 -.141 .039 1 (16)K -.119 .139 -.155 -.051 -.200 -.124 .016 -.072 .035 -.023 .007 -.055 -.265* -.233* .117 1
(17)L -.432** -.050 -.099 -.050 -.062 -.220* -.151 -.131 -.084 -.022 -.210* -.058 .238* .106 -.124 .037 1 0.00 (18)M -.116 -.123 .041 .097 -.092 -.013 .045 .194 -.135 -.205 -.036 -.226* .034 -.261* -.262* -.061 .177 1 **Correlation is significant at the 0.01 level (2-tailed).
(1)ANo: Available Number of Workers (2)Wei: Rebar Weight
**Correlation is significant at the 0.05 level
(2-tailed).
(3)Acc: Accessibility (4)Len: Length
(5)Suff: Workspace Sufficiency
REFERENCES
[1] S. Moon and L. E. Bernold, “A model for process centred dynamic quality control in construction,” in Proc. 37th Australasian Universities Building Education Association (AUBEA) International Conference 2012, pp. 657-667, 2012.
[2] W. E. Deming, Out of the Crisis, MIT Press, 2000.
[3] J. Barhak, et al., “Integration of reconfigurable inspection with stream of variations methodology,” International Journal of Machine Tools and Manufacture,vol. 45, pp. 407-419, 2005.
[4] L. E. Bernold and S. M. AbouRizk, Managing Performance in Construction, John Wiley & Sons, Inc., 2010.
[5] C. Brosilow and B. Joseph, Techniques of Model-Based Control, Prentice Hall, 2002.
[6] P. B. Crosby, Quality is Free: The Art of Making Quality Certain, New American Library, 1980.
[7] D.-Y. Kim, et al., “Relationship between quality management practices and innovation,” Journal of Operations Management, vol. 30, pp. 295-315, 2012.
[8] J. Zhong, “Manufacturing system variation reduction through feed-forward control considering model uncertainties,” PhD Thesis, University of Michigan, 2009.
[9] M. Salim and L. Bernold, “Effects of design integrated process planning on productivity in rebar placement,” Journal of Construction Engineering and Management,vol. 120, pp. 720-738, 1994.
[10] S. Moon, et al., “An analysis of landmark impact factors on high-rise residential buildings value assessment,” International Journal of Strategic Property Management, vol. 14, pp. 105-120, 2010.
Sungkon Moon received the B.S. and the M.S. degrees in 2008 and 2010 from Hanyang University, Seoul, Korea. From 2010, he is a Ph.D. candidate at the University of New South Wales (UNSW), Sydney, Australia. His work experience includes serving as a research fellow at Architecture and Urban Research Information Centre (AURIC) at Seoul National University (SNU), Seoul, Korea. His research involves dynamic construction management, construction quality control, automated construction, information management, and network science.
Leonhard E. Bernold was born in Switzerland but immigrated to USA in 1982. MBA from University of St. Gall (Switzerland), MS in Industrial Management and Ph.D. in Civil Engineering from Georgia Institute of Technology, Atlanta, GA.
Professor Bernold was with the University of Maryland, North Carolina State University, Hanyang University-Korea and since 2011 at UNSW-Australia. Founding Director of Construction Automation Robotics Lab and the Buried Utility Detection Consortium at North Carolina State University.
Leonhard E. Bernold directed $ 4 million of research grants in advanced construction technology and engineering education. He published over 90 scientific journal papers and authored two text books which were published by John Wiley & Sons.