DESIGN AND INSTALLATION OF A COMBINE PV-THERMAL
SYSTEM WITH INCREASED EFFICIENCY USING COMPOSITE
PCM
Pooja Shukla1, Nilesh Diwakar2 & Namish Mehta3
1. INTRODUCTION
Photovoltaic/thermal (PV/T) system is an application to recycle and reuse the heat and same time improve the temperature loss from PV module. The heat can transfer to hot water or hot air and can be used to civilian manners as bath domestics purpose, industrial preheat, air heating etc. The concepts of hybrid PV/T systems have been presentedfor the first time in 1978. Lambert et al. found that oscillating flow can significantly improve heat transfer byincreasing thermal diffusivities of the working fluids insolar collectors.The nature convection photovoltaic thermo siphon water heating system can be appliedwith aluminum-alloy flat box and the electrical efficiency is 11.5~14.5% and the thermal efficiency is 40~55.67% in summer and winter day Combine the solar PV and solar thermal application is high performance utility in solar energy. In this work, the PV/T module uses the vacuum tube heat exchanger design to combine the photovoltaic module.
In particular, the experimental set-up, installed at the institute, located in Bhopal (INDIA), consists of two flat polycrystalline silicon PV panels and one PVT collectors attached with it. The designed experimental set-up allows integrating the systems electricaland thermal efficiencies as well as the temperatures reached by both solar technologies (PV and PV/T),in order to determine:
i. The hybrid technology showing the higher performance.
ii. Validate the model by comparing the obtained results with conventional solar PV.
The main method to enhance the thermal conductivity of PCMs is to add some material of highthermal conductivity. An important organic PCM is paraffin, which is a kind of chain saturated alkane mixture, with general formula expressed by CnH2n+2. There are a lot of advantages of paraffin, such as low cost, rich sources, colorless, stable physical, chemical properties, and the most important property of paraffin is larger phase change latent heat. An undesirable property of paraffin wax, however, is its relatively lowthermal conductivity, which will become much lower in liquid and significantly decelerate the energy charging /discharging rates. The coefficient of thermal conductivity of paraffin wax is around 0.2W/(m\K), so its heat transfer efficiency is too low to make complete phase transition, meanwhile, it is too low tomake the phase change latent heat fully released. And some reports showed that, improve the thermal conductivity and latent heat of PCMs is the main way
1
M. Tech. Scholar, Energy Technology, Truba Institute of Engineering and Information Technology, Bhopal (Madhya Pradesh), INDIA
2Principal, Truba College of Science and Technology, Bhopal (Madhya Pradesh), INDIA 3
Professor and Head, Department of Mechanical Engineering,Truba Institute of Engineering and Information Technology, Bhopal (Madhya Pradesh), INDIA
Abstract- In thisarticle the discussion is based on experiment by working model analysis. It is all about possible low cost implementation approach on Hybrid Solar PV-Thermal latent heat storage system for multiple uses. The PCM Based heat box will directlyimbeddedbehindPVmodule that will transfer extraheat directly towards hot water solar thermal system without any atmospheric heat loss, bythis way the problem of overheating of PV system can be managed up to considerable extent. When module temperature reduces then automatically the output powerin terms of voltage and current will also increases altogether heat use can be maximize for thermal system, so by this combination the overall efficiency of hybrid PV thermal system can be improved up to noticeable range. These results indicates the system thermal efficiency can reach up to 43.3% & 53.84 % based on gross area and aperture area respectivelyand photovoltaic conversion efficiency can reach 13.69% during the testing period for peak values. Finally combined efficiency for PV-T system can reach 67.69%. The water temperature can be risen from 36.2℃to 64.05℃and remain hot.
Keywords: CompositeParaffin based Phase Change Materials, latent heatWater Heating System, Solar Irradiation, Temperature, Electrical Efficiencyand Thermal Efficiency, optimum tilt angle.
efficient model.
2. PV/PCM PANELS FABRICATION
Thermal management of the PV panels is crucial for their efficiency but also contributes to prevent fromdegradation of PV cells. The efficiency declared by the producers is measured in the Standard Test Conditions of1 kW/m2Pin and temperature 25°C, while the effect of real weather conditions can significantly change the efficiency. Nevertheless, the temperature of the panel should be kept at the minimal possible level, evenbelow 25°C
Figure-1.1: Front View Of PV-PCM Module.
3. THERMODYNAMIC CYCLE OF SOLAR HEAT
Application of PCM on the back side of PV panel helps to keep the temperature at the level ofmelting point of the material. Phase change materials are able to store specific amount of heat during changing thephase from solid to liquid and release it during reverse transition of phases. Isothermal character of this processresults in stabilizing the temperature. However, the transition temperature should be designed with simultaneousconsideration of amount of the material and period of analysis. Proper assumption of the material properties is aquite complex task since the whole system is supposed to work under uncontrolled weather conditions. Effectiveness of PV-PCM system depends on the thermal, physical and kinetic properties of the phase changematerial. The basic properties that influence the amount of absorbed heat are latent heat of fusion and heatcapacity. Their high values and good thermal conductivity contribute to efficient heat removal and its release. Theamount of the heat that can be absorbed depends also on the density of the material and subsequently its weight –thickness of the applied layer. Moreover, as a building material, it shouldapply with safety regulations about flammability, explosiveness and toxicity.Another issue that should be discussed on the design stage of PV-PCM system is a form of the PCM application.As stated before, the temperature of PV panels is very sensitive to the weather conditions and it is impossible tochoose parameters of PCM that will effectively stabilize the temperature during the whole year. Therefore, phasechange temperature should be designed to lower the overheating effect during the most extreme summer months depends on the locationof the experiment.
4. OBJECTIVES OF WORKING MODEL The major objectives of the present paper are
The main objective of the project is to increase the potential of hybrid solar photovoltaic-thermal (PVT/PCM) system incorporating with phase change material.
Design the hybrid PVT/PCM in such a manner that it absorbs optimum sunlight all the day. This system is designed in such a way that it gives thermal output in the night and cloudy days also.
5. EXPERIMENTAL SET-UP AND SPECIFICATIONS
The experimental set up, schematic and photo of the outdoor set up is shown in fig and a photo of the indoor set up is shown in fig.1.1, consists of the following main components:
Table-5.1: PV PanelElectrical and Physical characteristics of the PVmodules used.
S.No. Particulars Specifications S.No. Particulars Specifications
1 Model no. BP 7150 11 Maximum system voltage (Vmax) 1000V
2 Power rating (Pmp) 150 watt 12 Maximum series fuse rating 12A
3 Open circuit voltage (Voc) 24.5V 13 Nominal operating cell temperature 45C 4 Short circuit current (Isc) 9.05A 14 Temperature coefficient of (Isc) 0.064%/C 5 Voltage at maximum power
(Vmp)
19V 15 Temperature coefficient of (Voc) 0.36%/C 6 Current at maximum power
(Imp)
8.10A 16 Cell type Polycrystalline
silicon
7 Nominal voltage 21V 17 No of cells per panel 36x2
8 Module efficiency 18.50% 18 Panel dimension (mm.mm.mm) 1270x711
9 Fill factor 82.00% 19 Weight 14.4kg
10 Power tolerance 0.00-2.50% 20 cell efficiency max 19.5%
1. Solar power generation kit: solar charge controller, battery, inverter, wires etc. 2. Copper heat pipes fitting: cooper heat pipes for fluid flow. (Figure-5.1(a))
3. Hot water side: A schematic of the hot water side is shown in fig. and a photo is shown in fig. The heat exchanger is a copper tube of 9.5cm length and an outside diameter of 11.5cm. The heat exchanger was designed to give a temperature drop between the inlet and the outlet of about 10°C, which represents the optimum temperature rise across the flat plate solar collectors.
4. Auxiliary components: These include tanks for supply, concentrate withdrawal and distillate receiver along with connecting pipes.
5. Paraffin wax box: using wax as PCM material. Properties of wax are given below.
6. Density of wax = 752 kg/m3,Melting point of composite paraffin wax mixture = 47-52oC, Specific heat of wax = 215 KJ/kg.
7. Supporting structure: A 20ft high scaffold.
Basically PVT collector is made by an aluminumplate and cooper heat exchanger pipes integrated with a conventional PV panel by a thin butyl layer.The total electrical power of the solar field, consisting of 150Watts PV-T solarcollectors. Maximum operating pressure: 1 MPa;operating maximum temperature: 95 oC.
Figure-5.2: Over view of solar PV-Thermal hybrid system.
Table-5.2: Description and dimensions of heat pipes connection. S.
No.
Particulars Unit S.
No.
Particulars Unit
1 Capacity 150 ltr/day 7 No. of outlet/inlet 1/1 2 Safety device Thermostat 8 Plug inner dia. 1”
3 FP collector 1 Nos 9 valve ½”
4 Pipe connection ¾” 10 Tee 4
5 Daily usage 4 members 11 stoppers 3
6 Rated pressure 5 bar 12 gaskets 10-12
The basic structure of PV-Thermal combined system was assembled on the steel base frame. The power generation supporting equipment’s were also set into same base material. I have used the tube solar collector to hybrid the panel and thermal system which can be adjust according to climatic condition also. The 150 liters heat storage tank is attached with the model. in addition the composite wax with improved thermal conductivity have filled beside the backside of the panel which continuously transfer the extra absorbed heat from the panel to the water.Resulting that the operating temperature of the solar panel can be maintained relatively below level as compared with conventional PV system.
6. EXPERIMENT TRIAL
In the experimental period the charging process the water is circulated through the tank and the solar collector unit continuously. The water absorbs heatgradually, and exchanges this heat with the PCM in theheat storage box, which is initially at room temperature. The PCM starts heating gradually, sensibly at first, until it reaches its melting point temperature or particular stage. As the charging proceeds’ successively, energy storage as Latent heat is achieved as the Paraffin wax mixture with fatty acid melts at constant temperature (50±2°C). After complete solidification is achieved, further heat addition from the fluid or water causes the PCM to superheat, thereby again storing heat sensibly. The charging process continues till the PCM paraffin and the water set thermal equilibrium. Temperatures of the PCM and water at the outlet are recorded at intervals of 1 hour continuously for 7days. The PCM is charged throughout the day, whenever hot water is not demanded by the consumer. The discharging cycle process used is termed as batch wise or sequence process thermodynamically. In this method, a particular quantity of hot water is withdrawn from the water tank and readings are taken. This is repeated for intervals of 3 hours, in which time transfer of energy from the PCM box would have occurred. This procedure is continued till PCM reaches a temperature of 47-56oC. We have taken the trial on the Solar Water Heater without using phase change material as composite paraffin wax.
Efficiency of PV module
In order to find out the PV module efficiency, instantaneous input solarRadiation and instantaneous PV module peak power is,
Or Efficiency,
Area
Power
Rated
F
F
I
V
oc sc
.
%
max
in SC OC
in m m
in
P
FF
I
V
P
I
V
P
P
Figure-7.1: (a) A arrangements of measuring devices and panel values and (b) Ammeter and voltmeter outputs check in.
7. WEEKLY SYSTEM ANALYSIS
The electrical power produced by PV panels is Eel PV, the thermal and electrical power producedPV/T collectors is Eth PV/T and Eel PV/T. the global incident solar radiation, G, are shown on a weekly basis. By following the incident solar radiation, similar trends for the electricity and thermal production can be obtained. The production of thermal energy is comparableto the electrical ones produced by PV/T and PV as Study throughout week.
8. DAILY SYSTEM ANALYSIS
The global solar radiation, G, is also depicted for suitable evaluation of the electrical and thermal system to solar radiationWhen global solar radiation hits the solar panels and collectors, between 10:00 a.m. and 4:00 p.m. the trend of PV and PVT electrical efficiencies is almost constant or equal to approximately 11.34% and 13.69%, respectively for peak values.
Table-8.1: Comparison of solar panel for average of 7 days observation with and without thermal system attachment. 27th March to 01st April 2017 With thermal Attachment and wax Without Thermal Attachment/ only PV
Time AM to PM Atm Temp o C Panel temp o C Load W Voltage V Current A Panel temp o C Load W Voltage V Current A
10:00 AM 40 47 NO LOAD 21 V 0 51 No Load 19.8 0
63 W 13 2.99 63 W 12.8 2.87
11:00 PM 40 49 No
Load
21.9 V 0 53 No Load 20.4 0
63 W 13.7 3.04 63 W 13.6 2.98
12:00 NOON
40 52 No
Load
22.2V 0 57 NO LOAD 20.8 0
63 W 14.9 3.08 63 W 14.4 3.01
01:00 PM
41 54 No
Load
21.7 V 0 61 No Load 20.7 0
63 W 13.9 4.02 63 W 13.8 3.03
02:00 PM
41 55 No
Load
21.2 V 0 65 No Load 20.4 0
63 W 14.1 4.08 63 W 13.49 3.12
03:00 PM
40 57 No
Load
20.4 V 0 68 No Load 20.00 0
63 W 12.7 4.12 63 W 13.23 3.14
04:00 PM
40 56 No
Load
20.9 0 67 No Load 19.51 0
S. No.
Time Atm.
Temp 0C
Panel Temp. 0C
Open circuit voltage (Voc)
Short Circuit current (Isc)
Fill Factor( F.F)
Power output (W)
Efficiency (
el)%1 10:00A
M 36 43 19.62 2.81 0.82 45.25 10.18
2 11:00A
M 37 49 19.87 2.93 0.82 47.73 10.68
3 12:00No
on 40 53 20.06 3.08 0.82 50.66 11.34
4 01:00P
M 41 58 20.11 3.06 0.82 50.46 11.30
5 02:00P
M 42 61 19.79 2.91 0.82 47.22 10.57
6 03:00P
M 43 64 19.52 2.84 0.82 45.46 10.18
7 04:00P
M 40 61 19.34 2.73 0.82 44.87 10.13
Graph-8.1: Graph between panel temperature and Efficiency with time without PCM (Table-8.2).
Table-8.3: Observation for efficiency and power output of hybrid Solar PVT system with composite paraffin wax filling for second week of April 2017.
S.
No. Time
Atm. Temp
Panel Temp.
Open circuit voltage (Voc)
Short Circuit current (Isc)
Fill Factor(F .F)
Power
output (W) Efficiency (
el)1 10:00
AM 36 40 20.69 3.47 0.82 58.87 13.19
2 11:00
AM 38 42 21.01 3.45 0.82 59.43 13.34
3 12:00No
on 40 44 21.17 3.47 0.82 59.95 13.46
4 01:00
PM 41 45 21.11 3.49 0.82 60.49 13.69
5 02:00
PM 43 48 20.53 3.50 0.82 60.41 13.55
6 03:00
PM 42 46 20.04 3.49 0.82 60.21 13.47
7 04:00
Graph-8.2: Graph between Voltage, Current and Efficiency with time for Hybrid PVT/PCM (Table-8.3).
Above observation shows the recorded for second 10 days of March 2017 for panel which shows the power output, fill factor and efficiency with respect to the voltage and currentrecorded hourly from 9:00 AM to 04:00PM.The PV-Thermal system performance is mutual but separate into electrical efficiency and thermal efficiency. Theelectrical efficiency is affected by panel temperature and thermal coefficient of maximum power output. The electrical efficiency is almost stable than thermal efficiency in daily sunny days according to time. Such efficiencies slightly decrease during the central hours of the day due to the increase of the solar cells temperatures caused by the peak of solar radiation and outdoor temperature. Other side according to the solar radiation trend, higher electrical and thermal productions isobtained. The system was tested under various operating conditions.
Figure-8.1: Hot water out let.
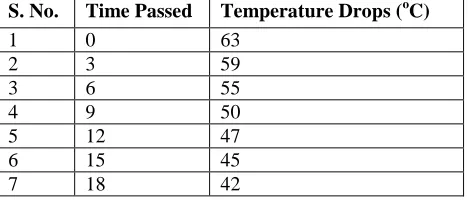
Table-8.4: Calculation of cooling rate of water in the tank after heating water for 7hrs. Sun light according to thermodynamic charging-discharging cycle of PCM.
S. No. Time Passed Temperature Drops (oC)
1 0 63
2 3 59
3 6 55
4 9 50
5 12 47
6 15 45
7 18 42
economical points of views.
Table-9.1: Comparison on thermalefficiencies values at different temperature at tilt angle 23.57 degree at various conditions as regarding gross area of thermal unit for third week of April 2017.
Time
AM to
PM T1 o C T2 o C T3 o C Direct radiation W/m2 Diffuse radiation W/m2 Global radiation W/m2 th
for Clear Panel th
for Partial Dusty th
for Full Dusty10:00 AM 35 25 30 465 150 615 33 30 25
11:00 AM 45 45 35 594 193 787 39 37 30
12:00Noon 50 39 43 682 207 890 43 40 35
01:00 PM 55 36 41 723 216 940 47 41 39
02:00 PM 61 63 52 729 217 945 49 42 35
03:00 PM 63 58 54 702 212 943 48 40 31
04:00 PM 61 63 50 639 197 831 45 36 30
05:00 PM 57 38 45 521 169 689 42 35 27
Graph-9.1: Graph between thermal efficiencies at different conditions with time.
10. OVERALL EFFICIENCY
The overall energy performance of the collectors can becompared by combining the values of the average thermaland electrical efficiencies: thecombine PVT collector presents value of 67.7% efficiency and the individual solar Thermal collector gives a value of 53.8% thermal efficiency. Even though the overall performance of the hybrid is 14.6% higher than that of the single collector,it cannot be concluded that the former is superior to thelatter: the selection of an optimal configuration will dependon the overall cost efficiency and energy balance of thesystems. Also, it is clear that the electrical performance ofPVT collectors depends on the cooling effect of the PVmodule from the PVT inlet fluid temperature and solarradiation also PCM plays main role to maintain PV cell temperature at lower level.
Table-10.1: Comparative values between photovoltaic module and hybrid photovoltaic module with weather condition for day 5/5/2017.
Photovoltaic System Hybrid Photovoltaic-Thermal System with PCM Status Cell
Temperatu re
(o C)
Maximum Electrical Power Output (W) PV Efficiency Cell Temperature (o C)
Maximum Electrical Power Output (W) PVTEle ctrical Efficien cy Thermal Efficiency Hybrid PV-Thermal Efficiency
m
Average 34 55.17 10.62 33.50 65.01 13.44 43 56.44
Maximu
m 50 96.31 11.34 40.78 109.2 13.69 54
67.69
Graph-10.1: Graph between PV and hybrid PV-T system efficiency for Maximum, Minimum and Average values.
11. CONCLUSION AND RECOMMENDATION
Hybrid PV/T solar system using phase change material have been studied in Mechanical & Energy Department at the University. These systems can be applied in houses and other type of buildings for the production of electricity and hot water simultaneouslyand are mainly suitable for applications under high values of solar radiation and ambient temperatures. The experimental results of the outdoors tests showed that thermos -phonic type of PV/T systems can provide hot water for domestic application and electricity at sufficient level.The effect of various parameters: solar panel type and quality, shading effect, electricity consumption, withdrawal rate, and heat source temperature on the system performance were studied. Final conclusion showed that:
1. The Temperature has effect on the system performance, but as the temperature of the body increases, the system will need more time to reach the steady state conditions to set equilibrium.
2. The withdrawal rate has a significant effect on the system performance. The system output and quantity were found to be inversely proportional.
3. The temperature of the heat source is the most important factor that influences the performance of the system. As this increases the system output affectsstrongly.
4. PVT is characterized by 56.35% higher efficiency than comparable conventional module.
Future recommendation will focus on efficient testing and exploration of commercial options. Modified structure and testing is needed to evaluate insulationoptions and assess the performance of other low cost materials and future work and research will involve modifying this design to meet the needs and materialsof other regions.
12. REFERENCES
[1] A.Hegazy; “AComparative study of the performances of four photovoltaic/thermal solar air collectors”; Energy Convers. Manage. Pp. 861–881. [2] Aste, N., Leonforte, F. and delPero, C. “Design, modeling and performance monitoring of a photovoltaic-thermal(PVT) water collector”; Sol. Energy,
112, Pp. 85–99, 2015.
[3] Bilbao, J.I. and Sproul, A.B.; “Detailed PVT-water model for transient analysis using RC networks”.Sol. Energy, 115, Pp. 680–693, 2015.
[4] Bougiatioti, F., Michael, A.; “The architectural integration of active solar systems.Building applications in theEastern Mediterranean region”.Renew. Sustain. Energy Rev., 47, Pp. 966–982, 2015.
[5] Buonomano, A., Calise, F. and Ferruzzi, G.; “Thermoeconomic analysis of storage systems for solar heatingandcooling systems: A comparison between variable-volume andfixed-volume tanks”. Energy, 59, Pp. 600–616, 2013.
[6] Chow, T.T.; “A review on photovoltaic/thermal hybrid solar technology”.Appl. Energy, 87 Pp. ,365-379, 2010.
[7] D. J. Yang, Z. F. Yuan, P. H. Lee, and H. M. Yin,; “Simulation and experimental validation of heat transfer in a novel hybrid solar panel”; International Journal of Heat and Mass Transfer 55, Pp. 1076-1082, 2012.
[8] Duffie, J.A. and Beckman,W.A.; “Solar Engineering of Thermal Processes”; JohnWiley& Sons, Inc.: New York, NY,USA, 1991.
[9] Dusonchet, L. and Telaretti, E.; “AComparative economic analysis of support policies for solar PV in the mostrepresentative EU countries”. Renew. Sustain. Energy Rev., Pp. 986–998, 2015.
[10] F. Sarhaddi, S. Farahat, H. Ajam, A. Behzadmehr, and M. MahdaviAdeli; “An improved thermal and electrical model for a solar photovoltaic thermal (PV/T) air collector”, Appl. Energy 87, Pp. 2328–2339, 2010.
12, 2008.
[14] Jaiganesh.K and Duraiswamy.K; “A Novel Design Technology of Photovoltaic Panel for Combined PV/T System” in International Journal of Electrical Engineering, Volume 06, No.1, 2013.
[15] Kern EC Jr.and Russel MC; “Combined photovoltaic and thermal hybridcollector systems”. In: Proceedings of the 13thIEEEphotovoltaicspecialists, Washington DC, USA, Pp. 1153–57, 1978.
[16] Kim J.-H., Park S.-H., Kang J.-G.and Kim, J.T. “Experimental performance of heating system withbuilding-integrated PVT (BIPVT) collector Energy”, Proced., 48, Pp. 1374–1384, 2014.
[17] Kumar, A., Baredar, P. and Qureshi, U.; “Historical and recent development of photovoltaic thermal (PVT)technologies”. Renew. Sustain. Energy Rev. 42, Pp. 1428–1436, 2015.