_____________________________________________________________________________________________________ *Corresponding author: Email: [email protected];
Societal Perspective of Cost Analysis of an Early
Intervention Programme for Autism Children and It’s
Contributing Factors in Klang Valley Malaysia, 2019
Mohammad Najib
1,2and Muhamad Hanafiah Juni
1*1
Department of Community Health, Faculty of Medicine, Universiti Putra Malaysia, Malaysia. 2
Ministry of Health, Malaysia.
Authors’ contributions
This work was carried out in collaboration between both authors. Author MN designed the study, performed the statistical analysis, wrote the protocol and wrote the first draft of the manuscript. Author MHJ cross-checked and endorsed the study design, the protocol, the results of the statistical analysis, and the final draft of the manuscript. Both authors read and approved the final manuscript.
Article Information
DOI: 10.9734/SAJSSE/2019/v4i330129 Editor(s): (1) Dr. Philippos I. Karipidis, Professor, Department of Agricultural Technology–Agricultural Economics (Former Agricultural Development and Agribusiness Management), Alexander Technological Educational Institute of Thessaloniki, Greece. (2)Dr. Velan Kunjuraman, Lecturer, Faculty of Hospitality, Tourism and Wellness, University Malaysia Kelantan (UMK), Kelantan, Malaysia. Reviewers: (1)Mustapha Immurana, Mangalore University, India. (2)Gabriela Ordaz Villegas Psicología, Universidad Nacional Autónoma de México, México. Complete Peer review History:http://www.sdiarticle3.com/review-history/50766
Received 18 June 2019 Accepted 23 August 2019 Published 30 August 2019
ABSTRACT
Autism spectrum disorder (ASD) is a public health concern globally, characterized by impairments in cognitive process, social functioning, communication skills, behaviours and interests. These problems require a multidisciplinary approach through an early intervention programme (EIP) which is remarkably expensive. To date, the knowledge of EIP costs for ASD children in Malaysia remains unknown. This study estimated the annual average costs of EIP for ASD children from the societal perspective (total average costs, education costs, treatment costs, and living costs), the relationship between the total annual average costs of EIP and its predictors. A cross-sectional cost analysis study using simple random sampling according to proportion was conducted among 280 parents of ASD children receiving EIP services in Klang Valley. The data were collected using interview-based questionnaire and proforma. The Activity-based Costing Technique was used to estimate the EIP-related costs. The non-parametric test was used for bivariate analysis and
multiple linear regression for the predictors. The result showed that the total annual average costs of EIP, average education costs, average treatment costs, and average living costs per ASD child were estimated at RM15,158; RM3,896; RM1,948; and RM4,409 respectively. There was a significant association (P = .05) between total annual average costs of EIP, and its contributing factors; family income, ASD level, programme characteristics, and family support. Multiple regression analysis showed that 27% of the total annual average costs of EIP can be predicted by the combination of these factors; EIP types, EIP frequency, centre-based type, ASD level and family income. In conclusion, the study determined the total annual average costs of EIP and its predictors. This information is beneficial as evidence to assist the decision on future resource allocation by the policy maker.
Keywords: Cost-analysis; total annual average costs; education costs; treatment costs; autism spectrum disorder; early intervention programme.
1. INTRODUCTION
Autism spectrum disorder (ASD) is a public health concern globally with increased prevalence over the last decade [1]. As one of the commonest developmental disability affecting children worldwide [2,3], ASD is characterized by impairments and restrictions in cognitive process, social functioning, communication skills, behaviors and interests [1,4,5]. The term “spectrum” reflects the wide variation in challenges and strengths possessed by each child with ASD. These problems mandated multidisciplinary assessment and management by a multidisciplinary team consisting of family medicine specialist, pediatrician, psychiatrist (child and adolescent), psychologist (clinical and educational), counsellor, occupational therapist, speech-language therapist, medical social worker, and education officers [6].
In managing ASD cases, an early intervention programme (EIP) is an important intervention to determine the magnitude of disease outcomes in term of cognitive, behavioral and social adaptability [6-8]. EIP should be offered to all children diagnosed with ASD as early as 36 months old to improve the outcomes. The models of EIP included home-based or centre-based program [9]; which involved integration of physical therapy, speech and language therapy, occupational therapy, psychological therapy, behavioral therapy, special education, social welfare and medical interventions [6,10]. To achieve the best outcome for children with ASD across lifespan, EIP can be one of the alternatives [11].
Regarding ASD’s assessment, diagnosis and treatment, it requires comprehensive, intensive and multisectoral management approach [6,10]. Since it requires a multisectoral approach, EIP is
a crucial component and it is very expensive [12]. Studies from developed countries such as United Kingdom and United States showed that, the total average costs of managing a child with ASD in a lifetime ranged from RM4.4 million to RM5.9 million [13]. However, the specific information on the total annual average costs of EIP per ASD child remains unknown in a centre-based EIP in Malaysia, as no study has been done before. Knowledge on average costs of programme (including average costs of EIP) is important for policy development and resource distribution [9,14,15].
The study was carried out to answer the question of what the annual average costs of EIP per ASD child (total average costs, education costs, treatment costs, and living costs) and its predictors in the centre-based EIP in Klang Valley, Malaysia from the societal perspective.
1.1 Epidemiology of ASD
children, or approximately 1 in 625 children [6, 18]. In terms of cognitive impairments, about 30% to 50% of children with ASD were estimated to have intellectual disability with IQ below 85 and have poorer adaptive behavior that contribute to ineffective social communication [19]. As indicated in the available scientific evidence currently, environmental and genetic factors were involved with development of ASD, and no clear evidence of a causal relationship between measles, mumps and rubella vaccine, and ASD [11,16]. Older parents are at a higher risk to have children born with ASD, and parents who have ASD child have a 2 to 18 percent chance of having a second child who would be affected by ASD [11].
An individual with ASD has limited capacity to perform daily works and have difficulties to participate in society, because of poor communication skills that may affect their educational and social attainments as well as
employment opportunities. While some
individuals with ASD can live independently, others have severe disabilities and require life-long care and support [5]. The children with ASD and their families may experience significant emotional and economic burden, by which children with more severe ASD require strong support for services accessibility and intensity. In the United States and United Kingdom, the lifespan costs to support a child with ASD was estimated at RM5.9 million and RM4.4 million, respectively [13]. Notwithstanding, with the presence of intellectual disability, higher costs were expected. Regarding medical expenditure, children with ASD incurred 4.1 higher cost compared to those children without ASD and it was expected to be increased exponentially following the rise in prevalence for the next decade, without an effective intervention [11]. In Malaysia, the total economic costs experienced by parents was estimated at RM35,365 per year [10].
1.2 Review of Factors Contributing to ASD-Related Costs
A systematic review was conducted alongside
with the research development to
comprehensively assess the factors contributing to the EIP-related costs for ASD children. The systematic search was conducted based on the research question on what are the contributing factors of the average cost of EIP among ASD children. The objective of the review was to identify the average costs of EIP among ASD
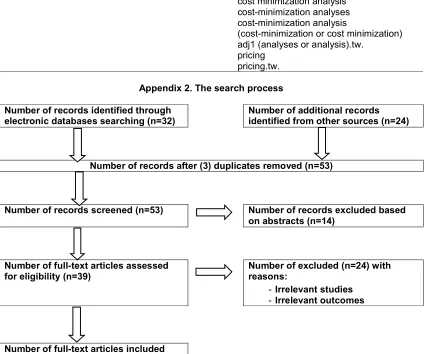
children from various sources. The search was conducted through electronic database Ovid MEDLINE® from 1946 to November 16, 2018 using the combination of Medical Subject Headings (MeSH) keywords and its related scopes available as follows; “Autism Spectrum Disorder” or “Autistic Disorder” and "Early Intervention (Education)" or “Early Medical Intervention” and "Costs and Cost Analysis". General search engine was used through Google Scholar to search for additional related articles using similar keywords combination. The detailed information on keywords and their combination was tabulated in Appendix 1. The search
exercise was focused on the economic
evaluation studies pertaining to ASD and its intervention, full text articles, scholarly journals and English articles that were published for the past 20 years. After selection, checking for duplicates, and hand search, 15 articles were finally selected, and their contents were then reviewed (see Appendix 2–The search process according to PRISMA guideline). Two review authors extracted data independently from each study regarding type of study, type of intervention, year of publication, journal, outcomes of the study, and the location of study. The quality of the reviewed articles was not further assessed as the credit of journals was considered enough. Based on the medical model of health determinants adapted from Dahlgren and Whitehead (1991) framework, the retrieved factors were categorized into sociodemographic factors (age of child, family income, residence location), medical condition factor (ASD level), health service factors (centre-based type, programme characteristics), and environmental factors (family support, EIP centre distance). The summary of results on factors contributing to ASD costs was tabulated in Appendix 3.
1.3 Costs Concept
follow three distinctive steps: the first step is identification of resources used to deliver the service, second is the measurement of resource utilization in natural units, and the third one is attaching monetary value to resource used [20].
1.4 Costing Methodology
The common costing methods used in healthcare are the traditional step-down approach (macro-costing), micro-costing and activity-based costing (ABC). Macro-costing is a top-down approach, it involves the process of allocating overhead cost to the departments or the units of services based on service volume to estimate the average unit costs. Micro-costing approach involves the collection of data about resource use by each individual service (item-by-item and line-by-line). This bottom-up approach can be used where the accuracy of resource measurement is important, contingent on data availability, and whether it is feasible in an economically sensible way. Micro-costing is the most precise estimation compared to the traditional macro-costing approach, which is based on average estimation including case-mix, disease cost per diem and average cost per diem. The ABC method involves the step-down approach at first. Next, the shared activities need to be identified (activity-centre) and the total cost will be allocated down to the departments in proportion according to their consumption of resources (cost driver). The department costs will then be divided into its service volume to estimate the unit costs. The cost calculated will be the average cost and presented as average cost per contact point or per visit or per service [20].
2. METHODOLOGY
A cross-sectional costs analysis study using simple random sampling according to proportion was conducted among 280 parents of ASD children receiving EIP services in the Klang Valley, which include government and
non-government EIP centres. Parents of all ASD children aged less than 7 years old which enrolled in EIP centres in the Klang Valley were included, and those ASD children with other co-morbidities were excluded from the study. The required sample size was calculated according to the hypothesis testing formula for two groups by Lemeshow et al. (1990). To get an adequate sample unit from the sampling frame, 2 government and 2 non-government EIP centres that match the centre-based criteria were selected using the lottery method. The data on contributing factors were collected using interview-based questionnaire anda proforma was used to obtain the data on EIP-related costs. The research instrument was administered and retrieved personally by the researcher. The instrument for the study was submitted to health
economics experts for validation. The
Cronbach’s Alpha and Intra-Class Correlation were used to determine the reliability of the instrument. Both descriptive and inferential statistics were performed. The relationship between the total annual average cost of EIP and its predictors were carried out using non-parametric tests.
The cost components included were the direct costs for EIP-related intervention. The indirect costs such as parents’ productivity loss, time-off work, and opportunity cost were excluded from the estimation. The provider costs (including capital, staff, utilities, maintenance) were estimated using an ABC method that estimates the total annual average costs of EIP according to the proportion of resources allocated for EIP services. The patient cost was estimated from the reported annual out-of-pocket expenditure (OOP) by the parents, and the breakdown of cost was estimated based on the proportion of annual OOP for ASD-related intervention [21]. From the societal perspective, the total annual average costs of EIP in each centre were estimated using the formula as follows:
∑( + + + + )
1
costs of building and asset
2salary and allowances for the multidisciplinary team and administrative officers 3electrical bills, water bills, internet bills, phone bills, security services
4
3. RESULTS AND DISCUSSION
In this study, the overall response rate was 93.3%. The distribution of continuous variables was determined statistically. The Shapiro-Wilk test was significant (P = .05) for all continuous variables, showing the data is not normally distributed. Thus, the non-parametric tests were used to determine the relationship between the contributing factors and the study outcome.
3.1 Descriptive Statistics
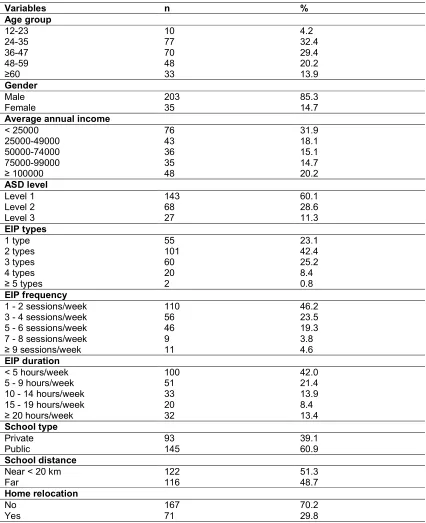
The components of descriptive statistics were specified in Table 1. The median age of ASD children was 37 months old, Interquartile range (IQR) (30,48). The range of children’s age was 69 months with the youngest at 15 months old and the oldest at 84 months old. In general, EIP services were provided by most EIP centres among preschool age group of ASD children, because EIP is believed by many to be most effective when provided at an early age [8,10]. In Malaysia, the EIP service provision in the public centre-based was limited to the preschool age to date, and most EIP centres were concentrated in urban areas because demand for services is higher compared to the rural areas. The gender for both male and female were not equally distributed with the percentages being 85.3% and 14.7% respectively. The finding corresponds with the global prevalence of ASD that showed males are four times more likely to be diagnosed with ASD than females [11,17]. The family income distribution shows that 79.8% of the respondents were earning less than RM100,000 per year. The distribution of ASD severity among respondents’ children was defined by the level of support, according to the Clinical Practice Guidelines (CPG) Malaysia, (2014) which adopted the DSM-IV criteria. The severity of ASD was categorized into three level; Level 1 (Requiring support), Level 2 (Requiring substantial support) and Level 3 (Requiring very substantial support). The data on parent’s support was retrieved during parents’ interview on sharing their experience in handling and managing ASD children in the public and community activities. The reported support level for ASD children, mostly fall within the category of Level 1and 2 ASD (88.7%), followed by a small portion of ASD children within Level 3 (11.3%).
The features of health services involved the types of EIP consumed, programme intensity (EIP frequency and duration), and centre-based
type. As a multidisciplinary approach
intervention, EIP incorporated various types of interventions such as Applied Behavioural Analysis (ABA) therapy, speech therapy, occupational therapy, sensory integration and music therapy [6]. The finding shows that 76.9% of respondents’ child received more than 1 EIP types per session, 53.8% received more than 2 EIP sessions per week and 58% received more than 5 hours of EIP sessions per week. Around 60.9% of ASD children received EIP at a public EIP centre. Regarding the distance of EIP centre, 51.3% of the respondents stay near (less than 20km). The range of the nearest and the farthest EIP centre distance was 60km. In assessing EIP-related services, home relocation was reported by 29.8% of respondents due to logistic reasons such as change to a new workplace that was near to the EIP centre, moving to a house nearer to the EIP centre and other reasons.
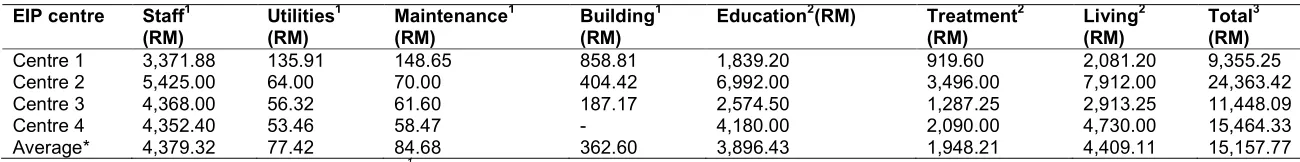
3.2 Estimation of Total Annual Average Costs of EIP
The summary of the total annual average costs of EIP from the societal perspective can be seen in Table 2. The detailed information on cost estimation for each category was tabulated in Appendix 4. The component of staff emolument is the highest burden estimated for the total annual average costs of EIP from the provider perspective (75% to 95%).
The total annual average costs of EIP, education costs, treatment costs, and living costs per ASD child were estimated at RM15,158; RM3,896; RM1,948; and RM4,409 respectively. The estimated total annual average costs of EIP per ASD child in selected government EIP centres ranged from RM 9,358 to RM24,384, and from RM11,437 to RM15,458 for non-government EIP centres. Centre 1 shows the lowest cost estimate because it is partially sponsored by the government. In contrast to Centre 2, the highest costs were due to lower student staff ratios (1 EIP staff to 4 ASD children) compared to other centres with higher ratios (1 EIP staff to 6 ASD children). In addition, Centre 2 adopted the university hospital financial structure under the Ministry of Education. Higher cost estimates for non-governmental EIP centres have been expected as they involve profit-related components (Centre 3 and Centre 4).
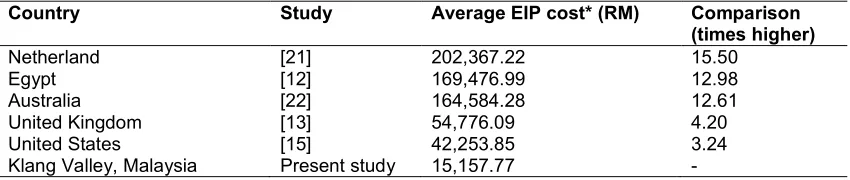
the relationship between state and family OOP expenditure. The cost estimation was 15.5 times higher compared to the current study, because the bottom-up prevalence-based cost-of-illness methodology was adopted from a societal perspective. The cost of special needs assistants
and the parent’s time-off were incorporated in the cost estimation. Similar study incorporated the cost estimation from an older age-group, of which 2 to 18 years old ASD children were involved, and mostly received private ASD-related care services [21].
Table 1. Descriptive statistics of the factors contributing to the total annual average costs of EIP (N=238)
Variables n %
Age group
12-23 10 4.2
24-35 77 32.4
36-47 70 29.4
48-59 48 20.2
≥60 33 13.9
Gender
Male 203 85.3
Female 35 14.7
Average annual income
< 25000 76 31.9
25000-49000 43 18.1
50000-74000 36 15.1
75000-99000 35 14.7
≥ 100000 48 20.2
ASD level
Level 1 143 60.1
Level 2 68 28.6
Level 3 27 11.3
EIP types
1 type 55 23.1
2 types 101 42.4
3 types 60 25.2
4 types 20 8.4
≥ 5 types 2 0.8
EIP frequency
1 - 2 sessions/week 110 46.2
3 - 4 sessions/week 56 23.5
5 - 6 sessions/week 46 19.3
7 - 8 sessions/week 9 3.8
≥ 9 sessions/week 11 4.6
EIP duration
< 5 hours/week 100 42.0
5 - 9 hours/week 51 21.4
10 - 14 hours/week 33 13.9
15 - 19 hours/week 20 8.4
≥ 20 hours/week 32 13.4
School type
Private 93 39.1
Public 145 60.9
School distance
Near < 20 km 122 51.3
Far 116 48.7
Home relocation
No 167 70.2
7
Table 2. The estimation of total annual average costs of EIP from societal perspective (N=238)
EIP centre Staff1 (RM)
Utilities1 (RM)
Maintenance1 (RM)
Building1 (RM)
Education2(RM) Treatment2 (RM)
Living2 (RM)
Total3 (RM)
Centre 1 3,371.88 135.91 148.65 858.81 1,839.20 919.60 2,081.20 9,355.25
Centre 2 5,425.00 64.00 70.00 404.42 6,992.00 3,496.00 7,912.00 24,363.42
Centre 3 4,368.00 56.32 61.60 187.17 2,574.50 1,287.25 2,913.25 11,448.09
Centre 4 4,352.40 53.46 58.47 - 4,180.00 2,090.00 4,730.00 15,464.33
Average* 4,379.32 77.42 84.68 362.60 3,896.43 1,948.21 4,409.11 15,157.77
1
Average annual costsof EIP per ASD child (provider perspective)
2
Average annual costsof EIP per ASD child (patient perspective)
3
Total annual average costs of EIP per ASD child from each centre
*
Also, higher cost was demonstrated in Egypt because home-based EIP was practiced widely as an intervention of choice, due to limitation of an EIP-related services by the state provider [12]. In view of the above, the parent’s involvement in providing EIP as a home-based programme was estimated as the full time equivalent (FTE) cost per hour based on the salary rate of EIP staff in centre-based setting. The cost parameters were estimated solely based on the home-based EIP resource utilization by ASD child’s family. In the above study, the total estimated cost was mostly influenced by staff cost due to low staff to student ratio observed in the home-based EIP, of which 1 private therapist to 1 ASD child ratio per home EIP session existed.
In Australia, a cost analysis study was conducted to compare the expenses between families with
immediate ASD diagnosis following an
identification of atypical neuro-developmental delay with families that experienced a delay between first identification and ASD diagnosis. The estimated total ASD-related cost was 12.6 times higher compared to the current study, because the components of treatment-related travel cost, family productivity loss and medical costs were included in the cost estimation, apart from the ASD-therapeutic cost. The total average cost of ASD-related treatments from this study were contributed mainly by loss of income of the parents and caregivers (89%), followed by ASD-related travel costs (3%) and treatment costs (8%) [22].
The cost estimation in both UK and US was 3 to 4 times higher compared to the current study. In UK, the ASD-related treatment costs were estimated by the accumulation of more comprehensive cost components including medical, nonmedical, and indirect economic and lifetime costs [13]. Similar approach was demonstrated in US, whereby an extensive cost
component was incorporated in the cost estimation including health care, education, ASD-related therapy, family-coordinated services, and caregiver time [15]. The above study measures
the annual utilization and costs for health care, EIP centre services, ASD-related
therapies, family-coordinated services, and
caregiver time. More cost components
incorporated to estimate an economic cost of ASD-related care services. For an instance, the healthcare utilization cost for ASD included were
hospitalizations, office and emergency
department visits, home health care, dental care visits, and prescription drug use.
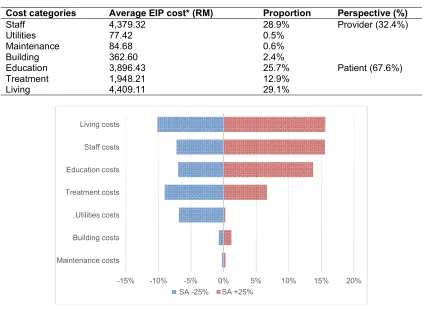
In this study, the component of patient cost is the highest burden estimated for the total average EIP cost (67.6%), followed by other cost components (Table 4). This finding was expected considering the substantial level of support required from the family in managing ASD-related disabilities, including direct and indirect costs incurred for EIP-related services, such as EIP fees, transportation, time allocated and other opportunity costs. From the perspective of the EIP service provider, the staff cost is the highest burden identified, apart from the patient cost. Similar findings were reported in the US, UK and Australia, by which the multisectoral approach that have a multidisciplinary staff involved in the EIP centre were the biggest contributor to costs associated with ASD [9,15]. The finding accounted for 60%-80% of EIP’s programme cost, due to the increased use of multi-therapies and special education services. In estimating the future burden on EIP cost, we performed the deterministic sensitivity analysis to test the robustness of cost analysis towards multiple parameters within the base value (average EIP cost per ASD child in 2018); to check the extent of the possible economic impact of current cost analysis. The finding shows similar trend with more than 60% of average EIP cost was contributed by the staff emoluments.
Table 3. Comparison of total annual average cost of EIP with other countries (N=238)
Country Study Average EIP cost* (RM) Comparison
(times higher)
Netherland [21] 202,367.22 15.50
Egypt [12] 169,476.99 12.98
Australia [22] 164,584.28 12.61
United Kingdom [13] 54,776.09 4.20
United States [15] 42,253.85 3.24
Klang Valley, Malaysia Present study 15,157.77 -
Table 4. Comparison of total annual average cost of EIP with other countries (N=238)
Cost categories Average EIP cost* (RM) Proportion Perspective (%)
Staff 4,379.32 28.9% Provider (32.4%)
Utilities 77.42 0.5%
Maintenance 84.68 0.6%
Building 362.60 2.4%
Education 3,896.43 25.7% Patient (67.6%)
Treatment 1,948.21 12.9%
Living 4,409.11 29.1%
Fig. 1. Univariate sensitivity analysis for the average EIP cost (N=238)
3.2.1 Sensitivity analysis
The Deterministic Sensitivity Analysis (DSA) was done to test the robustness of the conclusions, by determining how the values of cost parameters impact the total annual average costs of EIP in the next 5 years under a set of assumptions as follows; fixed number of students in EIP center, fixed number of EIP staff, fixed EIP programme structure, and 3% discounting applies for the next 5 years. DSA was performed towards multiple parameters within the base value (total annual average costs of EIP per ASD child); to check the extent of the possible economic impact of current cost analysis. A Univariate SA was conducted to assess the parameters by varying ±25% of the base value (Fig. 1). The DSA shows that the total annual average costs of EIP is most sensitive towards the living costs, staff cost, and education costs compared to others (about 14% to 15% positive incremental following increase 25% of the base values, and 7% to 10% negative incremental following decrease 25% of the base values).
3.3 Bivariate Analysis
Using Kruskal-Wallis test, these factors are significant (P value <.05); children age, annual family income, ASD level, EIP types, EIP frequency and EIP duration. For binomial variables, Mann-Whitney U test was used, and the test showed significant results (P value <.05) with these factors; based type, centre-based distance, home relocation and family support. Therefore, the null hypothesis for those factors were rejected.
3.4 Multivariate Analysis
Multiple linear regression (MLR) was used to identify the predictors for the total annual average costs of EIP. Eight variables were included in the primary model which were family income, ASD level, EIP types, EIP frequency, EIP duration, centre-based type, relocation, and family support. The included variables were chosen at the significance level of P value less than 0.25, based on the work by Bendel and Afifi (1977) on linear regression. All variables were
-15% -10% -5% 0% 5% 10% 15% 20%
Maintenance costs Building costs Utilities costs Treatment costs Education costs Staff costs Living costs
categorized into two groups. Reference groups (were labelled as 0) for each significant variable were identified as follows; annual parents’ income less than RM100,000, low level of ASD (Level 1 and 2), EIP types (1 type per week), EIP frequency (less than 3 sessions per week), EIP duration (less than 5 hours per week), public EIP centre, parents who not relocated for ASD-related services, and low family support level. They were analyzed using ‘ENTER’ and ‘STEPWISE’ methods. Assumptions for multiple linear regression were checked. Partial regression plots for linear relationship was not done in view of categorical data. There was no multicollinearity and no significant outlier. Residual was normally distributed as observed by Q-Q plot of studentized residual. A model generated by ‘ENTER’ method having the highest adjusted R square and was chosen as the preliminary model.
For the preliminary model, the multiple regression statistically significant predicted average of EIP cost, F (7,957) = 12.506, P=.05, adj. R2 = 0.280.However, only five were statistically significant to the prediction (P=.05), except for EIP duration (P=.257), home relocation (P=.172) and family support (P=.099). The five significant variables were EIP type, EIP frequency, centre-based type, ASD level, and family income. For the final model, the multiple regression model statistically significant predicted average EIP cost, F (8,001) = 12.506,
P=0.05, adj. R2 = 0.270. The summary of multiple linear regression can be seen in Table 5.
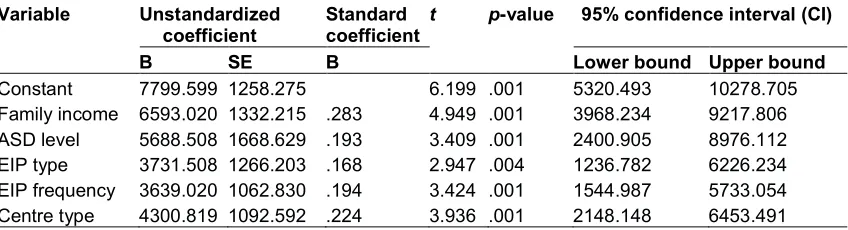
The final predictive model was derived as follow: Total annual average costs of EIP = 7799.599 + 6593.020 (family income) + 5688.508 (ASD level) + 3731.508 (EIP type) + 3639.020 (EIP frequency) + 4300.819 (centre-based type).
Inference was be made to reference group. Based on the final model, 27% of average EIP cost can be explained by the predictors. Respondents with annual family income of more than RM100,000 are expected to have RM6,593 higher cost than the families with lower annual family income. Respondents having more severe ASD children (Level 3) require RM5,688 higher cost in providing support compared to less severe ASD children (Level 1 and 2). Respondents with ASD children received more than 1 type of EIP per session require RM3,732 higher cost than the counterpart. Respondents with ASD children received 3 and more EIP sessions per week require RM3,639 higher cost than the counterpart. Respondents with ASD children in the private EIP centre-based require RM4,300 higher cost than children in the public EIP centre-based.
In determining the financial burden of families with ASD child, there was a significant difference between household income groups with services rehabilitation (P = .05). To improve the health outcome, the families with above average
household income groups put a higher
commitment to their child’s therapy, compared to lower household income group [10]. Among the very low-income group, trade-offs were made between expenditures for the special needs’ child and basic living expenses and between care of children and other demands. The complex relationships between disability, poverty, and welfare does expose the families with ASD children at greater risk of experiencing financial hardship [23]. The demands of autism diagnosis and treatment in lower household income group can seriously outstrip the family resources. In US, the annual cost of intervention for ASD child was estimated 3 to 5 times higher among very dependent and semi dependent group of ASD
Table 5. Summary of multiple linear regression (N=238)
Variable Unstandardized coefficient
Standard coefficient
t p-value 95% confidence interval (CI)
B SE B Lower bound Upper bound
Constant 7799.599 1258.275 6.199 .001 5320.493 10278.705
Family income 6593.020 1332.215 .283 4.949 .001 3968.234 9217.806
ASD level 5688.508 1668.629 .193 3.409 .001 2400.905 8976.112
EIP type 3731.508 1266.203 .168 2.947 .004 1236.782 6226.234
EIP frequency 3639.020 1062.830 .194 3.424 .001 1544.987 5733.054
children, compared to normal children [24]. Due to severe restriction in cognitive, social communication and rigidity of behaviour, high ASD level usually require child assistance that able to monitor the child all the time. In UK, cost for ASD child with more severe levels (presence of an intellectual disability) require 2 to 3 times higher cost compared to ASD child without intellectual disability [25], of which greater resources incurred to the families and caregivers for an intensive EIP-related therapy. The largest contributors to total costs in across all age groups were special education, including early intervention services, and indirect costs, such as parental productivity loss. Regarding the programme characteristics, the school services were the biggest contributor to costs associated with childhood ASD (P = .05), due to the increased use of special education services [15].
Other retrieved factors such as intellectual disability and comorbidities were excluded from the present study because different setting and practice were implemented in Malaysia. In terms of severity classification, the level of intelligent quotient (IQ) is not a requirement for ASD children that is diagnosed in Malaysia, compared to the practice from other country, which incorporated the element of IQ in classifying the
severity of ASD [22,23,26]. Regarding
comorbidities, it was reported by several to have relationship with the ASD-related intervention and management [10,15,23,27]. Nonetheless, this factor was also excluded because it is one of the present study’s exclusion criteria.
4. CONCLUSION
The total annual average costs of EIP, average education costs, average treatment costs, and average living costs per ASD child were estimated at RM15,158; RM3,896; RM1,948; and RM4,409 respectively. There is a relationship between total annual average costs of EIP, and its contributing factors as follows; family income, ASD level, EIP types, EIP frequency, EIP duration, centre-based type, home relocation, and family support. Following the multiple regression analysis, the finding shows that 27% of an average EIP cost can be predicted by the combination of these factors; EIP types, EIP frequency, centre-based type, ASD level and family income.
CONSENT
All authors declare that ‘written informed consent was obtained from the patient (or other approved
parties) for publication of this case report and accompanying images. A copy of the written consent is available for review by the Editorial office/Chief Editor/Editorial Board members of this journal.
ETHICAL APPROVAL
This study was registered under the National Medical Research Register, Ministry of Health, Malaysia (Ref.: NMRR-19-936-45682). The ethical approval to carry out this research was obtained from the Human Ethical Committee of Universiti Putra Malaysia (Ref.: JKEUPM-2019-080). Permission was obtained from the facilities involved in the study [(Ref.: KURNIA.600-8/2/2(10) dated 22 April 2019); (UKM FND/237/2 dated 23 April 2019); approval feedback forms (Lampiran E dated 10 May 2019 and 17 May 2019)]. The consent from respondents (parents) was obtained prior to the data collection.
ACKNOWLEDGEMENTS
The authors would like to thank the supervisory committee, lecturers, colleagues and others from the Department of Public Health, Faculty of Medicine and Health Sciences, Universiti Putra Malaysia, for their cooperation throughout our successful research process and publication.
COMPETING INTERESTS
Authors have declared that no competing interests exist.
REFERENCES
1. Lavelle TA. Examining health and
economic outcomes associated with
pediatric medical conditions in the United States. Harvard University; 2012.
2. World Health Organization. Children and Neurodevelopmental Behavioral Intellectual Disorders (NDBID) in Children’s Health and the Environment WHO Training Package for the Health Sector. 2011:1–51. 3. Adab N, et al. Children and neuro-developmental behavioral intellectual disorders. Int. J. Epidemiol. 2014;12(3):1-51.
4. American Psychiatric Association. Autism spectrum disorder. Curr. Biol. 2013;15(19): R786–R790.
singapore and Malaysia. Int. J. Spec. Educ. 2014;29(3):82–92.
6. M. Ministry of Health, Clinical Practice
Guideline Management of Autism
Spectrum Disorder in Children and Adolescent; 2014.
7. Cidav Z, Munson J, Estes A, Dawson G, Rogers S, Mandell D. Cost offset associated with early start denver model for children with autism. J. Am. Acad. Child Adolesc. Psychiatry. 2017;56(9):777–783. 8. Autism Speaks. What Is Autism? 2018.
Available:https://www.autismspeaks.org/w hat-autism
[Accessed: 14-Oct-2018]
9. Escobar CM, Barnett WS, Goetze UD. Cost analysis in early intervention. J. Early Interv. 1994;18(1):1.
10. Kamaralzaman S, Toran H, Mohamed S, Abdullah NB. The economic burden of families with autism spectrum disorders (ASD) children in Malaysia. J. ICSAR. 2018;2(1):71–77.
11. Autism Speaks. Autism facts and figures; 2018.
Available:https://www.autismspeaks.org/au tism-facts-and-figures
[Accessed: 17-Oct-2018]
12. Mendoza. The Economics of Autism in Egypt. Am. J. Econ. Bus. Adm. 2010;2(1): 12–19.
13. Buescher AVS, Cidav Z, Knapp M, Mandell DS. Costs of autism spectrum disorders in the United Kingdom and the United States. JAMA Pediatr. 2014;168(8):721–728. 14. Ganz ML. The lifetime distribution of the
incremental societal costs of Autism. Arch. Pediatr. Adolesc. Med. 2007;161(4):343. 15. Lavelle TA, Weinstein MC, Newhouse JP,
Munir K, Kuhlthau KA, Prosser LA. Economic burden of childhood autism spectrum disorders. Pediatrics. 2014; 133(3):e520–e529.
16. WHO. Key Facts. World Health
Organization Web Page; 2018. Available:https://www.who.int/news- room/fact-sheets/detail/autism-spectrum-disorders
[Accessed: 24-Sep-2018]
17. CDC. Prevalence of Autism Spectrum Disorder Among Children Aged 8 Years — Autism and Developmental Disabilities Monitoring Network, 11 Sites, United States, MMWR. Surveill. Summ. 2014; 67(6):1–23.
18. Azizan H. The burden of autism. The star online-for write up; 2008.
Available:http://www.thestar.com.my/story/ ?file=/2008/4/27/focus/21080181&sec=foc us
[Accessed: 28-Sep-2018]
19. Charman T, Pickles A, Simonoff E, Chandler S, Loucas T, Baird G. IQ in children with autism spectrum disorders: Data from the special needs and autism project (SNAP). Psychol. Med. 2011;41(3): 619-627.
20. Drummond MF, Sculpher MJ, Claxton K, Stoddart GL, Torrance GW. Methods for the economic evaluation of health care programmes (4th Edition); 2015.
21. Roddy A, O’Neill C. The economic costs and its predictors for childhood autism spectrum disorders in Ireland: How is the burden distributed? Autism; 2018.
22. Horlin C, Falkmer M, Parsons R, Albrecht MA, Falkmer T. The cost of autism spectrum disorders. PLoS One. 2014;9(9). 23. Sharpe DL, Baker DL. Financial issues
associated with having a child with autism. J. Fam. Econ. 2007;28(2):247–264. 24. Motiwala SS, Gupta S, Lilly MB, Ungar WJ,
Coyte PC. The cost-effectiveness of expanding intensive behavioural inter-vention to all autistic children in Ontario,” Healthc. Policy. 2006;1(2):135–51.
25. Knapp M, Romeo R, Beecham J.
Economic cost of autism in the UK. Autism, 2009;13(3):317–336.
26. Knapp M, Romeo R, Beecham J. The economic consequences of autism in the UK. Found. People with Learn. Disabil. 2007;1-29.
Appendix 1 - Ovid keywords
Question: What are the factors associated with the costs of EIP for children with ASD?
Search terms
PICO MeSH Term Free Text/Text Word
P= children with ASD Autism Spectrum Disorder autism spectrum disorder autism spectrum disorders spectrum disorders, autism autism adj1 spectrum disorder*.tw.
Autistic Disorder Autism
Autism.tw.
autism, early infantile early infantile autism infantile autism, early early infantile adj1 autism.tw. autism, infantile
infantile adj1 autism.tw. autistic disorder disorder, autistic disorders, autistic autistic adj1 disorder*.tw. infantile autism
infantile autism.tw. kanner syndrome kanners syndrome
kanner* adj1 syndrome.tw. kanner's syndrome kanner's syndrome.tw. I= early intervention "Early Intervention
(Education)"
early intervention early interventions intervention, early interventions, early early adj1 intervention*.tw. head start program head start program program, head start
head start adj1 program*.tw. Early Medical Intervention early medical intervention
early medical interventions intervention, early medical interventions, early medical early medical adj1 intervention*.tw. medical intervention, early
medical interventions, early early adj1 medical intervention*.tw. C=
O= cost analysis "Costs and Cost Analysis" analyses, cost analysis, cost cost analyses cost analysis
cost adj1 (analyses or analysis).tw. analyses, cost-minimization analysis, cost-minimization
PICO MeSH Term Free Text/Text Word
comparison, cost comparisons, cost cost comparison cost comparisons
cost adj1 comparison*.tw. cost
costs cost*.tw.
cost, cost analysis costs, cost analysis cost analysis adj1 cost*.tw. cost measure
cost measures measure, cost measures, cost cost adj1 measure*.tw. cost minimization analysis cost-minimization analyses cost-minimization analysis
(cost-minimization or cost minimization) adj1 (analyses or analysis).tw.
pricing pricing.tw.
Appendix 2. The search process
Number of records identified through electronic databases searching (n=32)
Number of additional records identified from other sources (n=24)
Number of records after (3) duplicates removed (n=53)
Number of records screened (n=53) Number of records excluded based on abstracts (n=14)
Number of full-text articles assessed for eligibility (n=39)
Number of excluded (n=24) with reasons:
- Irrelevant studies
- Irrelevant outcomes
Number of full-text articles included (n=15)
Appendix 3. Results of factors contributing to ASD costs
Based on the systematic review on factors associated with ASD-related costs in this study, the results were tabulated in
Error! Not a valid bookmark self-reference.
.Table 1. Summary of factors associated with the cost of ASD-related management and interventions
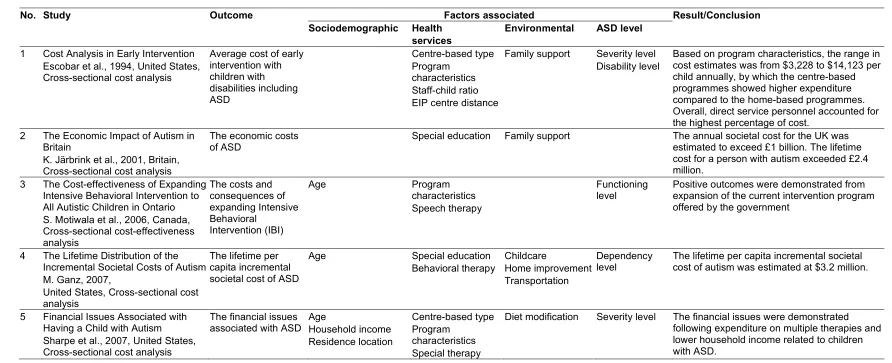
No. Study Outcome Factors associated Result/Conclusion
Sociodemographic Health services
Environmental ASD level
1 Cost Analysis in Early Intervention Escobar et al., 1994, United States, Cross-sectional cost analysis
Average cost of early intervention with children with disabilities including ASD
Centre-based type Program
characteristics Staff-child ratio EIP centre distance
Family support Severity level Disability level
Based on program characteristics, the range in cost estimates was from $3,228 to $14,123 per child annually, by which the centre-based programmes showed higher expenditure compared to the home-based programmes. Overall, direct service personnel accounted for the highest percentage of cost.
2 The Economic Impact of Autism in Britain
K. Järbrink et al., 2001, Britain, Cross-sectional cost analysis
The economic costs of ASD
Special education Family support The annual societal cost for the UK was
estimated to exceed £1 billion. The lifetime cost for a person with autism exceeded £2.4 million.
3 The Cost-effectiveness of Expanding Intensive Behavioral Intervention to All Autistic Children in Ontario S. Motiwala et al., 2006, Canada, Cross-sectional cost-effectiveness analysis
The costs and consequences of expanding Intensive Behavioral
Intervention (IBI)
Age Program
characteristics Speech therapy
Functioning level
Positive outcomes were demonstrated from expansion of the current intervention program offered by the government
4 The Lifetime Distribution of the Incremental Societal Costs of Autism M. Ganz, 2007,
United States, Cross-sectional cost analysis
The lifetime per capita incremental societal cost of ASD
Age Special education
Behavioral therapy
Childcare
Home improvement Transportation
Dependency level
The lifetime per capita incremental societal cost of autism was estimated at $3.2 million.
5 Financial Issues Associated with Having a Child with Autism
Sharpe et al., 2007, United States, Cross-sectional cost analysis
The financial issues associated with ASD
Age
Household income Residence location
Centre-based type Program
characteristics Special therapy
No. Study Outcome Factors associated Result/Conclusion Sociodemographic Health
services
Environmental ASD level
6 Cost Comparison of Early Intensive Behavioral Intervention and Special Education for Children with Autism G. Chasson et al., 2007, Texas, Cross-sectional cost comparison
The costs of special education for ASD
Age Behavioral therapy
Program intensity Staff: child ratio
Disability level Total cost-saving following early behavior therapy would save $2.09 billion to the healthcare provider.
7 Economic Cost of Autism in the UK
Knapp et al., 2009, United Kingdom, Cross-sectional cost analysis
The economic consequences of ASD
Age
Residence location
Special education Centre-based type Program
characteristics
Family support Intellectual disability
Depending on age, the average annual cost per child with ASD without intellectual disability ranged from £1214 to £21,090. With presence of intellectual disability, the lifetime cost of ASD was 50 percent higher compared to ASD without intellectual disability.
8 The Economics of Autism in Egypt
R. Mendoza, 2010, Egypt, Cross-sectional cost analysis
The economic costs of ASD
Age
Household income Educational level Residence location
Centre-based type Program
characteristics Behavior therapy EIP centre distance
Family support The home-based program was widely
implemented by most Egyptian families with ASD members, compared to the centre-based programmes in most of the developed country.
9 Autism Spectrum Disorders and
Health Care Expenditures G. Peacock et al., 2012, United States, Cross-sectional cost analysis
The mean
expenditures among children with ASD
Age isability The medical expenditure for ASD child is
higher with the presence of an intellectual disability, compared to other factors.
10 The cost of autism spectrum disorders
C. Horlin et al., 2014, Australia, Cross-sectional cost analysis
The costs of ASD Age Fupport Intellectual
disability
The costs needed to support the development of children with ASD may have detrimental consequences for the wellbeing of the child with ASD and family members, especially for low income families.
11 Economic Burden of Childhood Autism Spectrum Disorders T. Lavelle et al., 2014, United States, Cross-sectional cost analysis
The annual utilization and costs for health care, EIP centre services, ASD-related therapies, family-coordinated services, and caregiver time
Special education Centre-based type
Sey level In all children with parent-reported ASD, the EIP centre services were the biggest
No. Study Outcome Factors associated Result/Conclusion Sociodemographic Health
services
Environmental ASD level
12 Costs of autism spectrum disorders in the United Kingdom and the United States
A. Buescher et al., 2014, United Kingdom & United States, Cross-sectional cost analysis
The costs of ASD Age Special education Child care
Family support
Intellectual disability
The cost of supporting an individual with an ASD without intellectual disability was $1.4 million in the United States and £0.92 million (US $1.4 million) in the United Kingdom. The largest cost components for children were special education services and parental productivity loss.
13 Comparing service use and costs among adolescents with autism spectrum disorders, special needs and typical development
B. Barret et al., 2015, United Kingdom, Cross-sectional cost analysis
The services and associated costs for ASD
Age Special education Severity level
Disability level
In regression analysis, lower age and lower adaptive functioning were associated with higher costs in the groups with an autism spectrum disorder
14 The economic costs and its predictors for childhood autism spectrum disorders in Ireland: How is the burden distributed
A. Roddy et al., 2018, Netherland, Cross-sectional cost analysis
The societal cost of childhood ASD and relationship between state and family OOP expenditure
Household income Centre-based type
Special education
Family support Severity level Intellectual
disability
The average cost of ASD-related management and interventions per child incurred by the families was estimated at €28,464.89 per year. Families that had a child whose ASD severity was classified as level 2 moderate under DMS-5 criteria were found to have €3100.48 more out-of-pocket expenditure in comparison to families who had a child with level 1 mild ASD 15 The economic burden of families
with autism spectrum disorders (ASD) children in Malaysia S. Kamaralzaman et al., 2018, Malaysia, Cross-sectional cost analysis
The economic burden of families with ASD child
Age
Household income
Services rehabilitation Special education
Domestic helper Transportation
Appendix 4. Estimation of total annual average costs of EIP
1. Annual Staff Emolument
Table 1. The estimation of annual staff cost utilized for EIP (N=238)
EIP centre
Annual total staff cost1 (RM)
Total no. of staff
Total no. of EIP staff
Proportion of EIP staff cost2
Annual total EIP staff cost3 (RM)
Annual average EIP staff cost per child (RM)
Centre 1 1,625,000.00 65 54 0.83 1,348,750.00 3,371.88
Centre 2 350,000.00 14 13 0.93 325,500.00 5,425.00
Centre 3 288,000.00 11 10 0.91 262,080.00 4,368.00
Centre 4 374,400.00 14 13 0.93 348,192.00 4,352.40
1
Estimated based on the total number of staffs in respected EIP centre
2
Proportion of EIP staff cost = Total no. of EIP staff / Total no. of staff
3
Annual EIP staff cost = Total annual staff cost * Proportion of EIP staff cost
2. Annual Utilities Cost
Table 2. The estimation of annual utilities cost utilized for EIP (N=238)
EIP center
Total floor area (ft2)
EIP floor area (ft2)
Annual total utilities cost1 (RM)
Proportion of EIP utilities cost2
Annual total EIP utilities cost3 (RM)
Annual average EIP utilities cost per child (RM)
Centre 1 113256 22651 271,814.00 0.20 54,362.80 135.91
Centre 2 6400 1600 15,360.00 0.25 3,840.00 64.00
Centre 3 3200 1400 7,680.00 0.44 3,379.20 56.32
Centre 4 5400 1800 12,960.00 0.33 4,276.80 53.46
1
Estimated based on Malaysia utilities data published online at https://www.numbeo.com/cost-of-living/; utilities cost per floor area per month in Kuala Lumpur
2
Proportion of EIP utilities cost = EIP floor area / Total floor area
3
Annual EIP utilities cost = Total annual utilities costs x Proportion of EIP utilities cost
3. Annual Maintenance Cost
Table 3. The estimation of annual maintenance cost utilized for EIP (N=238)
EIP center
Annual total maintenance cost1(RM)
Total floor area (ft2)
EIP floor area (ft2)
Proportion of EIP maintenance cost2
Annual total EIP
maintenance cost3 (RM)
Annual average EIP maintenance cost per child (RM)
Centre 1 297,297.00 113256 22651 0.20 59,459.40 148.65
Centre 2 16,800.00 6400 1600 0.25 4,200.00 70.00
Centre 3 8,400.00 3200 1400 0.44 3,696.00 61.60
Centre 4 14,175.00 5400 1800 0.33 4,677.75 58.47
1
Estimated based on the floor area (ft2) used for EIP activities in 2018
2
Proportion of EIP maintenance cost = EIP floor area / Total floor area
3
19
4. Annual Capital Cost
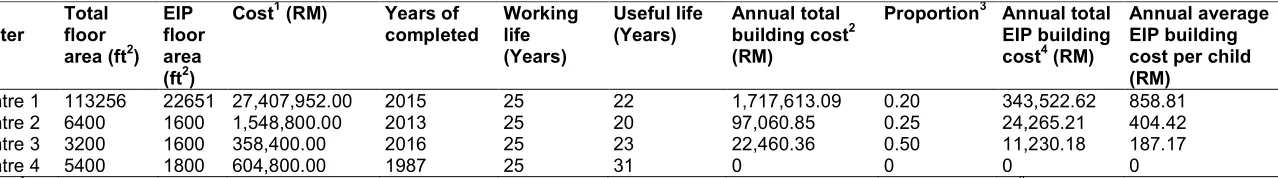
Table 4. The estimation of annual capital cost utilized for EIP (N=238)
EIP center
Total floor area (ft2)
EIP floor area (ft2)
Cost1 (RM) Years of completed
Working life (Years)
Useful life (Years)
Annual total building cost2 (RM)
Proportion3 Annual total EIP building cost4 (RM)
Annual average EIP building cost per child (RM)
Centre 1 113256 22651 27,407,952.00 2015 25 22 1,717,613.09 0.20 343,522.62 858.81
Centre 2 6400 1600 1,548,800.00 2013 25 20 97,060.85 0.25 24,265.21 404.42
Centre 3 3200 1600 358,400.00 2016 25 23 22,460.36 0.50 11,230.18 187.17
Centre 4 5400 1800 604,800.00 1987 25 31 0 0 0 0
1
Construction costs; estimated based on the JUBM & Arcadis Construction Cost Handbook Malaysia 2018, cost per floor area (RM / ft2) at the years of completed
2
Annual total building cost = Construction cost / Annualization factors (3% discounting rate, lifespan 25 years)
3
Proportion of EIP building cost = EIP floor area / Total floor area
4
5. Annual Patient Cost
Table 5. Annual out-of-pocket (OOP) expenditure reported per family due to having a child with ASD (N=238)
Type of expenses Proportion* Centre 1 (RM)
Centre 2(RM)
Centre 3(RM)
Centre 4 (RM) 1. Average education
costs:
1.1. Special education 0.11 532.40 2,024.00 745.25 1,210.00
1.2. Autism friendly activities 0.08 387.20 1,472.00 542.00 880.00
1.3. Childcare and assistance
0.16 774.40 2,944.00 1,084.00 1,760.00
1.4. Training/support costs 0.03 145.20 552.00 203.25 330.00
Sub-total 0.38 1,839.20 6,992.00 2,574.50 4,180.00
2. Average treatment costs:
2.1. Medical costs 0.19 919.60 3,496.00 1,287.25 2,090.00
Sub-total 0.19 919.60 3,496.00 1,287.25 2,090.00
3. Average living costs:
3.1. Living costs 0.29 1,403.60 5,336.00 1,964.75 3,190.00
3.2. Travel costs 0.09 435.60 1,656.00 609.75 990.00
3.3. Others 0.05 242.00 920.00 338.75 550.00
Sub-total 0.43 2,081.20 7,912.00 2,913.25 4,730.00
Grand total** 1 4,840.00 18,400.00 6,775.00 11,000.00
*Proportion of total OOP expenditure on EIP-related activities; adapted from Roddy et al., 2014 (N=195) **Reported by parents of ASD children from 4 different EIP centre in Klang Valley
© 2019 Najib and Juni; This is an Open Access article distributed under the terms of the Creative Commons Attribution License (http://creativecommons.org/licenses/by/4.0), which permits unrestricted use, distribution, and reproduction in any medium, provided the original work is properly cited.
Peer-review history: