3 JNSD 2017; Vol.3, No.3: 3-10
Original Article
Open Access
www.jnsd.tums.ac.ir
Dietary patterns and risk of multiple sclerosis: a
case-control study
Zohreh Hosseini
a, Maryam Behrouz
b, Elena Philippou
c, Fatemeh Keykhaei
a, Mohsen
Nematy
d*a Departement of Nutrition, Varastegan Institute for Medical Sciences, Mashhad, Iran
b Community Nutrition Department, School of Nutrition Sciences and Food Technology, National
Nutrition and Food Technology Research Institute (WHO Collaborating Center), Shahid Beheshti University of Medical Sciences, Tehran, Iran
c Department of Life and Health Sciences, University of Nicosia, Nicosia, Cyprus
d Biochemistry of Nutrition Research Center, School of Medicine, Mashhad University of Medical
Science, Mashhad, Iran
A B S T R A C T
Article History
Received:
19/02/2017
Revised:
15/04/2017
Accepted:
29/06/2017
Objective:To evaluate the association between major dietary patterns and the risk factors for kidney stone formation among Iranian men.
Methods: This cross-sectional study was conducted on 264 adult men, aged 19-89 years. The usual dietary intake of the participants over the previous year was collected using a validated semiquantitative food frequency questionnaire. Anthropometric measurements were recorded and 24-h urine samples were collected. Binary logistic regressions were used to evaluate the associations.
Results:Two major dietary patterns were identified in the study population: a healthy dietary pattern and a Western dietary pattern. A significant inverse relationship was seen between the healthy dietary pattern and the risk of MS (OR: 0.30, 95% CI: 0.09-0.47, p < 0.001), while there was a marginally significant association between adherence to a Western diet and development of MS after controlling for confounders (OR: 2.16, 95% CI: 0.95-4.89, p = 0.06).
Conclusion:Following a healthy dietary pattern is related to a reduced risk of MS while following a Western dietary pattern is marginally related to an increased MS risk.
Citation: Zohreh Hosseini, Maryam Behrouz, Elena Philippou, Fatemeh Keykhaei,
Mohsen Nematy. Dietary patterns and risk of multiple sclerosis: a case-control study.
J Nutr Sci & Diet 2017; 3(3): 63-70.
Keywords:
Multiple sclerosis, Dietary pattern, Factor analysis
Introduction
Multiple sclerosis (MS) is the most prevalent autoimmune disease of the central nervous system (CNS). It develops most often in late adolescence and increases rapidly after the age of 18, reaching its peak between the ages of 25 and 35 [1, 2]. The
risk of MS is greater in women than in men [3].
While symptoms vary widely between
individuals [4], it is mostly characterized by fatigue, paralysis, numbness of the limbs, visual loss, bladder and bowel dysfunction, dysphasia, and psychological disorders [2]. MS is relatively common in Europe, the United States, Canada, New Zealand, and parts of Australia [5, 6], but is rare in Asia. and in all continents, it is rare in the tropics and subtropics [7]. In Iran, there are more than 40 000 diagnosed MS cases, and the ____________________________________________
Corresponding author:
Mohsen Nematy, MD, MSc, PhD
Biochemistry of Nutrition Research Center, School of Medicine, Mashhad University of Medical Sciences, Mashhad, Iran,
MS and food patterns
4 JNSD 2017; Vol.3, No. 3: 3-10
prevalence is increasing [8]. A study carried out in Tehran (Iran’s capital) showed that the average age of onset was 27 years and that the female to male ratio was 2.5 [9]. Another study found a prevalence of 35.5 per 100 000 in Isfahan (a major city in central Iran) [10].
Some dietary factors have been shown to be involved in the etiology of MS. Epidemiological studies indicate a variety of associations between MS and diet [11, 12], including a positive association between MS indices and intake of saturated fat of animal origin and a negative association between the incidence of MS and intake of omega-3 and omega-6 fatty acids. Several pathophysiological mechanisms have been suggested to explain the protective effects of these fatty acids, such as immunomodulatory effects, antioxidant actions, and effects on erythrocyte aggregation and microcirculation, as well as the structural significance of these fatty acids to the CNS, as they are components of the myelin membrane [13, 14]. Other dietary components associated with an increase in the incidence of MS include sweets, alcohol, smoked meat products, coffee, and tea(4).
The World Health Organization (WHO) suggests that assessments of populations’ food intake should be based on dietary patterns rather than on nutrients since the consumption of different foods results in a complex combination of chemical compounds that can be antagonistic, compete with each other, or change the bioavailability of other chemical compounds or nutrients [15]. Dietary patterns can be identified using factor analysis, which models interrelated variables (food items) as manifestations of composite factors. These factors represent eating patterns in the study population and help to
distinguish individuals according to the
combination of foods they choose to eat [16]. Thus, cluster and factor analyses have emerged as methods to empirically derive dietary (or food) patterns and possibly explain nutrient-disease relationships [17]. Previous studies have investigated single foods or nutrients in association with MS, but to the best of our knowledge, only one study in Iran investigated the relationship between dietary patterns and risk of MS [18]. Nevertheless, the possible associations of food patterns with MS are still understudied, and thus the present study aimed to examine the relationship between dietary patterns and risk of MS in Iran in order to shed more light on the possible diet-disease association(s).
Subjects and methods
Subjects
In this case-control study, 68 recently diagnosed MS patients aged 20-60 years old admitted to the major neurological clinics of
Tehran between January and March 2012 were recruited. Because there was no similar study in this regard, we assumed an odds ratio (OR) = 3 for calculating the sample size according to the following formula:
Diagnosis of MS was confirmed by a neurologist based on McDonald’s criteria, and only incident cases of MS were included to reduce the likelihood of patients altering their dietary patterns because of the disease. A total of 140 control patients suffering from any condition unrelated to diet or other major risk factors of MS were also recruited from the same hospital. Controls were frequency-matched for sex and age (5-yr groups). For both cases and controls, the exclusion criteria were following a specific diet during the previous year or the current use of dietary supplements. This study was conducted according to the guidelines laid down in the Declaration of Helsinki, and all procedures involving human subjects/patients were approved by the Shahid Beheshti University of Medical Science Ethics Committee. Written informed consent was obtained from all subjects before participation.
Dietary assessment
Dietary information on the previous year’s intake was collected using a previously validated 168-item semi-quantitative food frequency questionnaire (FFQ) [19] consisting of a list of foods commonly consumed by Iranians. Food frequency was recorded on a daily, weekly, or monthly basis, and portion sizes defined by the US Department of Agriculture (USDA) were used (e.g., apple, 1 medium). Whenever using the
(
OR
~
3
،
5 . 0
P1
،
1
2
case
control
C
),
1) -(OR P 1
OR P P
1 1
2
,
75 . 0
P2
2
P
P
P
1
2,
2 2 1
/ -1 -1
)
P
-(P
P)
-P(1
Z
(Z
1/C)
(1
N
2
Mojtaba Shafiee
, et al.
5 USDA portion sizes was not possible, household measures (e.g., beans, 1 tablespoon; chicken meat, 1 leg or wing; rice, 1 large, medium, or small portion) were used [20]. Data were computed into the average monthly intake based on the assumption that each month is equal to 30.5 days. Additionally, all participants were asked about the main type of milk consumed during the first two years of life (breast milk vs cow’s milk) and the use of vitamin D supplements before MS diagnosis. The reason for asking these questions was that cow’s milk consumption during childhood has been linked to MS development [21], while a protective effect of Vitamin D on the risk of MS has been proposed [22].
Anthropometrics and other data collected
Height was measured in a standing position without shoes, with the feet together and the head in the horizontal Frankfurter plane, using a non-stretch tape measure fixed to a wall. and was recorded to the nearest 0.5 cm. Weight was measured in light clothing, without shoes on a digital scale (Soehnle, Germany) and was recorded to the nearest 100 g. Body mass index (BMI) was then calculated by dividing weight in kilograms (kg) by height in meters squared (m2). Furthermore, the following data were also collected using a self-administered questionnaire: MS family history (yes/no), smoking (yes/no), participation in leisure-time physical activity (yes/no), season and place of the birth, history of rubella and measles (yes/no), and amount of imposed stress during the day subjectively assessed by the participant (low/moderate/high).
Statistical analysis
Statistical analysis was performed using the Statistical Package for Social Sciences (SPSS v. 14, Chicago, IL). Data were assessed for normality using the Kolmogorov-Smirnov test, and are expressed as means ± SD (for normally distributed data) or median and interquartile range (for non-normally distributed data).
Dietary pattern assessment
Factor analysis was used to identify major dietary patterns based on 23 food groups. All food items were allocated into one of these food groups based on the nutrient resemblance between the food items. The factors were rotated by orthogonal transformation. A scree plot was used and the factors with eigenvalues > 2 were selected. The amount of food group consumption was weighted by factor loading, and the factor score for each pattern was obtained by summing up the factor loadings. Each participant was given a factor score for each identified dietary pattern,
and then participants were categorized into two groups based on the median of pattern scores: group 1: pattern score ≤ median, group 2: pattern score > median. Logistic regression was used to assess the relationship between dietary patterns and risk of MS. The Mantel-Haenszel chi-square test was used to compare qualitative variables, and t tests were used to compare means between groups. Using the modified Nutritionist 4 software, the daily intakes of total energy, protein, carbohydrate, fiber, total fat, monounsaturated fatty acids, cholesterol, and other nutrients were determined. (data presented elsewhere [23]).
Age, season of birth, consumption of cow’s milk during the first 2 years of life, and perceived daily stress were considered as potential confounders and included in the models. A p value of < 0.05 was considered statistically significant and all reported p values are two-sided.
Results
Results
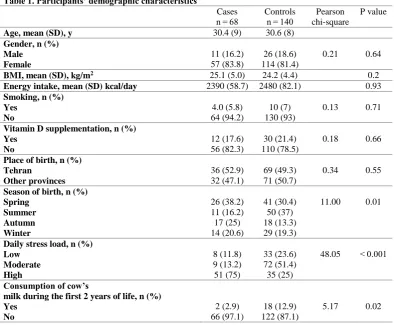
Table 1 shows the demographic
characteristics, the intake of vitamin D supplement, daily stress, and cow’s milk consumption during the first two years of life. Perceived daily stress, season of birth and consumption of cow’s milk during the first two years of life were significantly different between cases and controls (p < 0.05).
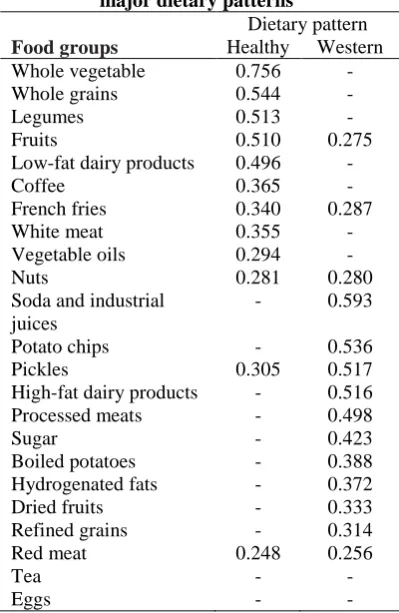
Factor analysis revealed two major dietary patterns: a healthy dietary pattern characterized by high intake of nuts, fruits, vegetables, whole grains, low-fat dairy, white meat, beans, vegetable oil, coffee, and fried potatoes, and a Western dietary pattern characterized by high consumption of hydrogenated fats, sugar, soda and industrially-packaged juices, high-fat dairy products, pickles, processed meat, red meat, refined grains, dried fruits, potato chips, and boiled potatoes. The scree plot used to find the major dietary patterns associated with the outcomes. As can be seen, of 23 identified dietary patterns, only the first 2 were associated with MS and used in further analysis. The relationships between the food groups of major dietary patterns and risk of MS are published elsewhere [24].
MS and food patterns
6 JNSD 2017; Vol.3, No. 3: 3-10
while more of the cases were consuming the Western dietary pattern.
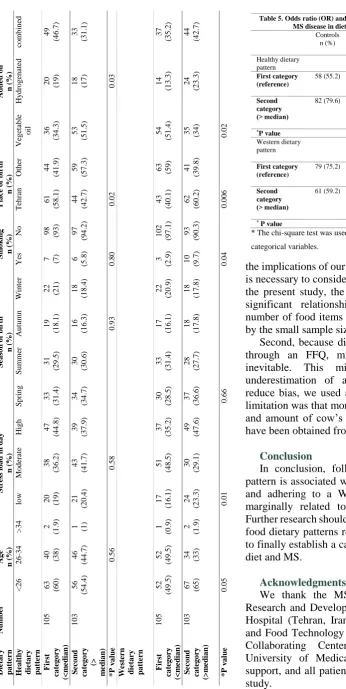
The distribution of major MS risk factors across the two dietary patterns is shown in Table 4. A greater healthy dietary pattern score was associated with a higher consumption of vegetables and not being born in Tehran (p < 0.05), while a greater Western dietary pattern score was associated with an increased probability of smoking, higher daily stress, consumption of hydrogenated fats and vegetable oils combined, and being born in Tehran (p < 0.05). In Table 5, the ORs and 95% confidence intervals for MS across categories of dietary patterns can be seen. After adjustments for confounding factors (age, gender, season of birth, perceived stress, and total energy intake) (the difference in smoking status was not significant between case and controls), subjects whose healthy dietary pattern score was above the median had a 70% lower risk of MS compared with those with healthy dietary pattern score of less than or equal to the median (OR: 0.30, CI: 0.09-0.47, p < 0.001). On the other hand, those whit Western dietary pattern score above the median were at a greater (marginally significant) risk of developing MS compared with those who had a Western dietary pattern score less than or
equal to the median (OR: 2.16, CI: 0.95-4.89, p = 0.06).
Discussion
In this study, two major dietary patterns were identified. The first pattern resembled a healthy dietary pattern with the exception of fried potatoes and perhaps coffee, and the second dietary pattern had characteristics of the Western dietary pattern, with the exception of dried fruits and boiled potatoes. It was shown that adhering to the healthy dietary pattern was significantly associated with a 70% lower risk of MS, while a marginally significant positive association was found when evaluating the effect of the Western dietary pattern on MS risk. These findings are important because they contribute to our understanding of how diet can affect the risk of MS.
In a previous study by Jahromi et al [18] conducted in Tehran, seven dietary patterns were identified, and it was shown that the prevalence of MS was higher in those who had a dietary pattern high in animal fat (high in animal fats, potato, meat products, sugars, and hydrogenated fats) and low in whole grains, which is not consistent with our findings. Other studies have mainly evaluated the association of single foods or nutrients with MS risk and proposed the consumption of
Table 1. Participants’ demographic characteristics
Cases n = 68
Controls n = 140
Pearson chi-square
P value
Age, mean (SD), y 30.4 (9) 30.6 (8)
Gender, n (%) Male
Female
11 (16.2) 57 (83.8)
26 (18.6) 114 (81.4)
0.21 0.64
BMI, mean (SD), kg/m2 25.1 (5.0) 24.2 (4.4) 0.2
Energy intake, mean (SD) kcal/day 2390 (58.7) 2480 (82.1) 0.93
Smoking, n (%) Yes
No
4.0 (5.8) 64 (94.2)
10 (7) 130 (93)
0.13 0.71
Vitamin D supplementation, n (%) Yes
No
12 (17.6) 56 (82.3)
30 (21.4) 110 (78.5)
0.18 0.66
Place of birth, n (%) Tehran
Other provinces
36 (52.9) 32 (47.1)
69 (49.3) 71 (50.7)
0.34 0.55
Season of birth, n (%) Spring
Summer Autumn Winter
26 (38.2) 11 (16.2) 17 (25) 14 (20.6)
41 (30.4) 50 (37) 18 (13.3) 29 (19.3)
11.00 0.01
Daily stress load, n (%) Low
Moderate High
8 (11.8) 9 (13.2) 51 (75)
33 (23.6) 72 (51.4) 35 (25)
48.05 < 0.001
Consumption of cow’s
milk during the first 2 years of life, n (%) Yes
No
2 (2.9) 66 (97.1)
18 (12.9) 122 (87.1)
Mojtaba Shafiee
, et al.
7 saturated and animal fat, high-fat dairy products, and red meat as risk factors for MS [25-28]. Additionally, several studies showed that sufficient intake of vitamin D, polyunsaturated fatty acids, especially omega-3 and omega-6 fatty acids, fruits, vegetables, low-fat milk, plant protein, fiber, antioxidants (particularly vitamin C), B vitamins, calcium, and potassium had protective effects on MS occurrence [25-27, 29, 30]. However, not all studies confirmed an association between nutrition and risk of MS, perhaps due to the complexity involved in the identification of dietary patterns and the many potential confounders [27, 31, 32]. A study in Croatia, a country with one of the highest rates of MS in Europe, showed that MS patients had a higher consumption of animal fat and high-fat dairy in comparison with healthy controls [28].
In the present study, it was also shown that with increasing Western dietary pattern score, subjects were more likely to smoke, a factor which may have confounded the findings since an association between smoking and risk of MS has been established [33, 34]. Although the mechanism is unclear, nitric oxide, which has been implicated in demyelination and axonal loss [35, 36], may have more detrimental health
effects in the setting of low consumption of fruits and vegetables, which have proven beneficial effects in disease prevention possibly owing to their content of compounds such as phenols,
dithioltion, indoles, isoflavones, protease
inhibitors, and plant sterols [37, 38].
With regard to our findings that closer adherence to a healthy dietary pattern is associated with a reduced MS risk, a number of explanations are plausible. This dietary pattern may be higher in antioxidants and vitamins such as vitamin C and vitamin E, which contribute to the neutralization of free radicals and prevention of lipid peroxidation in the brain white matter [39]. Moreover, a dietary pattern rich in nuts, legumes, whole grains, and dark leafy vegetables is an important source of magnesium, which has been shown to exert neuroprotective effects in white matter ischemia and traumatic axonal injury preparations [40]. On the other hand, the Western dietary pattern was associated with a higher daily stress with potential detrimental effects. This is of note since Warren et al [41] found that a significantly greater number of MS patients than healthy controls reported unusual stress, both according to their subjective assessment and according to the number of potentially stressful life events they had experienced; therefore, the effect of stress on MS occurrence needs to be further investigated.
This study had a number of strengths and limitations. With regard to strengths, we recruited incident cases to decrease the possibility of recall bias. Control subjects were also carefully selected from patients with conditions unrelated to diet or other major risk factors of MS. However, before
Table 2. Factor loading matrix for the two major dietary patterns1
Dietary pattern
Food groups Healthy Western
Whole vegetable 0.756 -
Whole grains 0.544 -
Legumes 0.513 -
Fruits 0.510 0.275
Low-fat dairy products 0.496 -
Coffee 0.365 -
French fries 0.340 0.287
White meat 0.355 -
Vegetable oils 0.294 -
Nuts 0.281 0.280
Soda and industrial juices
- 0.593
Potato chips - 0.536
Pickles 0.305 0.517
High-fat dairy products - 0.516
Processed meats - 0.498
Sugar - 0.423
Boiled potatoes - 0.388
Hydrogenated fats - 0.372
Dried fruits - 0.333
Refined grains - 0.314
Red meat 0.248 0.256
Tea - -
Eggs - -
1Values < 0.2 were excluded for simplicity.
Table 3. Distribution of subjects across dietary pattern categories
Total Cases
n (%)
Controls n (%)
Healthy dietary pattern
Below or equal to median intake (reference)
105 47
(44.8%)
58 (55.2%)
Above median intake
103 21
(20.4%)
82 (79.6%)
*P value < 0.001
Western dietary pattern
Below or equal to median intake
105 26
(24.8%)
79 (75.2%) Above median
intake
103 42
(40.8%)
61 (59.2%)
*P value 0.01
MS and food patterns
8 JNSD 2017; Vol.3, No. 3: 3-10
the implications of our findings are considered, it is necessary to consider potential biases. First, in the present study, the absence of a statistically significant relationship between MS and a number of food items might be partly explained by the small sample size (lack of precision).
Second, because dietary intake was assessed through an FFQ, misclassification bias was inevitable. This might have led to an underestimation of associations, although to reduce bias, we used a validated FFQ. Another limitation was that more details on the frequency and amount of cow’s milk consumption should have been obtained from patients.
Conclusion
In conclusion, following a healthy dietary pattern is associated with a reduced risk of MS, and adhering to a Western dietary pattern is marginally related to an increased MS risk. Further research should focus on identifying other food dietary patterns related to MS risk in order to finally establish a causal relationship between diet and MS.
Acknowledgments
We thank the MS organization staff, the Research and Development Department of Sina Hospital (Tehran, Iran), the National Nutrition and Food Technology Research Institute (WHO Collaborating Center of Shahid Beheshti University of Medical science) for financial support, and all patients that participated in this study. T able 4. D ist ri bu ti on o f ri sk fac tor s fo r m u lt ipl e s cl er os is ba se d on t he t w o di et ary pat ter n s D ie ta ry p a tt er n N u m b er A g e n ( % ) S tr ess l o a d i n d a y n ( % ) S ea so n o f b ir th n ( % ) S m o k in g n ( % ) Pl a ce o f b ir th n ( % ) A d d ed o il n ( % ) Hea lt h y d ie ta ry p a tt er n < 26 26 -34 > 3 4 lo w M o d er at e H ig h S p ri n g S u mm er A u tu mn W in te r Y es No T eh ra n O th er V eg et ab le o il H y d ro g en at ed co mb in ed F ir st ca te g o ry (< m ed ia n ) 1 0 5
63 (60
)
40 (38
)
2
(1
.9
)
20 (19
) 38 (3 6 .2 ) 47 (4 4 .8 ) 33 (3 1 .4 ) 31 (2 9 .5 ) 19 (1 8 .1 )
22 (21
)
7 (7)
98 (93
) 61 (5 8 .1 ) 44 (4 1 .9 ) 36 (3 4 .3 )
20 (19
) 49 (4 6 .7 ) S ec o n d ca te g o ry (> m ed ia n ) 1 0 3 56 (5 4 .4 ) 46 (4 4 .7 )
1 (1)
21 (2 0 .4 ) 43 (4 1 .7 ) 39 (3 7 .9 ) 34 (3 4 .7 ) 30 (3 0 .6 ) 16 (1 6 .3 ) 18 (1 8 .4 ) 6 (5 .8 ) 97 (9 4 .2 ) 44 (4 2 .7 ) 59 (5 7 .3 ) 53 (5 1 .5 )
18 (17
) 33 (3 1 .1 ) *P v a lue 0 .5 6 0 .5 8 0 .9 3 0 .8 0 0 .0 2 0 .0 3 W est er n d ie ta ry p a tt er n F ir st ca te g o ry (< m ed ia n ) 1 0 5 52 (4 9 .5 ) 52 (4 9 .5 ) 1 (0 .9 ) 17 (1 6 .1 ) 51 (4 8 .5 ) 37 (3 5 .2 ) 30 (2 8 .5 ) 33 (3 1 .4 ) 17 (1 6 .1 ) 22 (2 0 .9 ) 3 (2 .9 ) 1 0 2 (9 7 .1 ) 43 (4 0 .1 )
63 (59
) 54 (5 1 .4 ) 14 (1 3 .3 ) 37 (3 5 .2 ) S ec o n d ca te g o ry (> m ed ia n ) 1 0 3
67 (65
)
34 (33
) 2 (1 .9 ) 24 (2 3 .3 ) 30 (2 9 .1 ) 49 (4 7 .6 ) 37 (3 6 .6 ) 28 (2 7 .7 ) 18 (1 7 .8 ) 18 (1 7 .8 )
10 (9.7
) 93 (9 0 .3 ) 62 (6 0 .2 ) 41 (3 9 .8 )
35 (34
) 24 (2 3 .3 ) 44 (4 2 .7 ) * P v a lue 0 .0 5 0 .0 1 0 .6 6 0 .0 4 0 .0 0 6 0 .0 2
Table 5. Odds ratio (OR) and 95% confidence interval (CI) for MS disease in dietary pattern categories
Controls n (%) Cases n (%) OR (95% CI) Adjusted OR (95% CI) Healthy dietary pattern First category (reference)
58 (55.2) 47
(44.8)
1.00 1.00
Second category (> median)
82 (79.6) 21
(20.4) 0.31 (0.17-0.58) 0.30 (0.09-0.47)
*P value < 0.001 < 0.001
Western dietary pattern
First category (reference)
79 (75.2) 26
(24.8)
1.00 1.00
Second category (> median)
61 (59.2) 42
(40.8) 2.09 (1.15-3.78) 2.16 (0.95-4.89)
* P value < 0.001 0.06
* The chi-square test was used to calculated P value between
Mojtaba Shafiee
, et al.
9
Conflict of Interests
The authors declare that there is no conflict of interests regarding the publication of this paper.
References
1. Ascherio Alberto, Munger Kassandra L.
Environmental Risk Factors for Multiple Sclerosis. Part I: The Role of Infection. Ann Neurol. 2007;61:288–99.
2. Shirazi mohammad Dietary supplementation in Iranian Multiple Sclerosis patients. JMedSci. 2007;7(3):413-7.
3. Orteon SM. , Herrera BM, Yee IM. Sex ratio of multiple sclerosis in Canada: a longitudinal study. Lancet Neurol. 2006;5(932-936).
4. Payne. Nutrition and diet in the clinical management of multiple sclerosis. J Hum Nutr Dietet. 2001;14:349-57.
5. Mayr WT, Pittock SJ, McClelland RL. Incidence and prevalence of multiple sclerosis in Olmsted
County, Minnesota, 1985-2000. Neurology.
2003;61:1375-7.
6. Henriksen K, Hyllested k. Epidemiology of multiple sclerosis: incidence and prevalence rates in Denmark 1948-64 based on the Danish Multiple
Sclerosis Registry. Acta Neurol Scand
1998;78(369–380).
7. Kurtzke JF MS epidemiology world wide. One view of current status. Acta Neurol Scand. 1995;161:23-33.
8. Mohseninia M. Multiple sclerosis in Iran J Iranian MS Soc. 2004;2:47-50.
9. Kalanie H, Gharagozli K, ., Kalani AR. Multiple sclerosis : Report on 200 cases from Iran. MultScler. 2003;936-38.
10. Etemadifar M, Janghornani M. Prevalence of
multiple sclerosis in Isfahan, Iran.
Neuroepidemiology 2006;27:39-44.
11. H . Coo, Aronson K. A systematic review of several potential non-genetic risk factors for multiple sclerosis. Neuroepidemiology. 2004;23:1-12.
12. k , Lauer. Diet and multiple sclerosis. Neurology. 1997;49:55-61.
13. Das UN. Is there a role for saturated and long-chain fatty acids in multiple sclerosis? Nutrition. 2003;19(2):163-6.
14. Schwarz S, Leweling H. Multiple sclerosis and nutrition. Multiple sclerosis. 2005;11(1):24-32. 15. Marsola Fabiana Castillo , Rinaldi Ana Elisa M ,
Siqueira Muriel , . Association of dietary patterns with metabolic syndrome components in low-income, free-living Brazilian adults International
Journal of Nutrition and Metabolism.
2011;3(2):31-8.
16. Rashid Khani B, Ye W, Terry P. Reproducibility
and Validity of Major Dietary Patterns among Swedish Women Assessed with a Food-Frequency
Questionnaire. Nutritional Methodology.
2004:1541-45.
17. Newby PK , Muller Denis , Hallfrisch Judith , Andres Reubin, Tucker Katherine L Food patterns measured by factor analysis and anthropometric changes in adults. Am J Clin Nutr. 2004;80:504-13.
18. Razeghi Jahromi Soodeh, Toghae, , Mohammad RJ. Dietary pattern and risk of multiple sclerosis Ir J neurol. 2012;11(2):47-53.
19. Esmaillzadeh A, Mirmiran P, Azizi F. Whole-grain consumption and the metabolic syndrome: a favorable association in Tehranian adults. Eur J Clin Nutr. 2005;59(3):353-62.
20. Ghaffarpour M, Houshiar-Rad A , Kianfar H. The manual for household measures, cooking yields factors & edible portion of foods. Tehran. Agriculture Sciences Press [in Persian]. 1999. 21. Malosse D, Perron H, Sasco A, Seigneurin J.
Correlation between milk and dairy product consumption and multiple sclerosis prevalence: a worldwide study. Neuroepidemiology. 1992;11(4-6):304-12.
22. Munger KL, Zhang S, O’reilly E, Hernan M, Olek M, Willett W, et al. Vitamin D intake and incidence of multiple sclerosis. Neurology. 2004;62(1):60-5. 23. Behrooz M, Asghari G, Hosseini Z, Mirmiran P, Rashidkhani B. Association of Macro-and Micro-nutrients Intake with the Risk of Multiple Sclerosis: A Case Control Study. Nutrition and Food Sciences Research. 2014;1(2):27-33. 24. Behrouz M, Hosseini Z, Sedaghat F, Soufi M,
Rashidkhani B. The relationship between Food Groups and Multiple Sclerosis disease: a case control study in tehranian adult. Journal of School of Public Health and Institute of Public Health Research. 2014;11(3):39-53.
25. Ghadirian P, Jain M, Ducic S, Shatenstein B, Morisset R. Nutritional factors in the aetiology of multiple sclerosis: a case-control study in Montreal, Canada. International journal of epidemiology. 1998;27(5):845.
26. Pekmezovic TD, Tepavcevic DBK, Mesaros ST, Dujmovic IB, Basuroski2 NS, Drulovic JS. Food and dietary patterns and multiple sclerosis: a case-control study in Belgrade (Serbia).
27. Ascherio A, Munger KL. Environmental risk factors for multiple sclerosis. Part II: Noninfectious factors. . Annals of neurology. 2013;61(6):504-13. 28. Tola M, Granieri E, Malagu S, Caniatti L, Casetta I, Govoni V, et al. Dietary habits and multiple sclerosis. A retrospective study in Ferrara, Italy. Acta neurologica. 1994;16(4):189.
MS and food patterns
10 JNSD 2017; Vol.3, No. 3: 3-10
Ascherio A. Multiple sclerosis and age at infection
with common viruses. Epidemiology.
2001;12(3):301.
31. Zhang SM, Willett WC, Hernán MA, Olek MJ, Ascherio A. Dietary fat in relation to risk of multiple sclerosis among two large cohorts of women. American journal of epidemiology. 2000;152(11):1056.
32. Cendrowski W, Wender M, Dominik W, Flejsierowicz Z, Owsianowski M, Popiel M. Epidemiological study of multiple sclerosis in
western Poland. European neurology.
1969;2(2):90.
33. Hernán Miguel A, Olek Michael J, Ascherio Alberto. Cigarette Smoking and Incidence of
Multiple Sclerosis. American Journal of
Epidemiology. 2001;154(1):69-74.
34. Handel Adam E, Williamson Alexander J, Disanto Giulio, Dobson Ruth, Giovannoni Gavin. Smoking and Multiple Sclerosis: An Updated Meta-Analysis. Adam E. 2011; 6( 1) e16149.
35. Smith KJ, Kapoor R, Felts PA. Demyelination: the role of reactive oxygen and nitrogen species. Brain Pathol 1999;9: 69–92.
36. Scolding N, Franklin R. Axon loss in multiple sclerosis. Lancet 1998;352:340–341.
37. Materljan E, Materljan M, Materljan B, Vlacić H, Barićev-Novaković Z, Sepcić J. Multiple sclerosis and cancers in Croatia--a possible protective role of
the "Mediterranean diet". Coll Antropol.
2009;33(2):539-45.
38. Kontou N, Psaltopoulou T, Panagiotakos D, Dimopoulos MA, Linos A. The mediterranean diet in cancer prevention: a review. J Med Food.
2011;14(10):1065-78. doi:
10.1089/jmf.2010.0244. Epub 2011 Jun 11. 39. Perković O, Jurjević A, Rudez J, Antoncić I, Bralić
M, Kapović M. The town of Cabar, Croatia, a high
risk area for multiple sclerosis--analytic
epidemiology of dietary factors. Coll Antropol. 2010;2:135-40.
40. Heath DL, Vink R. Optimization of magnesium therapy after severe diffuse axonal brain injury in rats. J Pharmacol Exp Ther. 1999; 288:1311-1316.
41. Warren Sharon, Greenhil.S, Warren K.